Rush County, Indiana
Rush County is a county located in the U.S. state of Indiana. As of 2010, the population was 17,392.[1] The county seat is Rushville.[2]
Rush County | |
|---|---|
.jpg) The Rush County Courthouse in Rushville | |
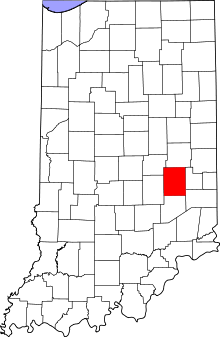 Location within the U.S. state of Indiana | |
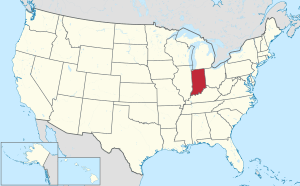 Indiana's location within the U.S. | |
| Coordinates: 39°37′N 85°28′W | |
| Country | |
| State | |
| Founded | 1822 |
| Named for | Benjamin Rush |
| Seat | Rushville |
| Largest city | Rushville |
| Area | |
| • Total | 408.46 sq mi (1,057.9 km2) |
| • Land | 408.12 sq mi (1,057.0 km2) |
| • Water | 0.34 sq mi (0.9 km2) 0.08%% |
| Population | |
| • Estimate (2018) | 16,663 |
| • Density | 43/sq mi (16.45/km2) |
| Time zone | UTC−5 (Eastern) |
| • Summer (DST) | UTC−4 (EDT) |
| Congressional district | 6th |
| Website | rushcounty |
| Indiana county number 70 | |

History
Rush County was formed on April 1, 1822. It was named in honor of Dr. Benjamin Rush, who signed the Declaration of Independence.[3]
Geography
According to the 2010 census, the county has a total area of 408.46 square miles (1,057.9 km2), of which 408.12 square miles (1,057.0 km2) (or 99.92%) is land and 0.34 square miles (0.88 km2) (or 0.08%) is water.[4] It is drained by Big Blue River and Flat Rock Creek.[5][6]
Cities
Unincorporated towns
Townships
Adjacent counties
- Henry County (north)
- Fayette County (east)
- Franklin County (southeast)
- Decatur County (south)
- Shelby County (west)
- Hancock County (northwest)
Major highways


- I-74/US 421 clips the southwestern corner of Rush County
Climate and weather
| Rushville, Indiana | ||||||||||||||||||||||||||||||||||||||||||||||||||||||||||||
|---|---|---|---|---|---|---|---|---|---|---|---|---|---|---|---|---|---|---|---|---|---|---|---|---|---|---|---|---|---|---|---|---|---|---|---|---|---|---|---|---|---|---|---|---|---|---|---|---|---|---|---|---|---|---|---|---|---|---|---|---|
| Climate chart (explanation) | ||||||||||||||||||||||||||||||||||||||||||||||||||||||||||||
| ||||||||||||||||||||||||||||||||||||||||||||||||||||||||||||
| ||||||||||||||||||||||||||||||||||||||||||||||||||||||||||||
In recent years, average temperatures in Rushville have ranged from a low of 17 °F (−8 °C) in January to a high of 84 °F (29 °C) in July, although a record low of −28 °F (−33 °C) was recorded in January 1994 and a record high of 108 °F (42 °C) was recorded in July 1901. Average monthly precipitation ranged from 2.55 inches (65 mm) in February to 5.06 inches (129 mm) in May.[7]
Government
The county government is a constitutional body, and is granted specific powers by the Constitution of Indiana, and by the Indiana Code.
County Council: The county council is the legislative branch of the county government and controls all the spending and revenue collection in the county. Representatives are elected from county districts. The council members serve four-year terms. They are responsible for setting salaries, the annual budget, and special spending. The council also has limited authority to impose local taxes, in the form of an income and property tax that is subject to state level approval, excise taxes, and service taxes.[8][9]
Board of Commissioners: The executive body of the county is made of a board of commissioners. The commissioners are elected county-wide, in staggered terms, and each serves a four-year term. One of the commissioners, typically the most senior, serves as president. The commissioners are charged with executing the acts legislated by the council, collecting revenue, and managing the day-to-day functions of the county government.[8][9]
County Officials: The county has several other elected offices, including sheriff, coroner, auditor, treasurer, recorder, surveyor and circuit court clerk. Each of these elected officers serves a term of four years and oversees a different part of county government. Members elected to county government positions are required to declare party affiliations and to be residents of the county.[9]
| Year | Republican | Democratic | Third parties |
|---|---|---|---|
| 2016 | 73.4% 5,292 | 21.1% 1,525 | 5.5% 397 |
| 2012 | 65.9% 4,633 | 31.6% 2,221 | 2.5% 172 |
| 2008 | 56.0% 4,271 | 42.3% 3,229 | 1.7% 129 |
| 2004 | 72.3% 5,363 | 27.0% 2,000 | 0.8% 58 |
| 2000 | 65.2% 4,749 | 32.5% 2,370 | 2.3% 165 |
| 1996 | 51.5% 3,827 | 34.7% 2,578 | 13.8% 1,023 |
| 1992 | 48.4% 3,873 | 27.1% 2,168 | 24.6% 1,967 |
| 1988 | 67.4% 5,112 | 32.3% 2,451 | 0.3% 20 |
| 1984 | 69.9% 5,429 | 29.7% 2,307 | 0.5% 35 |
| 1980 | 64.3% 4,829 | 31.8% 2,388 | 3.9% 294 |
| 1976 | 60.3% 4,723 | 39.0% 3,052 | 0.7% 55 |
| 1972 | 77.0% 5,965 | 22.8% 1,764 | 0.3% 23 |
| 1968 | 59.4% 5,004 | 31.3% 2,636 | 9.3% 781 |
| 1964 | 49.9% 4,507 | 49.3% 4,450 | 0.8% 68 |
| 1960 | 63.5% 6,215 | 35.9% 3,516 | 0.5% 51 |
| 1956 | 64.7% 6,202 | 34.9% 3,346 | 0.4% 39 |
| 1952 | 66.8% 6,918 | 32.3% 3,348 | 0.8% 87 |
| 1948 | 57.5% 5,362 | 40.9% 3,814 | 1.6% 145 |
| 1944 | 59.6% 5,853 | 39.6% 3,891 | 0.8% 77 |
| 1940 | 60.0% 6,486 | 39.6% 4,282 | 0.4% 39 |
| 1936 | 47.5% 5,457 | 52.2% 5,999 | 0.4% 44 |
| 1932 | 49.5% 5,094 | 49.1% 5,056 | 1.4% 140 |
| 1928 | 68.4% 6,640 | 30.9% 2,996 | 0.8% 75 |
| 1924 | 62.6% 5,958 | 35.9% 3,415 | 1.6% 148 |
| 1920 | 56.6% 6,113 | 41.8% 4,513 | 1.6% 177 |
| 1916 | 51.2% 2,950 | 44.6% 2,569 | 4.2% 241 |
| 1912 | 34.6% 1,931 | 41.4% 2,312 | 24.0% 1,343 |
| 1908 | 53.0% 3,102 | 43.4% 2,544 | 3.6% 211 |
| 1904 | 54.1% 3,082 | 41.5% 2,363 | 4.4% 250 |
| 1900 | 52.2% 2,913 | 44.9% 2,503 | 2.9% 163 |
| 1896 | 51.9% 2,891 | 46.7% 2,602 | 1.4% 80 |
| 1892 | 51.3% 2,566 | 44.2% 2,210 | 4.6% 230 |
| 1888 | 52.5% 2,713 | 44.3% 2,292 | 3.2% 167 |
Demographics
| Historical population | |||
|---|---|---|---|
| Census | Pop. | %± | |
| 1830 | 9,707 | — | |
| 1840 | 16,456 | 69.5% | |
| 1850 | 16,445 | −0.1% | |
| 1860 | 16,193 | −1.5% | |
| 1870 | 17,626 | 8.8% | |
| 1880 | 19,238 | 9.1% | |
| 1890 | 19,034 | −1.1% | |
| 1900 | 20,148 | 5.9% | |
| 1910 | 19,349 | −4.0% | |
| 1920 | 19,241 | −0.6% | |
| 1930 | 19,412 | 0.9% | |
| 1940 | 18,927 | −2.5% | |
| 1950 | 19,799 | 4.6% | |
| 1960 | 20,393 | 3.0% | |
| 1970 | 20,352 | −0.2% | |
| 1980 | 19,604 | −3.7% | |
| 1990 | 18,129 | −7.5% | |
| 2000 | 18,261 | 0.7% | |
| 2010 | 17,392 | −4.8% | |
| Est. 2018 | 16,663 | [11] | −4.2% |
| U.S. Decennial Census[12] 1790-1960[13] 1900-1990[14] 1990-2000[15] 2010-2013[1] | |||
As of the 2010 United States Census, there were 17,392 people, 6,767 households, and 4,803 families residing in the county.[16] The population density was 42.6 inhabitants per square mile (16.4/km2). There were 7,508 housing units at an average density of 18.4 per square mile (7.1/km2).[4] The racial makeup of the county was 97.4% white, 0.8% black or African American, 0.3% Asian, 0.2% American Indian, 0.5% from other races, and 0.8% from two or more races. Those of Hispanic or Latino origin made up 1.1% of the population.[16] In terms of ancestry, 23.4% were German, 16.8% were American, 12.0% were Irish, and 11.9% were English.[17]
Of the 6,767 households, 32.8% had children under the age of 18 living with them, 54.9% were married couples living together, 10.9% had a female householder with no husband present, 29.0% were non-families, and 24.5% of all households were made up of individuals. The average household size was 2.54 and the average family size was 2.99. The median age was 40.6 years.[16]
The median income for a household in the county was $47,697 and the median income for a family was $52,874. Males had a median income of $41,581 versus $30,035 for females. The per capita income for the county was $21,215. About 10.3% of families and 12.8% of the population were below the poverty line, including 17.4% of those under age 18 and 9.3% of those age 65 or over.[18]
See also
- National Register of Historic Places listings in Rush County, Indiana
- Edward E. Moore, Indiana state senator and Los Angeles City Council member
References
- "Rush County QuickFacts". United States Census Bureau. Retrieved 2011-09-25.
- "Find a County". National Association of Counties. Retrieved 2011-06-07.
- De Witt Clinton Goodrich & Charles Richard Tuttle (1875). An Illustrated History of the State of Indiana. Indiana: R. S. Peale & co. p. 572.
- "Population, Housing Units, Area, and Density: 2010 - County". United States Census Bureau. Archived from the original on 2020-02-12. Retrieved 2015-07-10.
-

- AAA World Atlas. Hammond Inc. 1992. p. 227.
- "Monthly Averages for Rushville, Indiana". The Weather Channel. Retrieved 2011-01-27.
- Indiana Code. "Title 36, Article 2, Section 3". IN.gov. Retrieved 2008-09-16.
- Indiana Code. "Title 2, Article 10, Section 2" (PDF). IN.gov. Retrieved 2008-09-16.
- Leip, David. "Dave Leip's Atlas of U.S. Presidential Elections". uselectionatlas.org. Retrieved 2018-05-20.
- "Population and Housing Unit Estimates". Retrieved July 26, 2019.
- "U.S. Decennial Census". United States Census Bureau. Retrieved July 10, 2014.
- "Historical Census Browser". University of Virginia Library. Retrieved July 10, 2014.
- "Population of Counties by Decennial Census: 1900 to 1990". United States Census Bureau. Retrieved July 10, 2014.
- "Census 2000 PHC-T-4. Ranking Tables for Counties: 1990 and 2000" (PDF). United States Census Bureau. Retrieved July 10, 2014.
- "DP-1 Profile of General Population and Housing Characteristics: 2010 Demographic Profile Data". United States Census Bureau. Archived from the original on 2020-02-13. Retrieved 2015-07-10.
- "DP02 SELECTED SOCIAL CHARACTERISTICS IN THE UNITED STATES – 2006-2010 American Community Survey 5-Year Estimates". United States Census Bureau. Archived from the original on 2020-02-14. Retrieved 2015-07-10.
- "DP03 SELECTED ECONOMIC CHARACTERISTICS – 2006-2010 American Community Survey 5-Year Estimates". United States Census Bureau. Archived from the original on 2020-02-14. Retrieved 2015-07-10.
External links
Places adjacent to Rush County, Indiana | ||||||||||
|---|---|---|---|---|---|---|---|---|---|---|
| ||||||||||
Municipalities and communities of Rush County, Indiana, United States | ||
|---|---|---|
| City | Map of Indiana highlighting Rush County | |
| Towns | ||
| Townships | ||
| CDPs | ||
| Other unincorporated communities | ||
| Footnotes | ‡This populated place also has portions in an adjacent county or counties | |

| Authority control |
|
|---|