Uxbridge (UK Parliament constituency)
| Uxbridge | |
|---|---|
|
Former Borough constituency for the House of Commons | |
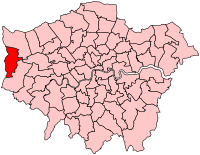 Boundary of Uxbridge in Greater London for the 2005 general election. | |
| County | Greater London |
| Major settlements | Uxbridge |
| 1885–2010 | |
| Number of members | One |
| Replaced by | Uxbridge and South Ruislip (bulk), and Ruislip, Northwood and Pinner (part) |
| Created from | Middlesex |
| During its existence contributed to new seat(s) of: |
Spelthorne Hayes and Harlington Southall (part) |
Uxbridge was a borough constituency represented by one Member of Parliament (MP) in the House of Commons of the UK Parliament, 1885—2010. Its MPs elected were the Conservative Party's candidates for 107 years and the Labour Party's candidates for 18 years. The closing 40 years of the seat's history saw elections won by a Conservative candidate — in 1997 on a very marginal majority in relative terms.
The seat was centred on the town of Uxbridge. In each of the possible boundary reforms the seat was reduced reflecting the population expansion of the areas outlying its core area of Uxbridge and interwoven Hillingdon, Cowley and nearby Ickenham.
Boundaries

1885–1918: The parliamentary constituency of Uxbridge was created as the westernmost county division of the historic county of Middlesex. The Redistribution of Seats Act 1885 defined the seat as comprising the parishes of Ashford*, Bedfont, Cowley, Cranford, Feltham, Hampton, Hampton Wick, Hanworth, Harefield, Harlington, Harmondsworth, Hayes, Hillingdon East, Hillingdon West, Ickenham, Laleham*, Littleton*, Northolt, Ruislip, Shepperton*, Staines*, Stanwell*, Sunbury*, Teddington, Uxbridge, West Drayton, and Yiewsley. The shape of the seat was irregular and it stretched more than three times the maximum length than its final form and twice its breadth.[1]
The parishes (as various successor urban districts) marked * were absorbed into Surrey and the others absorbed into Greater London, in 1965.


1918-1945: Uxbridge was cut down to be a north-western division of Middlesex. Large areas to the south were removed to form Spelthorne (UK Parliament constituency).
The local government areas in the new Uxbridge seat were defined, by the Representation of the People Act 1918, as the urban districts of Hayes, Ruislip-Northwood, Southall-Norwood, Uxbridge, and Yiewsley as well as the Uxbridge Rural District.
1945–1950: As part of an interim redistribution of parliamentary seats with more than 100,000 registered electors, changes were made. Uxbridge was reduced to the urban districts of Ruislip-Northwood and Uxbridge; shedding for five years to Spelthorne southerly Yiewsley and West Drayton Urban District.
1950–1974: In this general redistribution, Ruislip-Northwood became a new seat in the north and north-east. Uxbridge with immediate neighbours north south and east (together forming the Municipal Borough of Uxbridge in 1955) was re-united with Yiewsley and West Drayton, to form the last incarnation of the Uxbridge county division.
In 1965 the area of the constituency became part of the London Borough of Hillingdon.
1974–1983: The seat was re-classified as a borough constituency, comprising the Hillingdon wards of Colham-Cowley, Harefield, Hillingdon East, Hillingdon West, Ickenham, Uxbridge, and Yiewsley.
1983–1997: The constituency was unchanged from 1974, but following re-warding it comprised the wards of Colham, Cowley, Harefield, Hillingdon East, Hillingdon North, Hillingdon West, Ickenham, Uxbridge North, Uxbridge South, West Drayton, and Yiewsley.
1997–2010: There was a small boundary change, with Harefield ward being transferred to the Ruislip-Northwood constituency. The remaining wards were Colham, Cowley, Hillingdon East, Hillingdon North, Hillingdon West, Ickenham, Uxbridge North, Uxbridge South, West Drayton and Yiewsley.
Boundary review
Following their review of parliamentary representation in North London, the Boundary Commission for England has created a new constituency of Uxbridge and South Ruislip.
A number of electoral wards in Hillingdon are moved into the new constituency of Ruislip, Northwood and Pinner
Members of Parliament
Election results
Elections in the 1880s
| Party | Candidate | Votes | % | ± | |
|---|---|---|---|---|---|
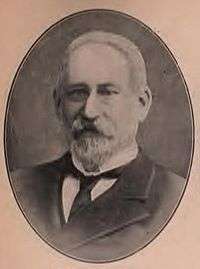
| Conservative | Frederick Dixon-Hartland | 5,093 | 66.1 | N/A | |
| Liberal | James Pellatt Rickman | 2,615 | 33.9 | N/A | |
| Majority | 2,478 | 32.2 | N/A | ||
| Turnout | 7,708 | 77.8 | N/A | ||
| Registered electors | 9,902 | ||||
| Conservative win (new seat) | |||||
| Party | Candidate | Votes | % | ± | |
|---|---|---|---|---|---|
| Conservative | Frederick Dixon-Hartland | Unopposed | |||
| Conservative hold | |||||
Elections in the 1890s
| Party | Candidate | Votes | % | ± | |
|---|---|---|---|---|---|
| Conservative | Frederick Dixon-Hartland | 5,172 | 71.8 | N/A | |
| Liberal | Leslie Probyn | 2,029 | 28.2 | N/A | |
| Majority | 3,143 | 43.6 | N/A | ||
| Turnout | 7,201 | 61.3 | N/A | ||
| Registered electors | 11,739 | ||||
| Conservative hold | Swing | N/A | |||
| Party | Candidate | Votes | % | ± | |
|---|---|---|---|---|---|
| Conservative | Frederick Dixon-Hartland | Unopposed | |||
| Conservative hold | |||||
Elections in the 1900s
| Party | Candidate | Votes | % | ± | |
|---|---|---|---|---|---|
| Conservative | Frederick Dixon-Hartland | Unopposed | |||
| Conservative hold | |||||

| Party | Candidate | Votes | % | ± | |
|---|---|---|---|---|---|
| Conservative | Frederick Dixon-Hartland | 6,429 | 50.6 | N/A | |
| Liberal | Sidney Job Pocock | 6,284 | 49.4 | N/A | |
| Majority | 145 | 1.2 | N/A | ||
| Turnout | 12,713 | 79.8 | N/A | ||
| Registered electors | 15,936 | ||||
| Conservative hold | Swing | N/A | |||
Elections in the 1910s

| Party | Candidate | Votes | % | ± | |
|---|---|---|---|---|---|
| Conservative | Charles Mills | 10,116 | 65.2 | +14.6 | |
| Liberal | Sidney Job Pocock | 5,408 | 34.8 | -14.6 | |
| Majority | 4,708 | 30.4 | +29.2 | ||
| Turnout | 88.0 | +8.2 | |||
| Conservative hold | Swing | +14.6 | |||
| Party | Candidate | Votes | % | ± | |
|---|---|---|---|---|---|
| Conservative | Charles Mills | 9,005 | 67.8 | +2.6 | |
| Liberal | Manmath Chandra Mallik | 4,286 | 32.2 | -2.6 | |
| Majority | 35.6 | +5.2 | |||
| Turnout | 75.4 | -12.6 | |||
| Conservative hold | Swing | +2.6 | |||
| Party | Candidate | Votes | % | ± | |
|---|---|---|---|---|---|
| Unionist | Arthur Mills | Unopposed | |||
| Unionist hold | |||||
| Party | Candidate | Votes | % | ± | |
|---|---|---|---|---|---|
| Unionist | 9,814 | 59.1 | n/a | ||
| Labour | Harry Gosling | 6,251 | 37.6 | n/a | |
| Liberal | Norman Mackenzie Snowball | 545 | 3.3 | n/a | |
| Majority | 3,563 | 21.5 | n/a | ||
| Turnout | 55.9 | n/a | |||
| Unionist hold | Swing | n/a | |||
- endorsed by Coalition Government
Elections in the 1920s
| Party | Candidate | Votes | % | ± | |
|---|---|---|---|---|---|
| Unionist | Dennistoun Burney | 12,391 | 52.7 | ||
| Labour | William Brown | 7,292 | 31.0 | ||
| National Liberal | F. S. Evans | 3,844 | 16.3 | ||
| Majority | 5,099 | 21.7 | |||
| Turnout | 73.0 | ||||
| Unionist hold | Swing | ||||

| Party | Candidate | Votes | % | ± | |
|---|---|---|---|---|---|
| Unionist | Dennistoun Burney | 9,254 | 40.6 | -12.1 | |
| Liberal | Graham Seton Hutchison | 7,423 | 32.5 | +16.2 | |
| Labour | Robert Small | 6,146 | 26.9 | -4.1 | |
| Majority | 1,831 | 8.1 | -13.6 | ||
| Turnout | 66.6 | -6.4 | |||
| Unionist hold | Swing | -14.2 | |||
| Party | Candidate | Votes | % | ± | |
|---|---|---|---|---|---|
| Unionist | Dennistoun Burney | 13,525 | 52.1 | ||
| Labour | Robert Small | 8,459 | 32.6 | ||
| Liberal | J S Griffith-Jones | 3,976 | 15.3 | ||
| Majority | 5,066 | 19.5 | |||
| Turnout | 71.8 | ||||
| Unionist hold | Swing | ||||
| Party | Candidate | Votes | % | ± | |
|---|---|---|---|---|---|
| Unionist | John Llewellin | 17,770 | 41.2 | -10.9 | |
| Labour | Reginald Bridgeman | 16,422 | 38.2 | +5.6 | |
| Liberal | Richard Christian Cecil James Binney | 8,847 | 20.6 | +5.3 | |
| Majority | 1,348 | 3.0 | -16.5 | ||
| Turnout | 72.2 | +0.4 | |||
| Unionist hold | Swing | -8.2 | |||
Elections in the 1930s
| Party | Candidate | Votes | % | ± | |
|---|---|---|---|---|---|
| Conservative | John Llewellin | 35,836 | 71.96 | ||
| Labour | Lawrence M. Worsnop | 11,609 | 23.31 | ||
| Workers | Reginald Bridgeman | 2,358 | 4.73 | ||
| Majority | 24,227 | 48.65 | |||
| Turnout | 68.36 | ||||
| Conservative hold | Swing | ||||
| Party | Candidate | Votes | % | ± | |
|---|---|---|---|---|---|
| Conservative | John Llewellin | 34,727 | 54.06 | ||
| Labour | Lawrence M. Worsnop | 24,000 | 37.36 | ||
| Liberal | William Ridgway | 5,514 | 8.58 | ||
| Majority | 10,727 | 16.70 | |||
| Turnout | 65.20 | ||||
| Conservative hold | Swing | ||||
Election in the 1940s
| Party | Candidate | Votes | % | ± | |
|---|---|---|---|---|---|
| Labour Co-op | Frank Beswick | 25,190 | 43.74 | ||
| Conservative | John Llewellin | 24,106 | 41.85 | ||
| Liberal | John Ernest Aylett | 8,300 | 14.41 | ||
| Majority | 1,084 | 1.88 | |||
| Turnout | 73.93 | ||||
| Labour Co-op gain from Conservative | Swing | ||||
Elections in the 1950s
| Party | Candidate | Votes | % | ± | |
|---|---|---|---|---|---|
| Labour Co-op | Frank Beswick | 20,139 | 48.16 | ||
| Conservative | C.B. Thorne | 17,741 | 42.43 | ||
| Liberal | John Ernest Aylett | 3,933 | 9.41 | ||
| Majority | 2,398 | 5.74 | |||
| Turnout | 84.56 | ||||
| Labour Co-op hold | Swing | ||||
| Party | Candidate | Votes | % | ± | |
|---|---|---|---|---|---|
| Labour Co-op | Frank Beswick | 21,249 | 49.14 | ||
| Conservative | Charles Curran | 19,701 | 45.56 | ||
| Liberal | Lucien Fior | 2,289 | 5.29 | ||
| Majority | 1,548 | 3.58 | |||
| Turnout | 84.75 | ||||
| Labour Co-op hold | Swing | ||||
| Party | Candidate | Votes | % | ± | |
|---|---|---|---|---|---|
| Labour Co-op | Frank Beswick | 22,244 | 51.00 | ||
| Conservative | Charles Curran | 21,368 | 49.00 | ||
| Majority | 876 | 2.01 | |||
| Turnout | 81.71 | ||||
| Labour Co-op hold | Swing | ||||
| Party | Candidate | Votes | % | ± | |
|---|---|---|---|---|---|
| Conservative | Charles Curran | 22,360 | 46.51 | ||
| Labour Co-op | Frank Beswick | 20,970 | 43.62 | ||
| Liberal | Gordon Robert Goodall | 4,746 | 9.87 | ||
| Majority | 1,390 | 2.89 | |||
| Turnout | 84.35 | ||||
| Conservative gain from Labour Co-op | Swing | ||||
Elections in the 1960s
| Party | Candidate | Votes | % | ± | |
|---|---|---|---|---|---|
| Conservative | Charles Curran | 20,519 | 43.63 | ||
| Labour | Thomas J. Parker | 19,866 | 42.24 | ||
| Liberal | Gordon Robert Goodall | 6,644 | 14.13 | ||
| Majority | 653 | 1.39 | |||
| Turnout | 80.77 | ||||
| Conservative hold | Swing | ||||
| Party | Candidate | Votes | % | ± | |
|---|---|---|---|---|---|
| Labour | John Ryan | 21,793 | 45.46 | ||
| Conservative | Charles Curran | 20,903 | 43.61 | ||
| Liberal | Gordon Robert Goodall | 5,241 | 10.93 | ||
| Majority | 890 | 1.86 | |||
| Turnout | 82.55 | ||||
| Labour gain from Conservative | Swing | ||||
Elections in the 1970s
| Party | Candidate | Votes | % | ± | |
|---|---|---|---|---|---|
| Conservative | Charles Curran | 23,414 | 49.35 | +5.74 | |
| Labour | John Ryan | 19,768 | 41.66 | -3.80 | |
| Liberal | Gordon Robert Goodall | 4,265 | 8.99 | -1.94 | |
| Majority | 3,646 | 7.68 | |||
| Turnout | 47,447 | 74.95 | |||
| Conservative gain from Labour | Swing | ||||
| Party | Candidate | Votes | % | ± | |
|---|---|---|---|---|---|
| Conservative | Michael Shersby | 14,178 | 42.31 | -7.04 | |
| Labour | Manuela Sykes | 13,000 | 38.79 | -2.87 | |
| Liberal | Ian Stuart | 3,650 | 10.89 | +1.90 | |
| National Front | John Clifton | 2,920 | 8.71 | N/A | |
| Union Movement | Dan Harmston | 873 | 2.60 | N/A | |
| National Independence | Clare Macdonald | 551 | 1.64 | N/A | |
| Democratic Conservative against the Common Market | Reginald Simmerson | 341 | 1.02 | N/A | |
| Majority | 1,178 | 3.52 | -4.16 | ||
| Turnout | 35,513 | ||||
| Conservative hold | Swing | ||||
| Party | Candidate | Votes | % | ± | |
|---|---|---|---|---|---|
| Conservative | Michael Shersby | 20,542 | 42.08 | ||
| Labour | Manuela Sykes | 18,127 | 37.13 | ||
| Liberal | J.S. Pincham | 10,150 | 20.79 | ||
| Majority | 2,415 | 4.95 | |||
| Turnout | 48,819 | 82.48 | |||
| Conservative hold | Swing | ||||
| Party | Candidate | Votes | % | ± | |
|---|---|---|---|---|---|
| Conservative | Michael Shersby | 19,969 | 44.51 | +2.43 | |
| Labour | G.E. Pringle | 17,816 | 39.71 | +2.58 | |
| Liberal | J.S. Pincham | 7,081 | 15.78 | -5.01 | |
| Majority | 2,153 | 4.80 | -0.15 | ||
| Turnout | 44,866 | 75.09 | -7.39 | ||
| Conservative hold | Swing | ||||
| Party | Candidate | Votes | % | ± | |
|---|---|---|---|---|---|
| Conservative | Michael Shersby | 24,967 | 52.49 | +7.98 | |
| Labour | G.E. Pringle | 16,972 | 35.68 | -4.03 | |
| Liberal | Jonathan Hunt | 5,031 | 10.58 | -5.20 | |
| National Front | P. Budgen | 595 | 1.25 | N/A | |
| Majority | 7,995 | 16.81 | +12.01 | ||
| Turnout | 47,565 | 78.86 | +3.77 | ||
| Conservative hold | Swing | ||||
Elections in the 1980s
| Party | Candidate | Votes | % | ± | |
|---|---|---|---|---|---|
| Conservative | Michael Shersby | 23,875 | 53.62 | +1.13 | |
| Social Democratic | P. Russell | 11,038 | 24.79 | +14.21 | |
| Labour | P.J. Magee | 9,611 | 21.59 | -14.09 | |
| Majority | 12,837 | 28.83 | +12.02 | ||
| Turnout | 44,524 | 72.26 | -6.60 | ||
| Conservative hold | Swing | ||||
| Party | Candidate | Votes | % | ± | |
|---|---|---|---|---|---|
| Conservative | Michael Shersby | 27,292 | 56.47 | +2.85 | |
| Labour | David Keys | 11,322 | 23.43 | +1.84 | |
| Social Democratic | Anthony Goodman | 9,164 | 18.96 | -5.83 | |
| Green | Ian Flindall | 549 | 1.14 | N/A | |
| Majority | 15,970 | 33.05 | +4.22 | ||
| Turnout | 48,327 | 76.52 | +4.26 | ||
| Conservative hold | Swing | ||||
Elections in the 1990s
| Party | Candidate | Votes | % | ± | |
|---|---|---|---|---|---|
| Conservative | Michael Shersby | 27,487 | 56.44 | -0.03 | |
| Labour | Robert Evans | 14,308 | 29.38 | +5.95 | |
| Liberal Democrat | SJ Carey | 5,900 | 12.11 | -6.85 | |
| Green | Ian Flindall | 538 | 1.10 | -0.04 | |
| BNP | Michael O'Rourke | 350 | 0.72 | N/A | |
| Natural Law | A Deans | 120 | 0.25 | N/A | |
| Majority | 13,179 | 27.06 | -5.99 | ||
| Turnout | 48,703 | 78.88 | +2.36 | ||
| Conservative hold | Swing | ||||
| Party | Candidate | Votes | % | ± | |
|---|---|---|---|---|---|
| Conservative | Michael Shersby | 18,095 | 43.5 | ||
| Labour | David Williams | 17,371 | 41.8 | ||
| Liberal Democrat | Andrew Malyan | 4,528 | 10.9 | ||
| Referendum | Garrick Aird | 1,153 | 2.8 | N/A | |
| Socialist Alternative | Julia Leonard | 398 | 1.0 | N/A | |
| Majority | 724 | 1.7 | |||
| Turnout | 72.3 | ||||
| Conservative hold | Swing | ||||
| Party | Candidate | Votes | % | ± | |
|---|---|---|---|---|---|
| Conservative | John Randall | 16,288 | 51.1 | +7.6 | |
| Labour | Andy Slaughter | 12,522 | 39.3 | −2.5 | |
| Liberal Democrat | Keith Kerr | 1,792 | 5.6 | −5.4 | |
| Monster Raving Loony | Screaming Lord Sutch | 396 | 1.3 | N/A | |
| Socialist Alternative | Julia Leonard | 259 | 0.8 | −0.1 | |
| BNP | Frances Taylor | 205 | 0.7 | N/A | |
| National Democrats | Ian Anderson | 157 | 0.5 | N/A | |
| National Front | John McAuley | 110 | 0.3 | N/A | |
| Independent Liberal | Henry Middleton | 69 | 0.2 | N/A | |
| UKIP | James Feisenberger | 39 | 0.1 | N/A | |
| Rainbow Dream Ticket | Ronnie Carroll | 30 | 0.1 | N/A | |
| Majority | 3,766 | 11.8 | |||
| Turnout | 55.2 | -16.9 | |||
| Conservative hold | Swing | ||||
Elections in the 2000s
| Party | Candidate | Votes | % | ± | |
|---|---|---|---|---|---|
| Conservative | John Randall | 15,751 | 47.1 | +3.6 | |
| Labour | David Salisbury-Jones | 13,653 | 40.9 | -0.9 | |
| Liberal Democrat | Catherine Royce | 3,426 | 10.3 | −0.6 | |
| UKIP | Paul Cannons | 588 | 1.8 | N/A | |
| Majority | 2,098 | 6.2 | |||
| Turnout | 33,418 | 57.5 | -14.8 | ||
| Conservative hold | Swing | ||||
| Party | Candidate | Votes | % | ± | |
|---|---|---|---|---|---|
| Conservative | John Randall | 16,840 | 49.0 | +1.9 | |
| Labour | Roderick Dubrow-Marshall | 10,669 | 31.0 | −9.9 | |
| Liberal Democrat | Tariq Mahmood | 4,544 | 13.2 | +2.9 | |
| BNP | Cliff le May | 763 | 2.2 | N/A | |
| Green | Stephen Young | 725 | 2.1 | N/A | |
| UKIP | Robert Kerby | 553 | 1.6 | −0.2 | |
| National Front | Peter Shaw | 284 | 0.8 | N/A | |
| Majority | 6,171 | 18.0 | |||
| Turnout | 34,378 | 59.4 | +1.9 | ||
| Conservative hold | Swing | +5.9 | |||
See also
References
- ↑ The seat span approximately 18.5 miles from the north of Harefield on the Hertfordshire border to the Surrey border at Hampton Court Park and 9 miles from the west of Staines to the east of Teddington. Its final form had a greatest ambit of approximately 5.0 miles from north Ickenham to south West Drayton and 3.0 miles east-to-west.
- ↑ Leigh Rayment's Historical List of MPs – Constituencies beginning with "U"
- 1 2 3 4 5 6 7 8 9 Craig, F. W. S., ed. (1974). British Parliamentary Election Results: 1885-1918. London: Macmillan Press. p. 350. ISBN 9781349022984.
- ↑ Debrett's House of Commons & Judicial Bench, 1886
- 1 2 3 4 5 British Parliamentary Election Results 1918-1949, FWS Craig
- ↑ Craig, F.W.S., ed. (1969). British parliamentary election results 1918-1949. Glasgow: Political Reference Publications. p. 429. ISBN 0-900178-01-9.
- ↑ "Election Data 1983". Electoral Calculus. Archived from the original on 15 October 2011. Retrieved 18 October 2015.
- ↑ "Election Data 1987". Electoral Calculus. Archived from the original on 15 October 2011. Retrieved 18 October 2015.
- ↑ "Election Data 1992". Electoral Calculus. Archived from the original on 15 October 2011. Retrieved 18 October 2015.
- ↑ "UK General Election results: April 1992 [Archive]". www.politicsresources.net. Retrieved 19 April 2018.
- ↑ "Election Data 1997". Electoral Calculus. Archived from the original on 15 October 2011. Retrieved 18 October 2015.
- ↑ "Election Data 2001". Electoral Calculus. Archived from the original on 15 October 2011. Retrieved 18 October 2015.
- ↑ "Election Data 2005". Electoral Calculus. Archived from the original on 15 October 2011. Retrieved 18 October 2015.