Spanish regional elections, 2011

|
|
|
Regional assemblies of Aragon, Asturias, the Balearic Islands, the Canary Islands, Cantabria, Castile and León, Castilla–La Mancha, Extremadura, La Rioja, Madrid, Murcia, Navarre and the Valencian Community |
|---|
| Registered |
19,319,332  2.1% 2.1% |
|---|
| Turnout |
13,025,799 (67.4%)
 1.0 pp 1.0 pp |
|---|
|
|
 |
The 2011 Spanish regional elections were held on Sunday, 22 May 2011, to elect the regional parliaments of thirteen of the seventeen autonomous communities—Aragon, Asturias, the Balearic Islands, the Canary Islands, Cantabria, Castile and León, Castilla–La Mancha, Extremadura, La Rioja, Madrid, Murcia, Navarre and the Valencian Community—, not including Andalusia, the Basque Country, Catalonia and Galicia, which had separate electoral cycles. 824 of 1,218 seats in the regional parliaments were up for election. The elections were held simultaneously with local elections all throughout Spain.
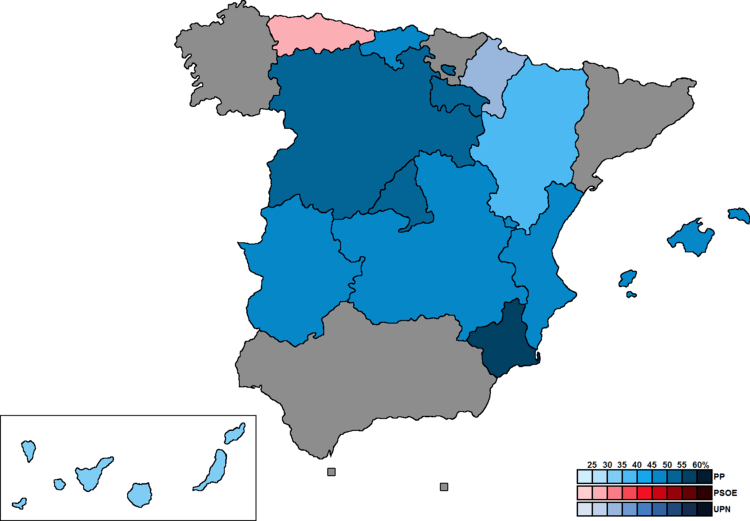
The week before the elections came dominated under the scope of the 15-M protests which had been held in different cities across Spain. The opposition People's Party (PP) won the elections in a landslide as the ruling Spanish Socialist Workers' Party (PSOE) lost all regional governments at stake—including Extremadura and Castilla–La Mancha, which it had held since 1983. The PP won outright majorities in eight out of the thirteen communities holding elections, and was able to gain power in a further two either through agreements with other parties.
Election date
Determination of election day varied depending on the autonomous community, with each one having competency to establish its own regulations. Typically, thirteen out of the seventeen autonomous communities—all but Andalusia, the Basque Country, Catalonia and Galicia—had their elections fixed for the fourth Sunday of May every four years, to be held together with nationwide local elections.[1][2]
In some cases, regional presidents had the prerogative to dissolve the regional parliament and call for extra elections at a different time, but newly elected assemblies were restricted to serving out what remained of their previous four year-terms without altering the period to their next ordinary election. In other cases—namely, Aragon, the Balearic Islands, Castile and León, Navarre and the Valencian Community—, the law granted presidents the power to call a snap election resulting in a fresh four year-parliamentary term.[3] By the time of the 2011 regional elections, however, this prerogative had not yet been exercised by any of these communities.
Regional governments
The following table lists party control in autonomous communities. Gains for a party are highlighted in that party's colour.
Overall results
← Summary of the 22 May 2011 regional election results in Spain →
| Parties and coalitions |
Votes |
% |
Seats |
|
People's Party (PP) |
5,895,836 | 46.04 | 410 |
|
Spanish Socialist Workers' Party (PSOE) |
3,682,916 | 28.76 | 261 |
|
United Left–The Greens (IU–LV) |
795,242 | 6.21 | 34 |
|
Union, Progress and Democracy (UPyD) |
415,890 | 3.25 | 8 |
|
Canarian Coalition–Nationalist Party–Canarian Centre (CC–PNC–CCN) |
225,948 | 1.76 | 21 |
|
Asturias Forum (FAC) |
178,031 | 1.39 | 16 |
|
Commitment Coalition (Compromís) |
176,213 | 1.38 | 6 |
|
Navarrese People's Union (UPN) |
111,474 | 0.87 | 19 |
|
Regionalist Party of Cantabria (PRC) |
98,887 | 0.77 | 12 |
|
New Canaries (NC) |
82,148 | 0.64 | 3 |
|
Aragonese Party (PAR) |
62,193 | 0.49 | 7 |
|
Aragonese Union (CHA) |
55,932 | 0.44 | 4 |
|
Navarre Yes 2011 (NaBai 2011) |
49,827 | 0.39 | 8 |
|
Unite–Basque Solidarity–Progress Alternative (B–EA/AE–EA) |
42,916 | 0.34 | 7 |
|
PSM–Initiative Greens–Agreement (PSM–IV–ExM) |
40,472 | 0.32 | 5 |
|
Leonese People's Union (UPL) |
26,660 | 0.21 | 1 |
|
Riojan Party (PR) |
8,983 | 0.07 | 2 |
|
Others |
539,722 | 4.21 | 0 |
| Blank ballots |
316,807 | 2.47 | |
|
| Valid votes |
12,806,097 | 98.31 | |
| Invalid votes |
219,702 | 1.69 |
| Votes cast / turnout |
13,025,799 | 67.42 |
| Registered voters |
19,319,332 | |
Summary by region
Galicia
Catalonia
Basque Country
Andalusia
Ceuta
Melilla
Aragon
| List |
Votes |
% |
|
Seats |
|
PP |
269,729 | 39.69 | | 30 |
|
PSOE |
197,189 | 29.02 | | 22 |
|
PAR |
62,193 | 9.15 | | 7 |
|
CHA |
55,932 | 8.23 | | 4 |
|
IU |
41,874 | 6.16 | | 4 |
|
Others |
30,934 | 4.55 | | 0 |
| Blank ballots |
21,678 | 3.19 | |
|
| Valid votes |
679,529 | 98.50 | |
| Invalid votes |
10,375 | 1.50 |
| Votes cast / turnout |
689,904 | 67.90 |
| Registered voters |
1,016,021 | |
Asturias
| List |
Votes |
% |
|
Seats |
|
PSOE |
179,619 | 29.92 | | 15 |
|
FAC |
178,031 | 29.66 | | 16 |
|
PP |
119,767 | 19.95 | | 10 |
|
IU–LV |
61,703 | 10.28 | | 4 |
|
Others |
45,543 | 7.59 | | 0 |
| Blank ballots |
15,611 | 2.60 | |
|
| Valid votes |
600,274 | 98.56 | |
| Invalid votes |
8,798 | 1.44 |
| Votes cast / turnout |
609,072 | 61.69 |
| Registered voters |
987,305 | |
Balearic Islands
| List |
Votes |
% |
|
Seats |
|
PP–Sa Unió |
196,214 | 46.68 | | 35 |
|
PSOE–GxF |
104,628 | 24.89 | | 19 |
|
PSM–IV–ExM |
40,472 | 9.63 | | 5 |
|
Others |
66,711 | 15.87 | | 0 |
| Blank ballots |
12,293 | 2.92 | |
|
| Valid votes |
420,318 | 98.41 | |
| Invalid votes |
6,775 | 1.59 |
| Votes cast / turnout |
427,093 | 58.80 |
| Registered voters |
726,287 | |
Canary Islands
| List |
Votes |
% |
|
Seats |
|
PP |
289,381 | 31.94 | | 21 |
|
CC–PNC–CCN |
225,948 | 24.94 | | 21 |
|
PSOE |
190,028 | 20.98 | | 15 |
|
NC |
82,148 | 9.07 | | 3 |
|
Others |
93,437 | 10.31 | | 0 |
| Blank ballots |
25,017 | 2.76 | |
|
| Valid votes |
905,959 | 97.31 | |
| Invalid votes |
25,051 | 2.69 |
| Votes cast / turnout |
931,010 | 58.91 |
| Registered voters |
1,580,359 | |
Cantabria
| List |
Votes |
% |
|
Seats |
|
PP |
156,499 | 46.09 | | 20 |
|
PRC |
98,887 | 29.12 | | 12 |
|
PSOE |
55,541 | 16.36 | | 7 |
|
Others |
21,297 | 6.27 | | 0 |
| Blank ballots |
7,328 | 2.16 | |
|
| Valid votes |
339,552 | 98.30 | |
| Invalid votes |
5,887 | 1.70 |
| Votes cast / turnout |
345,439 | 69.79 |
| Registered voters |
494,955 | |
Castile and León
| List |
Votes |
% |
|
Seats |
|
PP |
739,502 | 51.55 | | 53 |
|
PSOE |
425,777 | 29.68 | | 29 |
|
IUCyL |
69,872 | 4.87 | | 1 |
|
UPL |
26,660 | 1.86 | | 1 |
|
Others |
125,593 | 8.76 | | 0 |
| Blank ballots |
47,008 | 3.28 | |
|
| Valid votes |
1,434,412 | 98.09 | |
| Invalid votes |
27,985 | 1.91 |
| Votes cast / turnout |
1,462,397 | 67.50 |
| Registered voters |
2,166,385 | |
Castilla–La Mancha
| List |
Votes |
% |
|
Seats |
|
PP |
564,954 | 48.11 | | 25 |
|
PSOE |
509,738 | 43.40 | | 24 |
|
Others |
80,081 | 6.82 | | 0 |
| Blank ballots |
19,643 | 1.67 | |
|
| Valid votes |
1,174,416 | 98.69 | |
| Invalid votes |
15,570 | 1.31 |
| Votes cast / turnout |
1,189,986 | 75.96 |
| Registered voters |
1,566,641 | |
Extremadura
| List |
Votes |
% |
|
Seats |
|
PP–EU |
307,975 | 46.13 | | 32 |
|
PSOE–r |
290,045 | 43.45 | | 30 |
|
IU–SIEx |
38,157 | 5.72 | | 3 |
|
Others |
22,028 | 3.30 | | 0 |
| Blank ballots |
9,394 | 1.41 | |
|
| Valid votes |
667,599 | 98.65 | |
| Invalid votes |
9,169 | 1.35 |
| Votes cast / turnout |
676,768 | 74.65 |
| Registered voters |
906,551 | |
La Rioja
| List |
Votes |
% |
|
Seats |
|
PP |
85,975 | 51.98 | | 20 |
|
PSOE |
50,169 | 30.33 | | 11 |
|
PR |
8,983 | 5.43 | | 2 |
|
Others |
15,792 | 9.55 | | 0 |
| Blank ballots |
4,496 | 2.72 | |
|
| Valid votes |
165,415 | 97.98 | |
| Invalid votes |
3,411 | 2.02 |
| Votes cast / turnout |
168,826 | 69.76 |
| Registered voters |
242,007 | |
Madrid
| List |
Votes |
% |
|
Seats |
|
PP |
1,548,306 | 51.73 | | 72 |
|
PSOE |
786,297 | 26.27 | | 36 |
|
IUCM–LV |
287,707 | 9.61 | | 13 |
|
UPyD |
189,055 | 6.32 | | 8 |
|
Others |
110,413 | 3.69 | | 0 |
| Blank ballots |
71,458 | 2.39 | |
|
| Valid votes |
2,993,236 | 98.32 | |
| Invalid votes |
51,113 | 1.68 |
| Votes cast / turnout |
3,044,349 | 65.86 |
| Registered voters |
4,622,750 | |
Murcia
| List |
Votes |
% |
|
Seats |
|
PP |
382,871 | 58.79 | | 33 |
|
PSOE |
155,506 | 23.88 | | 11 |
|
IU–V–RM |
50,988 | 7.83 | | 1 |
|
Others |
47,846 | 7.35 | | 0 |
| Blank ballots |
14,050 | 2.16 | |
|
| Valid votes |
651,261 | 98.37 | |
| Invalid votes |
10,825 | 1.63 |
| Votes cast / turnout |
662,086 | 67.91 |
| Registered voters |
974,998 | |
Navarre
| List |
Votes |
% |
|
Seats |
|
UPN |
111,474 | 34.48 | | 19 |
|
PSN–PSOE |
51,238 | 15.85 | | 9 |
|
NaBai 2011 |
49,827 | 15.41 | | 8 |
|
B–EA/AE–EA |
42,916 | 13.28 | | 7 |
|
PP |
23,551 | 7.29 | | 4 |
|
I–E |
18,457 | 5.71 | | 3 |
|
Others |
17,630 | 5.45 | | 0 |
| Blank ballots |
8,161 | 2.52 | |
|
| Valid votes |
323,254 | 98.77 | |
| Invalid votes |
4,027 | 1.23 |
| Votes cast / turnout |
327,281 | 67.43 |
| Registered voters |
485,386 | |
| List |
Votes |
% |
|
Seats |
|
PP |
1,211,112 | 49.42 | | 55 |
|
PSPV–PSOE |
687,141 | 28.04 | | 33 |
|
Compromís |
176,213 | 7.19 | | 6 |
|
EUPV |
144,703 | 5.90 | | 5 |
|
Others |
171,033 | 6.98 | | 0 |
| Blank ballots |
60,670 | 2.48 | |
|
| Valid votes |
2,450,872 | 98.37 | |
| Invalid votes |
40,716 | 1.63 |
| Votes cast / turnout |
2,491,588 | 70.19 |
| Registered voters |
3,549,687 | |
External links
|
|---|
| General elections | |
|---|
| European elections | |
|---|
| Local elections | |
|---|
| Regional elections | |
|---|
| Referendums | |
|---|
- See also: Elections and referendums in Andalusia
- Aragon
- Asturias
- Balearic Islands
- Basque Country
- Canary Islands
- Cantabria
- Castile and León
- Castilla-La Mancha
- Catalonia
- Extremadura
- Galicia
- La Rioja
- Madrid
- Murcia
- Navarre
- Valencian Community
|