Spanish political reform
referendum, 1976 |
|---|
|
Do you approve of the Political Reform Bill? |
| Location |
Spain |
|---|
| Date |
15 December 1976 |
|---|
Results
|
Votes |
% |
 Y Yes Y Yes |
16,573,180 |
7001973600000000000♠97.36% |
 N No N No |
450,102 |
7000264000000000000♠2.64% |
| Valid votes |
17,023,282 |
7001967300000000000♠96.73% |
| Invalid or blank votes |
576,280 |
7000327000000000000♠3.27% |
| Total votes |
17,599,562 |
100.00% |
| Registered voters/turnout |
22,644,290 |
7001777200000000000♠77.72% |
|
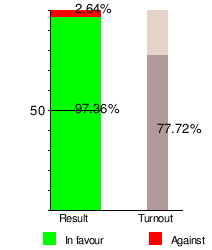
A Spanish political reform referendum was held on Wednesday, 15 December 1976, to gauge support for either the ratification or repealing of the Political Reform Act which had been approved by the Spanish Cortes on 18 November 1976. The question asked was "Do you approve of the Political Reform Bill?" (Spanish: "¿Aprueba el Proyecto de Ley para la Reforma Política?"). The referendum resulted in 97.4% of voters supporting the bill on a turnout of 77.7%.[1]
Opinion polls
| Polling firm/Commissioner |
Fieldwork date |
Sample size |
Yes |
No |
Other/
Abst. |
.svg.png) ? ? |
Lead |
|
|
|
|
| 1976 referendum |
15 Dec 1976 |
N/A |
94.5 |
2.6 |
3.0 |
— |
91.9 |
|
| IFOP[3] |
29 Nov–6 Dec 1976 |
1,439 |
80.0 |
4.0 |
16.0 |
— |
76.0 |
Results
Overall
| Choice |
Votes |
% |
| Yes |
16,573,180 |
97.36 |
| No |
450,102 |
2.64 |
Results by region
| Region |
Electorate |
Turnout |
Yes |
No |
|
|
| Votes |
% |
Votes |
% |
| Andalusia |
3,622,509 |
81.90 |
2,840,336 |
98.16 |
53,219 |
1.84 |
| Aragon |
798,926 |
85.32 |
642,779 |
97.80 |
14,464 |
2.20 |
| Asturias |
740,394 |
73.02 |
502,438 |
95.82 |
21,905 |
4.18 |
| Balearic Islands |
379,205 |
84.22 |
303,624 |
98.21 |
5,522 |
1.79 |
| Basque Country |
1,277,885 |
53.86 |
627,499 |
96.47 |
22,956 |
3.53 |
| Canary Islands |
740,781 |
75.51 |
537,626 |
98.34 |
9,099 |
1.66 |
| Cantabria |
282,506 |
78.22 |
198,337 |
93.05 |
14,812 |
6.95 |
| Castile and León |
1,687,294 |
82.52 |
1,305,391 |
97.26 |
36,744 |
2.74 |
| Castilla–La Mancha |
1,052,985 |
84.71 |
840,286 |
96.21 |
33,058 |
3.79 |
| Catalonia |
3,710,652 |
74.10 |
2,567,147 |
97.79 |
58,146 |
2.21 |
| Extremadura |
675,902 |
81.97 |
532,170 |
97.96 |
11,067 |
2.04 |
| Galicia |
1,837,841 |
69.84 |
1,225,329 |
98.04 |
24,547 |
1.96 |
| La Rioja |
140,606 |
87.15 |
133,862 |
98.30 |
2,312 |
1.70 |
| Madrid |
2,612,402 |
78.21 |
1,883,630 |
95.91 |
80,304 |
4.09 |
| Murcia |
540,602 |
82.41 |
427,251 |
97.70 |
10,046 |
2.30 |
| Navarre |
318,797 |
73.63 |
217,879 |
96.99 |
6,766 |
3.01 |
| Valencian Community |
2,149,069 |
85.72 |
1,745,436 |
97.58 |
43,286 |
2.42 |
|
| Total |
22,644,290 |
77.72 |
16,573,180 |
97.36 |
450,102 |
2.64 |
External links
|
|---|
| General elections | |
|---|
| European elections | |
|---|
| Local elections | |
|---|
| Regional elections | |
|---|
| Referendums | |
|---|
- See also: Elections and referendums in Andalusia
- Aragon
- Asturias
- Balearic Islands
- Basque Country
- Canary Islands
- Cantabria
- Castile and León
- Castilla-La Mancha
- Catalonia
- Extremadura
- Galicia
- La Rioja
- Madrid
- Murcia
- Navarre
- Valencian Community
|