Spanish regional elections, 1987
|
|
|
Regional assemblies of Aragon, Asturias, the Balearic Islands, the Canary Islands, Cantabria, Castile and León, Castilla–La Mancha, Extremadura, La Rioja, Madrid, Murcia, Navarre and the Valencian Community |
|---|
| Registered |
15,309,042  2.8% 2.8% |
|---|
| Turnout |
10,988,152 (71.8%)
2.1 pp |
|---|
|
|
 |
The 1987 Spanish regional elections were held on Wednesday, 10 June 1987, to elect the regional parliaments of thirteen of the seventeen autonomous communities—Aragon, Asturias, the Balearic Islands, the Canary Islands, Cantabria, Castile and León, Castilla–La Mancha, Extremadura, La Rioja, Madrid, Murcia, Navarre and the Valencian Community—, not including Andalusia, the Basque Country, Catalonia and Galicia, which had separate electoral cycles. 779 of 1,169 seats in the regional parliaments were up for election. The elections were held simultaneously with local elections all throughout Spain, as well as the 1987 European Parliament election.
The Spanish Socialist Workers' Party (PSOE) remained the largest party overall, as well as in most regional parliaments. However, it suffered from a drop in popular support which saw it losing many of the absolute majorities it had obtained four years previously. As a result, several centre-right coalitions and alliances were able to oust the Socialists from government in four out of the twelve regional administrations it had held previous to the election. The main national opposition party, the People's Alliance (AP), having suffered from an internal crisis and the breakup of the People's Coalition in 1986, also lost support compared to the previous election. Its former allies, the People's Democratic Party (PDP) and the Liberal Party (PL), stood separately in the regional elections but remained unable to capitalize on AP's losses.
Benefitting from the two main parties's fall was former Spanish Prime Minister Adolfo Suárez's Democratic and Social Centre (CDS), which became decisive for government formation in many regional assemblies. United Left (IU), a coalition made up by the Communist Party of Spain (PCE) and other minor left-wing groups, remained stagnant at the PCE's 1983 results.
Election date
Determination of election day varied depending on the autonomous community, with each one having competency to establish its own regulations. Typically, thirteen out of the seventeen autonomous communities—all but Andalusia, the Basque Country, Catalonia and Galicia—had their elections fixed to be held within sixty days from the day of expiry of the regional assemblies, together with nationwide local elections.[1][2][3]
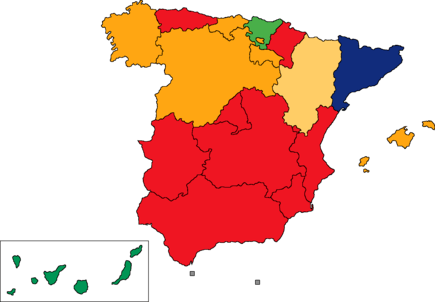
Regional governments
The following table lists party control in autonomous communities. Gains for a party are highlighted in that party's colour.
Seat projections
Individual poll results are listed in the table below in reverse chronological order, showing the most recent first, and using the date the survey's fieldwork was done, as opposed to the date of publication. If such date is unknown, the date of publication is given instead. The highest percentage figure in each polling survey is displayed with its background shaded in the leading party's colour. In the instance of a tie, the figures with the highest percentages are shaded. in the case of seat projections, they are displayed in bold and in a different font.
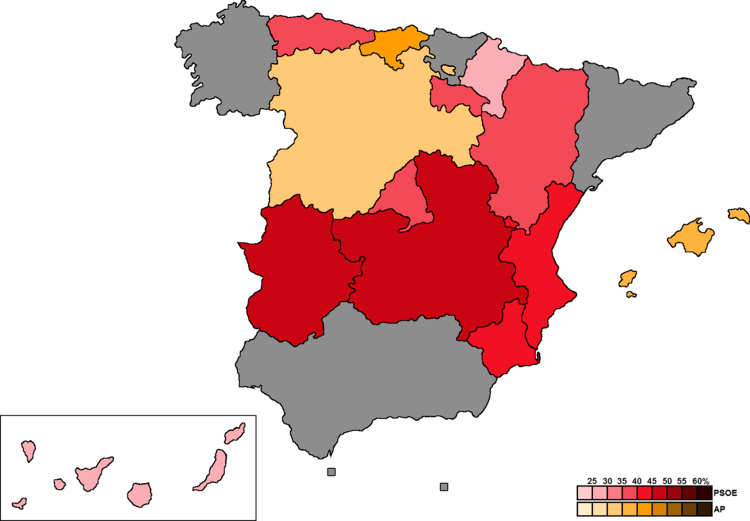
Overall results
← Summary of the 10 June 1987 regional election results in Spain →
| Parties and coalitions |
Votes |
% |
Seats |
|
Spanish Socialist Workers' Party (PSOE) |
4,167,924 | 38.41 | 329 |
|
People's Alliance (AP) |
2,981,868 | 27.48 | 231 |
|
Democratic and Social Centre (CDS) |
1,531,532 | 14.12 | 102 |
|
United Left (IU) |
682,772 | 6.29 | 24 |
|
Valencian Union (UV) |
183,541 | 1.69 | 6 |
|
Regionalist Aragonese Party (PAR) |
179,922 | 1.66 | 19 |
|
People's Democratic Party (PDP) |
144,731 | 1.33 | 4 |
|
Canarian Independent Groups (AIC) |
134,090 | 1.24 | 11 |
|
Navarrese People's Union (UPN) |
69,419 | 0.64 | 14 |
|
Canarian Assembly–Canarian Nationalist Left (AC–INC) |
46,105 | 0.42 | 2 |
|
Popular Unity (HB) |
38,138 | 0.35 | 7 |
|
Regionalist Party of Cantabria (PRC) |
37,950 | 0.35 | 5 |
|
United Extremadura (EU) |
34,606 | 0.32 | 4 |
|
Majorcan Union (UM) |
30,247 | 0.28 | 4 |
|
Basque Solidarity (EA) |
19,840 | 0.18 | 4 |
|
Independent Solution (SI) |
19,282 | 0.18 | 1 |
|
Socialist Party of Majorca–Nationalist Left (PSM–EN) |
16,383 | 0.15 | 2 |
|
Basque Country Left (EE) |
9,618 | 0.09 | 1 |
|
Progressive Riojan Party (PRP) |
9,212 | 0.08 | 2 |
|
Majorera Assembly (AM) |
5,423 | 0.05 | 3 |
|
Left of Menorca Agreement (PSM–EU) |
4,367 | 0.04 | 2 |
|
Independent Herrenian Group (AHI) |
1,415 | 0.01 | 2 |
|
Others |
360,011 | 3.32 | 0 |
| Blank ballots |
139,064 | 1.28 | |
|
| Valid votes |
10,850,121 | 98.74 | |
| Invalid votes |
138,031 | 1.26 |
| Votes cast / turnout |
10,988,152 | 71.78 |
| Registered voters |
15,309,042 | |
| Popular vote |
|---|
|
|
|
|
|
| PSOE |
|
38.41% |
| AP |
|
27.48% |
| CDS |
|
14.12% |
| IU |
|
6.29% |
| UV |
|
1.69% |
| PAR |
|
1.66% |
| PDP |
|
1.33% |
| AIC |
|
1.24% |
| UPN |
|
0.64% |
| Others |
|
5.85% |
| Blank ballots |
|
1.28% |
|
Summary by region
Galicia
Catalonia
Basque Country
Andalusia
Ceuta
Melilla
Aragon
| List |
Votes |
% |
|
Seats |
|
PSOE |
228,170 | 35.68 | | 27 |
|
PAR |
179,922 | 28.14 | | 19 |
|
AP |
99,082 | 15.49 | | 13 |
|
CDS |
65,406 | 10.23 | | 6 |
|
CAA–IU |
31,352 | 4.90 | | 2 |
|
Others |
26,350 | 4.12 | | 0 |
| Blank ballots |
9,186 | 1.44 | |
|
| Valid votes |
639,468 | 98.80 | |
| Invalid votes |
7,789 | 1.20 |
| Votes cast / turnout |
647,257 | 69.70 |
| Registered voters |
928,584 | |
Asturias
| List |
Votes |
% |
|
Seats |
|
PSOE |
222,326 | 38.85 | | 20 |
|
AP |
144,379 | 25.23 | | 13 |
|
CDS |
106,155 | 18.55 | | 8 |
|
IU |
69,175 | 12.09 | | 4 |
|
Others |
23,220 | 4.06 | | 0 |
| Blank ballots |
7,066 | 1.23 | |
|
| Valid votes |
572,321 | 98.60 | |
| Invalid votes |
8,115 | 1.40 |
| Votes cast / turnout |
580,436 | 66.82 |
| Registered voters |
868,611 | |
Balearics
| List |
Votes |
% |
|
Seats |
|
AP–PL |
123,130 | 36.71 | | 25 |
|
PSOE |
108,910 | 32.47 | | 21 |
|
CDS |
34,146 | 10.18 | | 5 |
|
UM |
30,247 | 9.02 | | 4 |
|
PSM–EN |
16,383 | 4.88 | | 2 |
|
PSM–EU |
11,795 | 3.52 | | 2 |
|
Others |
7,245 | 2.16 | | 0 |
| Blank ballots |
3,525 | 1.05 | |
|
| Valid votes |
335,381 | 98.77 | |
| Invalid votes |
4,163 | 1.23 |
| Votes cast / turnout |
339,544 | 66.94 |
| Registered voters |
507,258 | |
Canary Islands
| List |
Votes |
% |
|
Seats |
|
PSOE |
185,916 | 27.83 | | 21 |
|
AIC |
134,090 | 20.07 | | 11 |
|
CDS |
129,925 | 19.45 | | 13 |
|
AP |
74,799 | 11.20 | | 6 |
|
AC–INC |
46,105 | 6.90 | | 2 |
|
ICU |
40,748 | 6.10 | | 2 |
|
AM |
5,423 | 0.81 | | 3 |
|
AHI |
1,415 | 0.21 | | 2 |
|
Others |
45,221 | 6.77 | | 0 |
| Blank ballots |
4,316 | 0.65 | |
|
| Valid votes |
667,958 | 98.84 | |
| Invalid votes |
7,825 | 1.16 |
| Votes cast / turnout |
675,783 | 67.49 |
| Registered voters |
1,002,775 | |
Cantabria
| List |
Votes |
% |
|
Seats |
|
AP |
122,964 | 41.68 | | 19 |
|
PSOE |
87,230 | 29.57 | | 13 |
|
PRC |
37,950 | 12.86 | | 5 |
|
CDS |
19,370 | 6.57 | | 2 |
|
Others |
24,212 | 8.21 | | 0 |
| Blank ballots |
3,292 | 1.12 | |
|
| Valid votes |
295,018 | 98.63 | |
| Invalid votes |
4,097 | 1.37 |
| Votes cast / turnout |
299,115 | 75.72 |
| Registered voters |
395,043 | |
Castile and León
| List |
Votes |
% |
|
Seats |
|
AP |
493,488 | 34.36 | | 32 |
|
PSOE |
488,469 | 34.01 | | 32 |
|
CDS |
278,253 | 19.37 | | 18 |
|
PDP |
35,080 | 2.44 | | 1 |
|
SI |
19,282 | 1.34 | | 1 |
|
Others |
98,970 | 6.89 | | 0 |
| Blank ballots |
22,690 | 1.58 | |
|
| Valid votes |
1,436,232 | 98.28 | |
| Invalid votes |
25,154 | 1.72 |
| Votes cast / turnout |
1,461,386 | 73.15 |
| Registered voters |
1,997,693 | |
Castilla–La Mancha
| List |
Votes |
% |
|
Seats |
|
PSOE |
435,121 | 46.33 | | 25 |
|
AP |
319,978 | 34.07 | | 18 |
|
CDS |
98,539 | 10.49 | | 4 |
|
Others |
76,324 | 8.13 | | 0 |
| Blank ballots |
9,247 | 0.98 | |
|
| Valid votes |
939,209 | 98.84 | |
| Invalid votes |
11,053 | 1.16 |
| Votes cast / turnout |
950,262 | 75.43 |
| Registered voters |
1,259,742 | |
Extremadura
| List |
Votes |
% |
|
Seats |
|
PSOE |
292,935 | 49.18 | | 34 |
|
AP |
144,117 | 24.19 | | 17 |
|
CDS |
73,554 | 12.35 | | 8 |
|
EU |
34,606 | 5.81 | | 4 |
|
IU |
32,240 | 5.41 | | 2 |
|
Others |
13,425 | 2.25 | | 0 |
| Blank ballots |
4,785 | 0.80 | |
|
| Valid votes |
595,662 | 99.01 | |
| Invalid votes |
5,935 | 0.99 |
| Votes cast / turnout |
601,597 | 74.39 |
| Registered voters |
808,654 | |
La Rioja
| List |
Votes |
% |
|
Seats |
|
PSOE |
57,178 | 39.64 | | 14 |
|
AP |
50,179 | 34.78 | | 13 |
|
CDS |
15,640 | 10.84 | | 4 |
|
PRP |
9,212 | 6.39 | | 2 |
|
Others |
9,599 | 6.65 | | 0 |
| Blank ballots |
2,452 | 1.70 | |
|
| Valid votes |
144,260 | 98.63 | |
| Invalid votes |
1,998 | 1.37 |
| Votes cast / turnout |
146,258 | 72.50 |
| Registered voters |
201,738 | |
Madrid
| List |
Votes |
% |
|
Seats |
|
PSOE |
932,878 | 38.45 | | 40 |
|
AP |
762,102 | 31.41 | | 32 |
|
CDS |
403,440 | 16.63 | | 17 |
|
IU |
181,512 | 7.48 | | 7 |
|
Others |
104,344 | 4.30 | | 0 |
| Blank ballots |
42,196 | 1.74 | |
|
| Valid votes |
2,426,472 | 98.78 | |
| Invalid votes |
29,995 | 1.22 |
| Votes cast / turnout |
2,456,467 | 69.87 |
| Registered voters |
3,515,847 | |
Murcia
| List |
Votes |
% |
|
Seats |
|
PSOE |
221,377 | 43.71 | | 25 |
|
AP |
159,566 | 31.50 | | 16 |
|
CDS |
60,419 | 11.93 | | 3 |
|
IU |
37,757 | 7.45 | | 1 |
|
Others |
22,535 | 4.45 | | 0 |
| Blank ballots |
4,862 | 0.96 | |
|
| Valid votes |
506,516 | 98.84 | |
| Invalid votes |
5,928 | 1.16 |
| Votes cast / turnout |
512,444 | 72.99 |
| Registered voters |
702,068 | |
Navarre
| List |
Votes |
% |
|
Seats |
|
PSN–PSOE |
78,453 | 27.68 | | 15 |
|
UPN |
69,419 | 24.50 | | 14 |
|
HB |
38,138 | 13.46 | | 7 |
|
CDS |
21,022 | 7.42 | | 4 |
|
EA |
19,840 | 7.00 | | 4 |
|
PDF–PDP, PL (UDF) |
17,663 | 6.23 | | 3 |
|
AP |
11,985 | 4.23 | | 2 |
|
EE |
9,618 | 3.39 | | 1 |
|
Others |
13,307 | 4.70 | | 0 |
| Blank ballots |
3,950 | 1.39 | |
|
| Valid votes |
283,395 | 98.84 | |
| Invalid votes |
3,327 | 1.16 |
| Votes cast / turnout |
286,722 | 72.90 |
| Registered voters |
393,326 | |
| List |
Votes |
% |
|
Seats |
|
PSOE |
828,961 | 41.28 | | 42 |
|
AP |
476,099 | 23.71 | | 25 |
|
CDS |
225,663 | 11.24 | | 10 |
|
UV |
183,541 | 9.14 | | 6 |
|
IU–UPV |
159,579 | 7.95 | | 6 |
|
Others |
112,889 | 5.62 | | 0 |
| Blank ballots |
21,497 | 1.07 | |
|
| Valid votes |
2,008,229 | 98.88 | |
| Invalid votes |
22,652 | 1.12 |
| Votes cast / turnout |
2,030,881 | 74.45 |
| Registered voters |
2,727,703 | |
External links
|
|---|
| General elections | |
|---|
| European elections | |
|---|
| Local elections | |
|---|
| Regional elections | |
|---|
| Referendums | |
|---|
- See also: Elections and referendums in Andalusia
- Aragon
- Asturias
- Balearic Islands
- Basque Country
- Canary Islands
- Cantabria
- Castile and León
- Castilla-La Mancha
- Catalonia
- Extremadura
- Galicia
- La Rioja
- Madrid
- Murcia
- Navarre
- Valencian Community
|