Spanish regional elections, 1995

|
|
|
Regional assemblies of Aragon, Asturias, the Balearic Islands, the Canary Islands, Cantabria, Castile and León, Castilla–La Mancha, Extremadura, La Rioja, Madrid, Murcia, Navarre and the Valencian Community |
|---|
| Registered |
17,290,796  5.8% 5.8% |
|---|
| Turnout |
12,537,414 (72.5%)
7.4 pp |
|---|
|
|
 |
The 1995 Spanish regional elections were held on Sunday, 28 May 1995, to elect the regional parliaments of thirteen of the seventeen autonomous communities—Aragon, Asturias, the Balearic Islands, the Canary Islands, Cantabria, Castile and León, Castilla–La Mancha, Extremadura, La Rioja, Madrid, Murcia, Navarre and the Valencian Community—, not including Andalusia, the Basque Country, Catalonia and Galicia, which had separate electoral cycles. 786 of 1,180 seats in the regional parliaments were up for election. The elections were held simultaneously with local elections all throughout Spain.
Election date
Determination of election day varied depending on the autonomous community, with each one having competency to establish its own regulations. Typically, thirteen out of the seventeen autonomous communities—all but Andalusia, the Basque Country, Catalonia and Galicia—had their elections fixed for the fourth Sunday of May every four years, to be held together with nationwide local elections.[1][2][3]
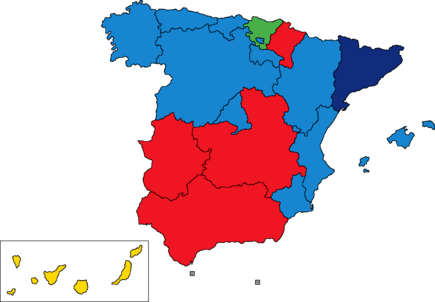
Regional governments
The following table lists party control in autonomous communities. Gains for a party are highlighted in that party's colour.
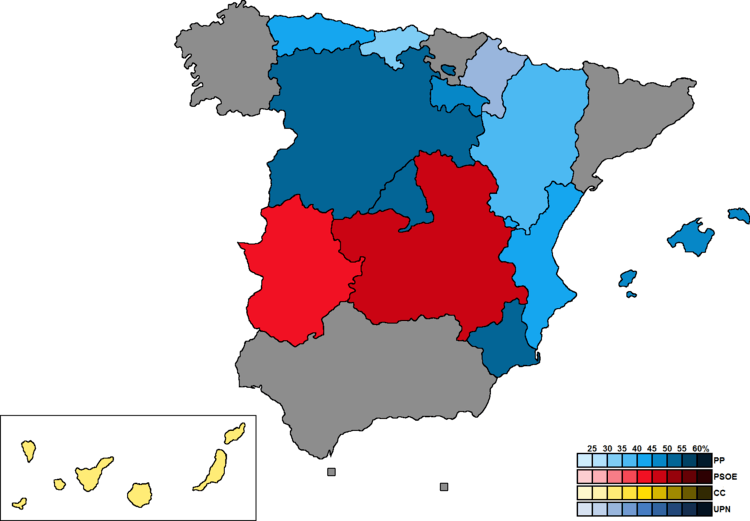
Overall results
← Summary of the 28 May 1995 regional election results in Spain →
| Parties and coalitions |
Votes |
% |
Seats |
|
People's Party and allies (PP–UPN) |
5,586,626 | 44.83 | 365 |
|
People's Party (PP) |
5,493,463 | 44.09 | 348 |
|
Navarrese People's Union (UPN) |
93,163 | 0.75 | 17 |
|
Spanish Socialist Workers' Party (PSOE) |
3,969,858 | 31.86 | 262 |
|
United Left (IU) |
1,413,421 | 11.34 | 67 |
|
Canarian Coalition (CC) |
261,672 | 2.10 | 21 |
|
Valencian Union (UV) |
165,956 | 1.33 | 5 |
|
Aragonese Party (PAR) |
143,573 | 1.15 | 14 |
|
Convergence of Democrats of Navarre (CDN) |
55,153 | 0.44 | 10 |
|
Union for the Progress of Cantabria (UPCA) |
53,191 | 0.43 | 7 |
|
Regionalist Party of Cantabria (PRC) |
46,587 | 0.37 | 6 |
|
Nationalists of the Balearic Islands (PSM–ENE) |
45,854 | 0.37 | 6 |
|
Leonese People's Union (UPL) |
39,425 | 0.32 | 2 |
|
Aragonese Union (CHA) |
34,077 | 0.27 | 2 |
|
Popular Unity (HB) |
27,404 | 0.22 | 5 |
|
Extremaduran Coalition (CEx) |
25,168 | 0.20 | 1 |
|
Nationalist Canarian Platform (PCN) |
23,914 | 0.19 | 4 |
|
Asturianist Party (PAS) |
20,669 | 0.17 | 1 |
|
Majorcan Union (UM) |
19,966 | 0.16 | 2 |
|
Basque Solidarity (EA) |
13,568 | 0.11 | 2 |
|
The Greens of the Balearic Islands (EVIB) |
11,663 | 0.09 | 1 |
|
Riojan Party (PR) |
11,069 | 0.09 | 2 |
|
Independent Herrenian Group (AHI) |
2,105 | 0.02 | 1 |
|
Others |
326,274 | 2.62 | 0 |
| Blank ballots |
163,609 | 1.31 | |
|
| Valid votes |
12,460,802 | 99.39 | |
| Invalid votes |
76,612 | 0.61 |
| Votes cast / turnout |
12,537,414 | 72.51 |
| Registered voters |
17,290,796 | |
| Popular vote |
|---|
|
|
|
|
|
| PP–UPN |
|
44.83% |
| PSOE |
|
31.86% |
| IU |
|
11.34% |
| CC |
|
2.10% |
| UV |
|
1.33% |
| PAR |
|
1.15% |
| Others |
|
6.07% |
| Blank ballots |
|
1.31% |
|
Summary by region
Galicia
Catalonia
Basque Country
Andalusia
Ceuta
Melilla
Aragon
| List |
Votes |
% |
|
Seats |
|
PP |
263,524 | 37.50 | | 27 |
|
PSOE |
180,728 | 25.72 | | 19 |
|
PAR |
143,573 | 20.43 | | 14 |
|
IU |
64,685 | 9.20 | | 5 |
|
CHA |
34,077 | 4.85 | | 2 |
|
Others |
5,059 | 0.72 | | 0 |
| Blank ballots |
11,098 | 1.58 | |
|
| Valid votes |
702,744 | 99.40 | |
| Invalid votes |
4,210 | 0.60 |
| Votes cast / turnout |
706,954 | 71.12 |
| Registered voters |
993,975 | |
Asturias
| List |
Votes |
% |
|
Seats |
|
PP |
272,495 | 42.00 | | 21 |
|
PSOE |
219,527 | 33.83 | | 17 |
|
IU |
106,538 | 16.42 | | 6 |
|
PAS |
20,669 | 3.19 | | 1 |
|
Others |
21,936 | 3.38 | | 0 |
| Blank ballots |
7,655 | 1.18 | |
|
| Valid votes |
648,820 | 99.41 | |
| Invalid votes |
3,820 | 0.59 |
| Votes cast / turnout |
652,640 | 69.05 |
| Registered voters |
945,105 | |
Balearics
| List |
Votes |
% |
|
Seats |
|
PP–AIPF |
169,351 | 45.09 | | 31 |
|
PSIB–PSOE |
90,008 | 23.97 | | 16 |
|
PSM–ENE |
45,854 | 12.21 | | 6 |
|
IU |
24,820 | 6.61 | | 3 |
|
UM |
19,966 | 5.32 | | 2 |
|
EVIB |
11,663 | 3.11 | | 1 |
|
Others |
8,810 | 2.35 | | 0 |
| Blank ballots |
5,100 | 1.36 | |
|
| Valid votes |
375,572 | 99.37 | |
| Invalid votes |
2,371 | 0.63 |
| Votes cast / turnout |
377,943 | 63.56 |
| Registered voters |
594,666 | |
Canary Islands
| List |
Votes |
% |
|
Seats |
|
CC |
261,672 | 32.83 | | 21 |
|
PP |
247,609 | 31.07 | | 18 |
|
PSOE |
183,969 | 23.08 | | 16 |
|
PCN |
23,914 | 3.00 | | 4 |
|
AHI |
2,105 | 0.26 | | 1 |
|
Others |
68,712 | 8.62 | | 0 |
| Blank ballots |
9,078 | 1.14 | |
|
| Valid votes |
797,059 | 99.43 | |
| Invalid votes |
4,548 | 0.57 |
| Votes cast / turnout |
801,607 | 64.20 |
| Registered voters |
1,248,575 | |
Cantabria
| List |
Votes |
% |
|
Seats |
|
PP |
104,008 | 32.50 | | 13 |
|
PSOE |
80,464 | 25.14 | | 10 |
|
UPCA |
53,191 | 16.62 | | 7 |
|
PRC |
46,587 | 14.56 | | 6 |
|
IU |
23,563 | 7.36 | | 3 |
|
Others |
6,033 | 1.89 | | 0 |
| Blank ballots |
6,186 | 1.93 | |
|
| Valid votes |
320,032 | 99.19 | |
| Invalid votes |
2,622 | 0.81 |
| Votes cast / turnout |
322,654 | 74.05 |
| Registered voters |
435,752 | |
Castile and León
| List |
Votes |
% |
|
Seats |
|
PP |
805,553 | 52.20 | | 50 |
|
PSOE |
458,447 | 29.71 | | 27 |
|
IU |
147,777 | 9.58 | | 5 |
|
UPL |
39,425 | 2.55 | | 2 |
|
Others |
63,578 | 4.12 | | 0 |
| Blank ballots |
28,284 | 1.83 | |
|
| Valid votes |
1,543,068 | 99.11 | |
| Invalid votes |
13,911 | 0.89 |
| Votes cast / turnout |
1,556,979 | 73.46 |
| Registered voters |
2,119,498 | |
Castilla–La Mancha
| List |
Votes |
% |
|
Seats |
|
PSOE |
483,888 | 45.70 | | 24 |
|
PP |
469,127 | 44.30 | | 22 |
|
IU–ICAM |
80,482 | 7.60 | | 1 |
|
Others |
14,249 | 1.35 | | 0 |
| Blank ballots |
11,128 | 1.05 | |
|
| Valid votes |
1,058,874 | 99.28 | |
| Invalid votes |
7,697 | 0.72 |
| Votes cast / turnout |
1,066,571 | 78.83 |
| Registered voters |
1,352,958 | |
Extremadura
| List |
Votes |
% |
|
Seats |
|
PSOE |
289,149 | 43.94 | | 31 |
|
PP |
259,703 | 39.46 | | 27 |
|
IU–LV–CE |
69,387 | 10.54 | | 6 |
|
CEx |
25,168 | 3.82 | | 1 |
|
Others |
8,858 | 1.35 | | 0 |
| Blank ballots |
5,804 | 0.88 | |
|
| Valid votes |
658,069 | 99.34 | |
| Invalid votes |
4,375 | 0.66 |
| Votes cast / turnout |
662,444 | 78.33 |
| Registered voters |
845,728 | |
La Rioja
| List |
Votes |
% |
|
Seats |
|
PP |
81,703 | 49.44 | | 17 |
|
PSOE |
56,335 | 34.09 | | 12 |
|
IU |
11,921 | 7.21 | | 2 |
|
PR |
11,069 | 6.70 | | 2 |
|
Others |
1,368 | 0.83 | | 0 |
| Blank ballots |
2,856 | 1.73 | |
|
| Valid votes |
165,252 | 99.30 | |
| Invalid votes |
1,170 | 0.70 |
| Votes cast / turnout |
166,422 | 76.16 |
| Registered voters |
218,519 | |
Madrid
| List |
Votes |
% |
|
Seats |
|
PP |
1,476,442 | 50.98 | | 54 |
|
PSOE |
860,726 | 29.72 | | 32 |
|
IU |
464,167 | 16.03 | | 17 |
|
Others |
56,079 | 1.94 | | 0 |
| Blank ballots |
38,763 | 1.34 | |
|
| Valid votes |
2,896,177 | 99.62 | |
| Invalid votes |
10,964 | 0.38 |
| Votes cast / turnout |
2,907,141 | 70.39 |
| Registered voters |
4,129,852 | |
Murcia
| List |
Votes |
% |
|
Seats |
|
PP |
330,089 | 52.35 | | 26 |
|
PSOE |
200,133 | 31.74 | | 15 |
|
IU–LV–RM |
78,664 | 12.48 | | 4 |
|
Others |
14,638 | 2.32 | | 0 |
| Blank ballots |
7,032 | 1.12 | |
|
| Valid votes |
630,556 | 99.16 | |
| Invalid votes |
5,344 | 0.84 |
| Votes cast / turnout |
635,900 | 75.96 |
| Registered voters |
837,180 | |
Navarre
| List |
Votes |
% |
|
Seats |
|
UPN |
93,163 | 31.35 | | 17 |
|
PSN–PSOE |
62,021 | 20.87 | | 11 |
|
CDN |
55,153 | 18.56 | | 10 |
|
IU/EB |
27,773 | 9.35 | | 5 |
|
HB |
27,404 | 9.22 | | 5 |
|
EA |
13,568 | 4.57 | | 2 |
|
Others |
12,336 | 4.15 | | 0 |
| Blank ballots |
5,761 | 1.94 | |
|
| Valid votes |
297,179 | 99.21 | |
| Invalid votes |
2,366 | 0.79 |
| Votes cast / turnout |
299,545 | 68.42 |
| Registered voters |
437,797 | |
| List |
Votes |
% |
|
Seats |
|
PP |
1,013,859 | 42.83 | | 42 |
|
PSOE |
804,463 | 33.98 | | 32 |
|
EU–EV |
273,030 | 11.53 | | 10 |
|
UV–FICVA–CCV |
165,956 | 7.01 | | 5 |
|
Others |
85,228 | 3.60 | | 0 |
| Blank ballots |
24,864 | 1.05 | |
|
| Valid votes |
2,367,400 | 99.44 | |
| Invalid votes |
13,214 | 0.56 |
| Votes cast / turnout |
2,380,614 | 76.03 |
| Registered voters |
3,131,191 | |
External links
|
|---|
| General elections | |
|---|
| European elections | |
|---|
| Local elections | |
|---|
| Regional elections | |
|---|
| Referendums | |
|---|
- See also: Elections and referendums in Andalusia
- Aragon
- Asturias
- Balearic Islands
- Basque Country
- Canary Islands
- Cantabria
- Castile and León
- Castilla-La Mancha
- Catalonia
- Extremadura
- Galicia
- La Rioja
- Madrid
- Murcia
- Navarre
- Valencian Community
|