Spanish regional elections, 2003

|
|
|
Regional assemblies of Aragon, Asturias, the Balearic Islands, the Canary Islands, Cantabria, Castile and León, Castilla–La Mancha, Extremadura, La Rioja, Madrid, Murcia, Navarre and the Valencian Community |
|---|
| Registered |
18,614,131  2.5% 2.5% |
|---|
| Turnout |
12,795,118 (68.7%)
2.9 pp |
|---|
|
|
 |
The 2003 Spanish regional elections were held on Sunday, 25 May 2003, to elect the regional parliaments of thirteen of the seventeen autonomous communities—Aragon, Asturias, the Balearic Islands, the Canary Islands, Cantabria, Castile and León, Castilla–La Mancha, Extremadura, La Rioja, Madrid, Murcia, Navarre and the Valencian Community—, not including Andalusia, the Basque Country, Catalonia and Galicia, which had separate electoral cycles. 792 of 1,186 seats in the regional parliaments were up for election. The elections were held simultaneously with local elections all throughout Spain.
Election date
Determination of election day varied depending on the autonomous community, with each one having competency to establish its own regulations. Typically, thirteen out of the seventeen autonomous communities—all but Andalusia, the Basque Country, Catalonia and Galicia—had their elections fixed for the fourth Sunday of May every four years, to be held together with nationwide local elections.[1][2]
In some cases, regional presidents had the prerogative to dissolve the regional parliament and call for extra elections at a different time, but newly elected assemblies were restricted to serving out what remained of their previous four year-terms without altering the period to their next ordinary election.[3]
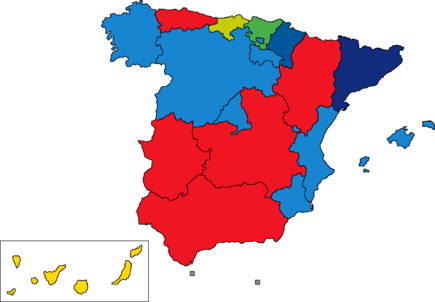
Regional governments
The following table lists party control in autonomous communities. Gains for a party are highlighted in that party's colour.
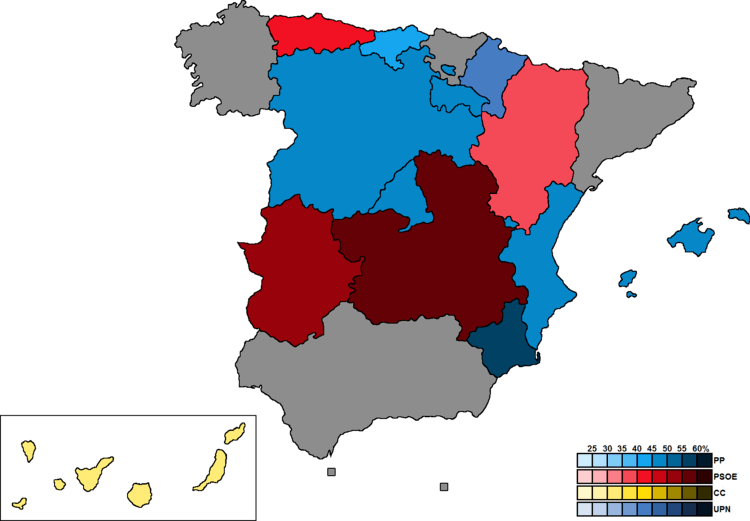
Overall results
← Summary of the 25 May 2003 regional election results in Spain →
| Parties and coalitions |
Votes |
% |
Seats |
|
People's Party and allies (PP–UPN) |
5,575,081 | 43.92 | 371 |
|
People's Party (PP) |
5,447,621 | 42.91 | 348 |
|
Navarrese People's Union (UPN) |
127,460 | 1.00 | 23 |
|
Spanish Socialist Workers' Party (PSOE) |
4,843,930 | 38.16 | 317 |
|
United Left (IU) |
723,748 | 5.70 | 30 |
|
Canarian Coalition (CC) |
304,413 | 2.40 | 23 |
|
Aragonese Union (CHA) |
97,763 | 0.77 | 9 |
|
Aragonese Party (PAR) |
79,670 | 0.63 | 8 |
|
Regionalist Party of Cantabria (PRC) |
66,480 | 0.52 | 8 |
|
Leonese People's Union (UPL) |
60,331 | 0.48 | 2 |
|
Canarian Nationalist Federation (FNC) |
44,703 | 0.35 | 3 |
|
PSM–Nationalist Agreement (PSM–EN) |
33,920 | 0.27 | 4 |
|
Majorcan Union (UM) |
31,781 | 0.25 | 3 |
|
Aralar (Aralar) |
24,068 | 0.19 | 4 |
|
Convergence of Democrats of Navarre (CDN) |
23,516 | 0.19 | 4 |
|
Basque Solidarity–Basque Nationalist Party (EA–PNV) |
22,824 | 0.18 | 4 |
|
Riojan Party (PR) |
11,842 | 0.09 | 2 |
|
Others |
528,467 | 4.16 | 0 |
| Blank ballots |
221,523 | 1.75 | |
|
| Valid votes |
12,694,060 | 99.21 | |
| Invalid votes |
101,058 | 0.79 |
| Votes cast / turnout |
12,795,118 | 68.74 |
| Registered voters |
18,614,131 | |
| Popular vote |
|---|
|
|
|
|
|
| PP–UPN |
|
43.92% |
| PSOE |
|
38.16% |
| IU |
|
5.70% |
| CC |
|
2.40% |
| CHA |
|
0.77% |
| PAR |
|
0.63% |
| PRC |
|
0.52% |
| Others |
|
6.16% |
| Blank ballots |
|
1.86% |
|
Summary by region
Galicia
Catalonia
Basque Country
Andalusia
Ceuta
Melilla
Aragon
| List |
Votes |
% |
|
Seats |
|
PSOE |
270,468 | 37.94 | | 27 |
|
PP |
219,058 | 30.73 | | 22 |
|
CHA |
97,763 | 13.71 | | 9 |
|
PAR |
79,670 | 11.18 | | 8 |
|
IU |
21,795 | 3.06 | | 1 |
|
Others |
9,216 | 1.29 | | 0 |
| Blank ballots |
14,874 | 2.09 | |
|
| Valid votes |
712,844 | 99.36 | |
| Invalid votes |
4,613 | 0.64 |
| Votes cast / turnout |
717,457 | 70.36 |
| Registered voters |
1,019,644 | |
Asturias
| List |
Votes |
% |
|
Seats |
|
PSOE |
250,474 | 40.48 | | 22 |
|
PP |
242,396 | 39.18 | | 19 |
|
IU–BA |
68,360 | 11.05 | | 4 |
|
Others |
43,343 | 7.01 | | 0 |
| Blank ballots |
14,143 | 2.29 | |
|
| Valid votes |
618,716 | 99.29 | |
| Invalid votes |
4,433 | 0.71 |
| Votes cast / turnout |
623,149 | 63.84 |
| Registered voters |
976,104 | |
Balearic Islands
| List |
Votes |
% |
|
Seats |
|
PP–AIPF |
192,209 | 45.08 | | 30 |
|
PSOE–Pacte–COP |
121,425 | 28.48 | | 20 |
|
PSM–EN |
33,920 | 7.95 | | 4 |
|
UM |
31,781 | 7.45 | | 3 |
|
EU–EV |
20,797 | 4.88 | | 2 |
|
Others |
19,115 | 4.48 | | 0 |
| Blank ballots |
7,093 | 1.66 | |
|
| Valid votes |
426,340 | 99.35 | |
| Invalid votes |
2,795 | 0.65 |
| Votes cast / turnout |
429,135 | 62.84 |
| Registered voters |
682,857 | |
Canary Islands
| List |
Votes |
% |
|
Seats |
|
CC |
304,413 | 32.90 | | 23 |
|
PP |
283,186 | 30.61 | | 17 |
|
PSOE |
235,234 | 25.42 | | 17 |
|
FNC |
44,703 | 4.83 | | 3 |
|
Others |
27,566 | 2.98 | | 0 |
| Blank ballots |
11,806 | 1.28 | |
|
| Valid votes |
925,248 | 99.44 | |
| Invalid votes |
5,201 | 0.56 |
| Votes cast / turnout |
930,449 | 64.62 |
| Registered voters |
1,439,784 | |
Cantabria
| List |
Votes |
% |
|
Seats |
|
PP |
146,796 | 42.49 | | 18 |
|
PSOE |
103,608 | 29.99 | | 13 |
|
PRC |
66,480 | 19.24 | | 8 |
|
Others |
21,432 | 6.20 | | 0 |
| Blank ballots |
7,202 | 2.08 | |
|
| Valid votes |
345,518 | 99.18 | |
| Invalid votes |
2,859 | 0.82 |
| Votes cast / turnout |
348,377 | 73.05 |
| Registered voters |
476,924 | |
Castile and León
| List |
Votes |
% |
|
Seats |
|
PP |
760,510 | 48.49 | | 48 |
|
PSOE |
576,769 | 36.77 | | 32 |
|
UPL |
60,331 | 3.85 | | 2 |
|
Others |
134,789 | 8.59 | | 0 |
| Blank ballots |
36,027 | 2.30 | |
|
| Valid votes |
1,568,426 | 99.14 | |
| Invalid votes |
13,557 | 0.86 |
| Votes cast / turnout |
1,581,983 | 72.66 |
| Registered voters |
2,177,222 | |
Castilla–La Mancha
| List |
Votes |
% |
|
Seats |
|
PSOE |
634,132 | 57.83 | | 29 |
|
PP |
402,047 | 36.66 | | 18 |
|
Others |
45,851 | 4.18 | | 0 |
| Blank ballots |
14,554 | 1.33 | |
|
| Valid votes |
1,096,584 | 99.32 | |
| Invalid votes |
7,534 | 0.68 |
| Votes cast / turnout |
1,104,118 | 76.24 |
| Registered voters |
1,448,289 | |
Extremadura
| List |
Votes |
% |
|
Seats |
|
PSOE–p |
341,522 | 51.66 | | 36 |
|
PP |
255,808 | 38.70 | | 26 |
|
IU–SIEx |
41,448 | 6.27 | | 3 |
|
Others |
13,253 | 2.00 | | 0 |
| Blank ballots |
9,033 | 1.37 | |
|
| Valid votes |
661,064 | 99.19 | |
| Invalid votes |
5,404 | 0.81 |
| Votes cast / turnout |
666,468 | 75.63 |
| Registered voters |
881,228 | |
La Rioja
| List |
Votes |
% |
|
Seats |
|
PP |
84,533 | 48.60 | | 17 |
|
PSOE |
66,410 | 38.18 | | 14 |
|
PR |
11,842 | 6.81 | | 2 |
|
Others |
7,856 | 4.52 | | 0 |
| Blank ballots |
3,308 | 1.90 | |
|
| Valid votes |
173,949 | 99.17 | |
| Invalid votes |
1,452 | 0.83 |
| Votes cast / turnout |
175,401 | 75.10 |
| Registered voters |
233,553 | |
Madrid
| List |
Votes |
% |
|
Seats |
|
PP |
1,346,588 | 48.48 | | 57 |
|
PSOE |
1,083,205 | 39.00 | | 45 |
|
IUCM |
236,013 | 8.50 | | 9 |
|
Others |
63,383 | 2.28 | | 0 |
| Blank ballots |
48,433 | 1.74 | |
|
| Valid votes |
2,777,622 | 99.61 | |
| Invalid votes |
10,873 | 0.39 |
| Votes cast / turnout |
2,788,495 | 62.58 |
| Registered voters |
4,455,706 | |
Murcia
| List |
Votes |
% |
|
Seats |
|
PP |
367,710 | 56.66 | | 28 |
|
PSOE |
221,392 | 34.11 | | 16 |
|
IURM |
36,754 | 5.66 | | 1 |
|
Others |
13,232 | 2.04 | | 0 |
| Blank ballots |
9,941 | 1.53 | |
|
| Valid votes |
649,029 | 99.20 | |
| Invalid votes |
5,224 | 0.80 |
| Votes cast / turnout |
654,253 | 69.98 |
| Registered voters |
934,896 | |
Navarre
| List |
Votes |
% |
|
Seats |
|
UPN |
127,460 | 41.48 | | 23 |
|
PSN–PSOE |
65,003 | 21.15 | | 11 |
|
IUN/NEB |
26,962 | 8.77 | | 4 |
|
Aralar |
24,068 | 7.83 | | 4 |
|
CDN |
23,516 | 7.65 | | 4 |
|
EA–PNV |
22,824 | 7.43 | | 4 |
|
Others |
10,180 | 3.31 | | 0 |
| Blank ballots |
7,304 | 2.38 | |
|
| Valid votes |
307,317 | 93.52 | |
| Invalid votes |
21,292 | 6.48 |
| Votes cast / turnout |
328,609 | 70.70 |
| Registered voters |
464,807 | |
| List |
Votes |
% |
|
Seats |
|
PP |
1,146,780 | 47.17 | | 48 |
|
PSPV–PSOE |
874,288 | 35.96 | | 35 |
|
Entesa |
154,494 | 6.35 | | 6 |
|
Others |
218,036 | 8.97 | | 0 |
| Blank ballots |
37,805 | 1.55 | |
|
| Valid votes |
2,431,403 | 99.35 | |
| Invalid votes |
15,821 | 0.65 |
| Votes cast / turnout |
2,447,224 | 71.49 |
| Registered voters |
3,423,098 | |
External links
|
|---|
| General elections | |
|---|
| European elections | |
|---|
| Local elections | |
|---|
| Regional elections | |
|---|
| Referendums | |
|---|
- See also: Elections and referendums in Andalusia
- Aragon
- Asturias
- Balearic Islands
- Basque Country
- Canary Islands
- Cantabria
- Castile and León
- Castilla-La Mancha
- Catalonia
- Extremadura
- Galicia
- La Rioja
- Madrid
- Murcia
- Navarre
- Valencian Community
|