European Parliament constituency
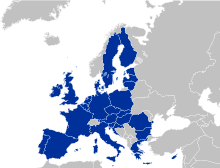
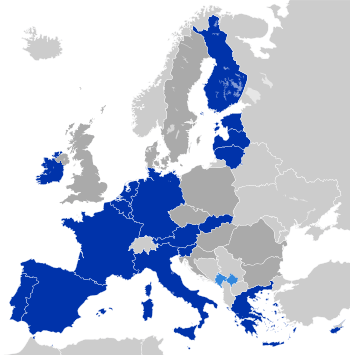
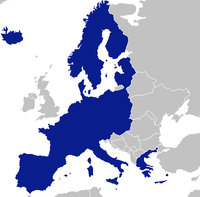
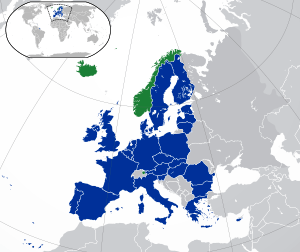
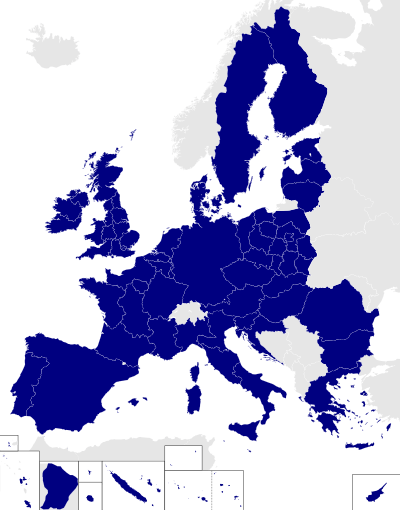
Members of the European Parliament (MEPs) are elected by the population of the member states of the European Union (EU), divided into constituencies.
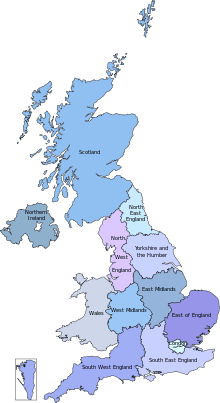
Belgium, France, Ireland, Italy, Poland and the United Kingdom are respectively divided into 3, 8, 3, 5, 13 and 12 constituencies, while the other member states have a single national constituency. In Germany, political parties are entitled to present lists of candidates either at Länder or national level.
The Kingdom of Denmark was also historically subdivided in two constituencies, with a separate one for Greenland which was dissolved in 1985 after the autonomous country in the Realm withdrew from the EEC (later expanded to become the EU).
Currently, all constituencies various forms of proportional representation (PR), except the single-seat German-speaking electoral college in Belgium, which uses first-past-the-post. The parliament as a whole is not PR, because seats are apportioned between member states by degressive proportionality; also, Poland and Belgium's constituencies are apportioned with wide population variance.
Data are for the 2014–2019 legislature.
Full list
| Constituency | Member State | Area/Community | Seats, 2014 | Population, 2012[1] (thousands) | Area[2] (km2) | GDP, 2011[3] (million €) | |||
|---|---|---|---|---|---|---|---|---|---|
| Total | Per seat | Total | Per seat | Total | Per seat | ||||
| Austria | Austria | (Full country) | 18 | 8,430 | 468 | 83,879 | 4,660 | 299,127 | 16,618 |
| Dutch-speaking electoral college | Belgium | Flemish Community | 12 | 6,389 | 532 | 13,521 | 1,127 | 212,354 | 17,696 |
| French-speaking electoral college | French Community of Belgium | 8 | 4,663 | 583 | 16,152 | 2,019 | 156,661 | 19,583 | |
| German-speaking electoral college | German-speaking Community of Belgium | 1 | 77 | 77 | 854 | 854 | na | na | |
| Bulgaria | Bulgaria | (Full country) | 17 | 7,306 | 430 | 110,900 | 6,524 | 38,505 | 2,265 |
| Cyprus | Cyprus | (Full country) | 6 | 864 | 144 | 9,251 | 1,542 | 17,979 | 2,997 |
| Croatia | Croatia | (Full country) | 11 | 4,269 | 388 | 56,594 | 5,145 | 44,384 | 4,035 |
| Czech Republic | Czech Republic | (Full country) | 21 | 10,511 | 501 | 78,866 | 3,756 | 155,486 | 7,404 |
| Denmark | Kingdom of Denmark | (Full country) | 13 | 5,592 | 430 | 42,916 | 3,301 | 230,978 | 17,768 |
| Estonia | Estonia | (Full country) | 6 | 1,323 | 220 | 45,227 | 7,538 | 16,216 | 2,703 |
| Finland | Finland | (Full country) | 13 | 5,414 | 416 | 338,435 | 26,033 | 188,656 | 14,512 |
| North-West | France | Regions Normandy (former regions Lower Normandy, and Upper Normandy), and Hauts-de-France (former regions Nord-Pas-de-Calais, and Picardy) | 10 | 9,298 | 930 | 61,720 | 6,172 | 229,998 | 23,000 |
| West | Regions Brittany, Pays-de-la-Loire, and former region Poitou-Charentes (now part of region Nouvelle-Aquitaine) | 9 | 8,683 | 965 | 85,099 | 9,455 | 222,722 | 24,747 | |
| East | Regions Grand Est (former regions Alsace, Champagne-Ardenne, and Lorraine), and Bourgogne-Franche-Comté (former regions Burgundy, and Franche-Comté) | 9 | 8,365 | 929 | 105,218 | 11,691 | 213,317 | 23,702 | |
| South-West | Region Occitanie (former regions Languedoc-Roussillon, and Midi-Pyrénées), and former region Aquitaine (now part of region Nouvelle-Aquitaine) | 10 | 8,941 | 894 | 114,032 | 11,403 | 228,573 | 22,857 | |
| South-East | Region Provence-Alpes-Côte d'Azur, territorial collectivity of Corsica, and former region Rhône-Alpes (now part of region Auvergne-Rhône-Alpes) | 13 | 11,619 | 894 | 83,778 | 6,444 | 345,312 | 26,562 | |
| Massif central–Centre | Region Centre-Val de Loire, and former regions Auvergne (now part of region Auvergne-Rhône-Alpes), and Limousin (now part of region Nouvelle-Aquitaine) | 5 | 4,665 | 933 | 82,106 | 16,421 | 115,987 | 23,197 | |
| Île-de-France | Region Île-de-France, and French citizens living abroad (and not registered as electors in another member country of the European Union) | 15 | 11,948 | 797 | 12,012 | 801 | 608,648 | 40,577 | |
| Overseas | French overseas departments and territories | 3 | 2,714 | 905 | 112,447 | 37,482 | 50,962 | 16,987 | |
| Germany | Germany | (Full country) | 96 | 81,932 | 853 | 357,162 | 3,720 | 2,609,898 | 27,186 |
| Greece | Greece | (Full country) | 21 | 11,093 | 528 | 131,957 | 6,284 | 208,530 | 9,930 |
| Hungary | Hungary | (Full country) | 21 | 9,920 | 472 | 93,024 | 4,430 | 98,921 | 4,711 |
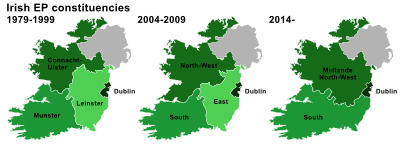
| Dublin | Ireland | Counties Dún Laoghaire–Rathdown, Fingal and South Dublin; and the city of Dublin | 3 | 1,271 | 424 | 921 | 307 | 65,925 | 21,975 |
| Midlands–North-West | Counties Cavan, Donegal, Galway, Kildare, Laois, Leitrim, Longford, Louth, Mayo, Meath, Monaghan, Offaly, Roscommon, Sligo and Westmeath; and the city of Galway | 4 | 1,635 | 409 | 37,282 | 9,321 | 40,416 | 10,104 | |
| South | Counties Cork, Kerry, Limerick, Tipperary and Waterford; and the cities of Cork, Limerick and Waterford | 4 | 1,675 | 419 | 31,935 | 7,984 | 50,147 | 12,537 | |
| North-West | Italy | Aosta Valley, Liguria, Lombardy, Piedmont | 20 | 15,807 | 790 | 57,928 | 2,896 | 511,484 | 25,574 |
| North-East | Emilia-Romagna, Friuli-Venezia Giulia, Trentino-Alto Adige/Südtirol, Veneto | 14 | 11,482 | 820 | 62,327 | 4,452 | 364,561 | 26,040 | |
| Central | Latium, Marche, Tuscany, Umbria | 14 | 11,637 | 831 | 58,084 | 4,149 | 340,669 | 24,334 | |
| Southern | Abruzzo, Apulia, Basilicata, Calabria, Campania, Molise | 17 | 13,975 | 822 | 73,800 | 4,341 | 243,895 | 14,347 | |
| Islands | Sardinia, Sicily | 8 | 6,639 | 830 | 49,932 | 6,242 | 117,031 | 14,629 | |
| Latvia | Latvia | (Full country) | 8 | 2,034 | 254 | 64,573 | 8,072 | 20,182 | 2,523 |
| Lithuania | Lithuania | (Full country) | 11 | 2,988 | 272 | 65,300 | 5,936 | 30,958 | 2,814 |
| Luxembourg | Luxembourg | (Full country) | 6 | 531 | 88 | 2,586 | 431 | 41,730 | 6,955 |
| Malta | Malta | (Full country) | 6 | 420 | 70 | 316 | 53 | 6,631 | 1,105 |
| Netherlands | Netherlands | (Full country) | 26 | 16,755 | 644 | 41,540 | 1,598 | 593,258 | 22,818 |
| Pomeranian | Poland | Pomeranian Voivodeship | 3 | 2,287 | 762 | 18,310 | 6,103 | 20,921 | 6,974 |
| Kuyavian-Pomeranian | Kuyavian-Pomeranian Voivodeship | 3 | 2,097 | 699 | 17,972 | 5,991 | 16,597 | 5,532 | |
| Podlaskie and Warmian-Masurian | Podlaskie Voivodeship and Warmian-Masurian Voivodeship | 2 | 2,651 | 1,326 | 44,360 | 22,180 | 18,407 | 9,204 | |
| Warsaw | City of Warsaw and part of the Masovian Voivodeship (powiats: Grodzisk Mazowiecki, Legionowo, Nowy Dwór Mazowiecki, Otwock, Piaseczno, Pruszków, Warsaw West and Wołomin) | 5 | 2,795 | 559 | 11,205 | 2,241 | 65,215 | 13,043 | |
| Masovian | The remaining part of the Masovian Voivodeship (powiats: Ciechanów, Gostyń, Mława, Płock, Płońsk, Przasnysz, Sierpc, Sochaczew, Żuromin, Żyrardów, Białobrzegi, Grójec, Kozienice, Lipsko, Przysucha, Radom, Szydłowiec, Zwoleń, Garwolin, Łosice, Maków, Mińsk, Ostrołęka, Ostrów Mazowiecka, Pułtusk, Siedlce, Sokołów, Węgrów, Wyszków and the cities of Płock, Radom, Ostrołęka and Siedlce) | 3 | 2,499 | 833 | 24,353 | 8,118 | 17,715 | 5,905 | |
| Łódź | Łódź Voivodeship | 2 | 2,529 | 1,265 | 18,219 | 9,110 | 22,631 | 11,316 | |
| Greater Poland | Greater Poland Voivodeship | 5 | 3,350 | 670 | 15,183 | 3,037 | 27,653 | 5,531 | |
| Lublin | Lublin Voivodeship | 2 | 2,169 | 1,084 | 25,122 | 12,561 | 14,208 | 7,104 | |
| Subcarpathian | Subcarpathian Voivodeship | 3 | 2,129 | 710 | 17,846 | 5,949 | 13,840 | 4,613 | |
| Lesser Poland and Świętokrzyskie | Lesser Poland Voivodeship and Świętokrzyskie Voivodeship | 7 | 4,735 | 676 | 41,537 | 5,934 | 43,750 | 6,250 | |
| Silesian | Silesian Voivodeship | 7 | 4,621 | 660 | 12,333 | 1,762 | 48,124 | 6,875 | |
| Lower Silesian and Opole | Lower Silesian Voivodeship and Opole Voivodeship | 6 | 3,928 | 655 | 29,359 | 4,893 | 39,645 | 6,608 | |
| Lubusz and West Pomeranian | Lubusz Voivodeship and West Pomeranian Voivodeship | 3 | 2,745 | 915 | 36,880 | 12,293 | 22,145 | 7,382 | |
| Portugal | Portugal | (Full country) | 21 | 10,515 | 501 | 92,212 | 4,391 | 170,942 | 8,140 |
| Romania | Romania | (Full country) | 32 | 21,385 | 668 | 238,391 | 7,450 | 131,359 | 4,105 |
| Slovakia | Slovakia | (Full country) | 13 | 5,408 | 416 | 49,036 | 3,772 | 68,975 | 5,306 |
| Slovenia | Slovenia | (Full country) | 8 | 2,057 | 257 | 20,273 | 2,534 | 36,150 | 4,519 |
| Sweden | Sweden | (Full country) | 20 | 9,519 | 476 | 438,576 | 21,929 | 385,342 | 19,267 |
| Spain | Spain | (Full country) | 54 | 46,773 | 866 | 505,991 | 9,370 | 1,045,263 | 19,357 |
| London | United Kingdom | Greater London | 8 | 7,836 | 980 | 1,595 | 199 | 394,759 | 49,345 |
| South East England | South East | 10 | 8,520 | 852 | 19,405 | 1,941 | 255,188 | 25,519 | |
| South West England | South West, Gibraltar | 6 | 5,303 | 884 | 24,395 | 4,066 | 131,444 | 21,907 | |
| West Midlands | West Midlands | 7 | 5,456 | 779 | 13,004 | 1,858 | 126,337 | 18,048 | |
| North West England | North West | 8 | 6,983 | 873 | 14,920 | 1,865 | 166,395 | 20,799 | |
| North East England | North East | 3 | 2,606 | 869 | 8,676 | 2,892 | 53,604 | 17,868 | |
| Yorkshire and the Humber | Yorkshire and the Humber | 6 | 5,301 | 884 | 15,564 | 2,594 | 120,310 | 20,052 | |
| East Midlands | East Midlands | 5 | 4,481 | 896 | 15,811 | 3,162 | 103,712 | 20,742 | |
| East of England | Eastern | 7 | 5,832 | 833 | 19,572 | 2,796 | 148,692 | 21,242 | |
| Northern Ireland | Northern Ireland | 3 | 1,799 | 600 | 14,130 | 4,710 | 37,813 | 12,604 | |
| Scotland | Scotland | 6 | 5,223 | 871 | 80,239 | 13,373 | 137,863 | 22,977 | |
| Wales | Wales | 4 | 3,007 | 752 | 21,225 | 5,306 | 60,428 | 15,107 | |
| Total | 751 | 507,403 | 676 | 4,487,367 | 5,975 | 12,665,528 | 16,865 | ||
- ^ In 2019 France constituencies will be replaced by a single nation-wide constituency.[4]
- ^ Due to the UK's withdrawal, British constituencies will be abolished from 2019 onwards
Regional constituencies by member state
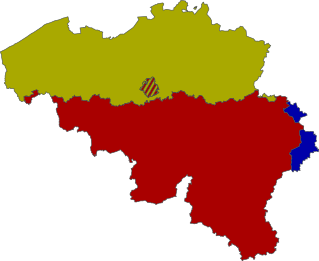 European Parliament constituencies in Belgium
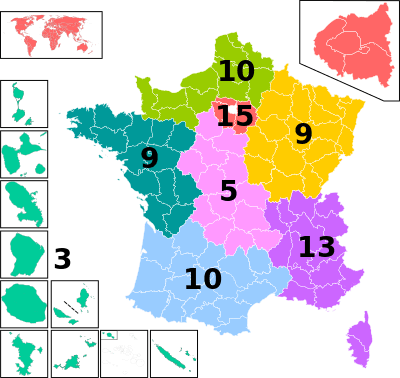
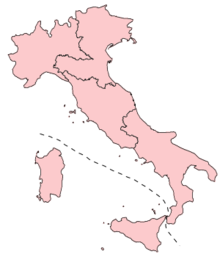 European Parliament constituencies in Italy
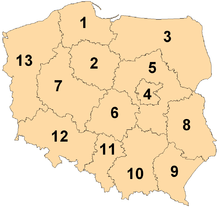
Full lists
See also
Notes
References
- ↑ Eurostat (14 March 2014). "Average annual population (1000) by NUTS 2 region". Retrieved 26 May 2014.
- ↑ Eurostat (19 May 2014). "Total area and land area by NUTS 2 region". Retrieved 26 May 2014.
- ↑ Eurostat (19 May 2014). "Regional Gross Domestic Product by NUTS 2 region". Retrieved 26 May 2014.
- ↑
External links
| Wikimedia Commons has media related to European Parliament constituency. |
- Fact Sheets on the European Union
- European Parliament election, 2004 (Belgium) - electoral law
- European Parliament election, 2004 (Finland) - electoral law
- European Parliament election, 2004 (France) - electoral law
- European Parliament election, 2004 (Ireland) - electoral law
- European Parliament election, 2004 (Poland) - electoral law
- European Parliament election, 2004 (United Kingdom) - electoral law
- European Election Law Association (Eurela)