Cyprus (European Parliament constituency)
| Cyprus | |
|---|---|
| European Parliament constituency | |
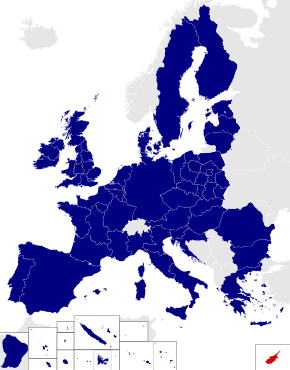 Location among the 2014 constituencies | |
| Member state | Cyprus |
| Created | 2004 |
| MEPs | 6 (2004) |
| Sources | |
In European elections, Cyprus is a constituency of the European Parliament, currently represented by six MEPs. It covers the member state of Cyprus.
2004
The 2004 European election was the sixth election to the European Parliament. However, as Cyprus had only joined the European Union earlier that month, it was the first election European election held in that state. The election took place on June 13.
The number of registered voters was 483,311 – out of which 503 were Turkish Cypriots and 2054 EU nationals – while the total number of people who voted was 350.387 or 72,50% of the registered voters. The number of polling stations was 1077, allocated to each polling district in the following manner: Nicosia 416, Limassol 323, Famagusta (free area) 50, Larnaca 169 and Paphos 119.
The six seats were contested by 59 candidates, belonging to parties or party coalitions or running as individuals. The conservative Democratic Rally and the left-wing Progressive Party of Working People (AKEL) achieved the largest shares of the vote.
| 2004 • 2009 → | |||||||||
| Party | European party | Votes | % | +/– | Seats | +/– | |||
|---|---|---|---|---|---|---|---|---|---|
| Democratic Rally (DISY) | EPP | 94,355 | 28.23 | — | 2 / 6 |
— | |||
| Progressive Party of Working People (AKEL) | PEL | 93,212 | 27.89 | — | 2 / 6 |
— | |||
| Democratic Party (DIKO) | None | 57,121 | 17.09 | — | 1 / 6 |
— | |||
| For Europe (GTE) | EDP | 36,112 | 10.80 | — | 1 / 6 |
— | |||
| Movement for Social Democracy (EDEK) | PES | 36,075 | 10.79 | — | 0 / 6 |
— | |||
| United Democrats (EDI) – KPE – European Cyprus | ELDR | 6,534 | 1.95 | — | 0 / 6 |
— | |||
| New Horizons (NO) | 5,501 | 1.65 | — | 0 / 6 |
— | ||||
| Others (parties or candidates that won less than 1% of the vote and no seats) | 5,358 | 1.60 | — | 0 / 6 |
— | ||||
| Valid votes | 334,268 | 95.40 | |||||||
| Blank and invalid votes | 16,119 | 4.60 | |||||||
| Totals | 350,387 | 100.00 | — | 6 / 6 |
— | ||||
| Electorate (eligible voters) and voter turnout | 483,311 | 72.50 | — | ||||||
| Source: results.elections.moi.gov.cy | |||||||||
| Name | National Party | EP group |
|---|---|---|
| Adamos Adamou | AKEL | GUE–NGL |
| Panayiotis Demetriou | Dimokratikos Synagermos | EPP–ED |
| Ioannis Kasoulides | Dimokratikos Synagermos | EPP–ED |
| Marios Matsakis | Dimokratiko Komma | ALDE |
| Yiannakis Matsis | Gia tin Evropi | EPP–ED |
| Kyriacos Triantaphyllides | AKEL | GUE–NGL |
2009
| ← 2004 • 2009 • 2014 → | |||||||||
| Party | European party | Votes | % | +/– | Seats | +/– | |||
|---|---|---|---|---|---|---|---|---|---|
| Democratic Rally (DISY) | EPP | 109,209 | 35.65 | 7.42 |
2 / 6 |
0 | |||
| Progressive Party of Working People (AKEL) | PEL | 106,922 | 34.90 | 7.01 |
2 / 6 |
0 | |||
| Democratic Party (DIKO) | None | 37,625 | 12.28 | 4.81 |
1 / 6 |
0 | |||
| Movement for Social Democracy (EDEK) | PES | 30,169 | 9.85 | 0.94 |
1 / 6 |
1 | |||
| European Party (EVROKO) | EDP | 12,630 | 4.12 | 6.7 |
0 / 6 |
1 | |||
| Ecological and Environmental Movement (KOP) | EGP | 4,602 | 1.50 | 0.64 |
0 / 6 |
0 | |||
| Others (parties or candidates that won less than 1% of the vote and no seats) | 5,168 | 1.69 | — | 0 / 6 |
0 | ||||
| Valid votes | 306,325 | 98.03 | |||||||
| Blank and invalid votes | 6,154 | 1.97 | |||||||
| Totals | 312,479 | 100.00 | — | 6 / 6 |
0 | ||||
| Electorate (eligible voters) and voter turnout | 526,060 | 59.40 | 13.10 |
||||||
| Source: results.elections.moi.gov.cy | |||||||||
2014
| ← 2009 • 2014 • 2019 → | |||||||||
| Party | European party | Votes | % | +/– | Seats | +/– | |||
|---|---|---|---|---|---|---|---|---|---|
| Democratic Rally (DISY) – EVROKO | EPP | 97,732 | 37.75 | 1.76 |
2 / 6 |
0 | |||
| Progressive Party of Working People (AKEL – Left – New Forces) | PEL | 69,852 | 26.98 | 8.37 |
2 / 6 |
0 | |||
| Democratic Party (DIKO) | None | 28,044 | 10.83 | 1.48 |
1 / 6 |
0 | |||
| Movement for Social Democracy (EDEK) – Green Party | PES/EGP | 19,894 | 7.68 | 3.76 |
1 / 6 |
0 | |||
| Citizens' Alliance | 17,549 | 6.78 | 0 / 6 |
0 | |||||
| Message of Hope | 9,907 | 3.83 | 0 / 6 |
0 | |||||
| National Popular Front (ELAM) | 6,957 | 2.69 | 2.48 |
0 / 6 |
0 | ||||
| Levent Sener (independent) | 2,718 | 1.05 | 0 / 6 |
0 | |||||
| Others (parties or candidates that won less than 1% of the vote and no seats) | 6,261 | 2.42 | — | 0 / 6 |
0 | ||||
| Valid votes | 258,914 | 97.01 | |||||||
| Blank and invalid votes | 7,977 | 2.99 | |||||||
| Totals | 266,891 | 100.00 | — | 6 / 6 |
0 | ||||
| Electorate (eligible voters) and voter turnout | 606,916 | 43.97 | 15.43 |
||||||
| Source: results.elections.moi.gov.cy. All percentage swings are as reported therein. | |||||||||
References
External links
- European Election News by European Election Law Association (Eurela)
- List of MEPs europarl.europa.eu