West France (European Parliament constituency)
| West France | |
|---|---|
| European Parliament constituency | |
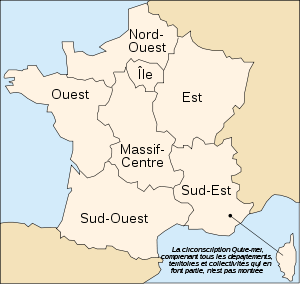
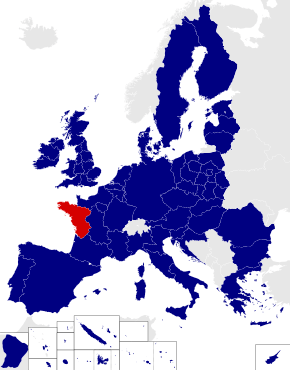 Location among the 2014 constituencies | |
 Shown within France | |
| Member state | France |
| Created | 2004 |
| MEPs | 10 |
| Sources | |
West France is a constituency of the European Parliament. It currently elects 10 MEPs. It includes the French regions of Brittany, Pays de la Loire, and the former region Poitou-Charentes (now part of region Nouvelle-Aquitaine).
Results
2009
| European Election 2009: West | |||||
|---|---|---|---|---|---|
| List | Candidates | Votes | % | ± | |
| UMP | Christophe Béchu Élisabeth Morin Alain Cadec |
680,829 | 27.16 | ||
| PS | Bernadette Vergnaud Stéphane Le Foll |
433,309 | 17.29 | ||
| EE | Yannick Jadot Nicole Kiil-Nielsen |
417,449 | 16.65 | ||
| Libertas | Philippe de Villiers | 257,437 | 10.27 | ||
| MoDem | Sylvie Goulard | 212,524 | 8.48 | ||
| NPA | None | 128,641 | 5.13 | ||
| FG | None | 114,755 | 4.58 | ||
| AEI | None | 93,391 | 3.73 | ||
| FN | None | 76,645 | 3.06 | ||
| PB | None | 32,805 | 1.31 | ||
| LO | None | 31,284 | 1.25 | ||
| DLR | None | 14,748 | 0.59 | ||
| Liberal Alternative | None | 4,371 | 0.18 | ||
| Europe Démocratie Espéranto | None | 4,215 | 0.17 | ||
| Europe décroissance | None | 1,374 | 0.06 | ||
| AR | None | 967 | 0.04 | ||
| Rassemblement pour l'Initiative Citoyenne | None | 581 | 0.02 | ||
| Union des gens | None | 494 | 0.02 | ||
| Newropeans | None | 357 | 0.02 | ||
| Communists | None | 518 | 0.02 | ||
| Turnout | 2,616,994 | 42.36 | |||
2004
Brackets indicate the number of votes per seat won.
| European Election 2004: West | |||||
|---|---|---|---|---|---|
| List | Candidates | Votes | % | ± | |
| PS | Stéphane Le Foll Bernard Poignant Marie-Line Reynaud Yannick Vaugrenard Bernadette Vergnaud |
789,168 (157,833.6) | 30.93 | ||
| UMP | Roselyne Bachelot-Narquin Ambroise Guellec |
377,984 (188,992) | 14.81 | ||
| MPF | Philippe de Villiers | 315,481 | 12.36 | ||
| UDF | Philippe Morillon | 298,871 | 11.71 | ||
| LV | Marie-Hélène Aubert | 195,546 | 7.66 | ||
| FN | None | 143,494 | 5.62 | ||
| PCF | None | 104,632 | 4.10 | ||
| GE | None | 79,529 | 3.10 | ||
| EXG | None | 58,800 | 2.30 | ||
| PRG | None | 55,890 | 2.19 | ||
| CPNT | None | 50,825 | 1.99 | ||
| La France d'en bas | None | 33,787 | 1.32 | ||
| Rassemblement des Contribuables Français | None | 19,074 | 0.75 | ||
| Workers' Party | None | 18,361 | 0.72 | ||
| Eŭropo Demokratio Esperanto | None | 4,910 | 0.19 | ||
| Vivre mieux avec l'Europe | None | 3,112 | 0.12 | ||
| AR | None | 1,874 | 0.07 | ||
| Parti Fédéraliste | None | 305 | 0.01 | ||
| Parti des Socioprofessionnels | None | 78 | 0.00 | ||
| France Unie | None | 76 | 0.00 | ||
| Pôle des Libertés | None | 66 | 0.00 | ||
| Turnout | 2,551,863 | 45.12 | |||
See also
This article is issued from
Wikipedia.
The text is licensed under Creative Commons - Attribution - Sharealike.
Additional terms may apply for the media files.