Croatia (European Parliament constituency)
| Croatia | |
|---|---|
| European Parliament constituency | |
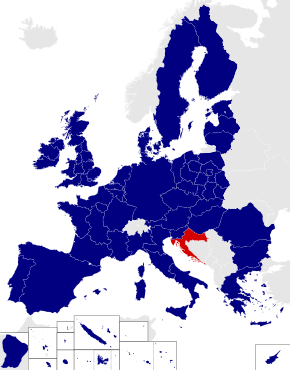 Location among the 2014 constituencies | |
| Member state | Croatia |
| Created | 2013 |
| MEPs |
12 (2013–2014) 11 (2014 – present) |
| Sources | |
In European elections, Croatia is a constituency of the European Parliament, currently represented by eleven MEPs. It covers the member state of Croatia.
Members are elected by proportional representation using open lists.[1][2]
Election results
| Seats won in elections for Members of the European Parliament for Croatia by individual parties European Parliament elections in Croatia (since 2013) | |||||||
|---|---|---|---|---|---|---|---|
| Party (European Parliament group) | 2013 | 2014 | 2019 | ||||
| Croatian Democratic Union (EPP) | 5 | 4 | |||||
| Croatian Labourists - Labour Party (EUL-NGL) | 1 | 0 | |||||
| Croatian Party of Rights dr. Ante Starčević (ECR) | 1 | 1 | |||||
| Croatian Peasant Party (EPP) | 0 | 1 | |||||
| Croatian People's Party – Liberal Democrats (ALDE) | 0 | 1 | |||||
| Croatian Sustainable Development (Greens/EFA) | – | 1 | |||||
| Istrian Democratic Assembly (ALDE) | 0 | 1 | |||||
| Social Democratic Party of Croatia (S&D) | 5 | 2 | |||||
| Total seats | 12 | 11 | 11 | ||||
| Source: State Election Commission[3][4] | |||||||
European Parliament election, 2013
| 2013 • 2014 → | |||||||||
| National party | EP Group | Votes | % | +/– | Seats | +/– | |||
|---|---|---|---|---|---|---|---|---|---|
HDZ coalition
|
243,654 | 32.86 | - | 6 / 12 5 / 12 1 / 12 0 / 12 |
- | ||||
| Kukuriku coalition | 237,778 | 32.07 | - | 5 / 12 5 / 12 0 / 12 0 / 12 |
- | ||||
| Labour | EUL–NGL | 42,750 | 5.77 | - | 1 / 12 |
- | |||
HSS-HSLS
|
28,646 | 3.86 | - | 0 / 12 0 / 12 0 / 12 |
- | ||||
| Ivan Jakovčić | Liberals & Democrats | 28,445 | 3.84 | - | 0 / 12 |
- | |||
| Croatian Democratic Alliance of Slavonia and Baranja (HDSSB) | None | 22,328 | 3.01 | - | 0 / 12 |
- | |||
| Others (parties and candidates that won less than 3% of the vote and no seats) | 137,807 | 18.59 | — | 0 / 12 |
- | ||||
| Valid votes | 741,408 | 94.93 | |||||||
| Blank and invalid votes | 39,572 | 5.07 | |||||||
| Totals | 780,980 | 100.00 | — | 12 / 12 |
|||||
| Electorate (eligible voters) and voter turnout | 3,748,815 | 20.83 | — | ||||||
| Source: State Electoral Commission of the Republic of Croatia | |||||||||
Elected Members of the European Parliament from Croatia for 2013–2014 (by party list)
| Party list 12: HDZ – HSP AS – BUZ | Party list 17: HL | Party list 24: SDP – HNS – HSU |
|---|---|---|
| 1. Dubravka Šuica (HDZ) 2. Andrej Plenković (HDZ) 3. Davor Ivo Stier (HDZ) 4. Ivana Maletić (HDZ) 5. Zdravka Bušić (HDZ) 6. Ruža Tomašić (HSP AS) |
1. Nikola Vuljanić | 1. Tonino Picula (SDP) 2. Biljana Borzan (SDP) 3. Marino Baldini (SDP) 4. Oleg Valjalo (SDP) 5. Sandra Petrović Jakovina (SDP) |
European Parliament election, 2014
| ← 2013 • 2014 • 2019 → | |||||||||
| National party | EP Group | Votes | % | +/– | Seats | +/– | |||
|---|---|---|---|---|---|---|---|---|---|
HDZ coalition
|
381,844 | 41.42 | 6 / 11 4 / 11 1 / 11 1 / 11 0 / 11 |
||||||
| Kukuriku coalition | 275,904 | 29.93 | 4 / 11 2 / 11 1 / 11 1 / 11 0 / 11 0 / 11 |
||||||
| Sustainable Development of Croatia (ORaH) | None | 86,806 | 9.42 | — | 1 / 11 |
||||
Alliance for Croatia
|
63,437 | 6.88 | — | 0 / 11 0 / 11 0 / 11 0 / 11 0 / 11 |
|||||
| Labour | EUL–NGL | 31,363 | 3.40 | 0 / 11 |
|||||
Partnership of Croatian Center
|
22,098 | 2.40 | — | 0 / 11 0 / 11 0 / 11 0 / 11 0 / 11 |
|||||
| Others | 60,452 | 6.55 | — | 0 / 11 |
|||||
| Valid votes | 921,904 | 96.94 | |||||||
| Blank and invalid votes | 29,076 | 3.06 | |||||||
| Totals | 950,980 | 100.00 | — | 11 / 11 |
|||||
| Electorate (eligible voters) and voter turnout | 3,767,343 | 25.24 | |||||||
| Source: State Election Commission | |||||||||
Elected Members of the European Parliament from Croatia for 2014–2019 (by party list)
| Party list 6: HDZ – HSS – HSP AS – BUZ | Party list 15: ORaH | 20: SDP – HNS – IDS – HSU |
|---|---|---|
| 1. Andrej Plenković (HDZ) 2. Dubravka Šuica (HDZ) 3. Ivana Maletić (HDZ) 4. Marijana Petir (HSS) 5. Ruža Tomašić (HSP AS) 6. Davor Ivo Stier (HDZ) |
1. Davor Škrlec | 1. Biljana Borzan (SDP) 2. Jozo Radoš (HNS) 3. Tonino Picula (SDP) 4. Ivan Jakovčić (IDS) |
See also
References
- ↑ "Zakon o izborima zastupnika Republike Hrvatske u Europski parlament". Croatian Parliament. Retrieved 15 April 2013.
- ↑ Uskoro idemo na izbore za Europski parlament, evo kako će to izgledati
- ↑ "Arhiva izbora" [Elections Archive] (in Croatian). State Election Commission. Retrieved 13 November 2011.
- ↑ "Rezultati izbora za županijski dom Sabora Republike Hrvatske 1997. godine" [Results of Election for the Chamber of Counties of the Parliament of the Republic of Croatia in Year 1997] (PDF) (in Croatian). State Election Commission. Retrieved 13 November 2011.
This article is issued from
Wikipedia.
The text is licensed under Creative Commons - Attribution - Sharealike.
Additional terms may apply for the media files.