Economy of Israel
 | |
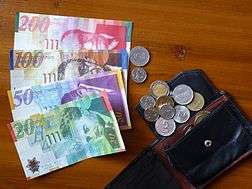
| Currency | Israeli new shekel (NIS; ₪) |
|---|---|
| Calendar year | |
Trade organisations | AIIB, BIS, CLS, EBRD, IADB, ICC, IMF, ISO, ITUC, OECD, UN, WCO, WFTU, WTO. |
| Statistics | |
| GDP |
$373.75 billion (nominal 2018) $334.33 billion (PPP 2018) |
GDP growth | 4.4% (Economist: The World in 2018, pg. 117) |
GDP per capita |
$42,120 (nominal; 2018) $37,670 (PPP; 2018)[1] |
GDP by sector |
agriculture: 2.3% industry: 26.6% services: 69.5% (2017 est.)[2] |
|
| |
Population below poverty line | 24.8% (2012)[4] |
| 37.6 (2012; 69th) | |
Labour force | 4.02 million (2017 est.)[2] |
Labour force by occupation |
agriculture: 1.1% industry: 17.3% services: 81.6% (2015 est.)[2] |
| Unemployment | 3.1% (November 2017; est. List of countries by unemployment rate)[5] |
Main industries | high-technology products (including aviation, communications, telecommunications equipment, computer hardware and software, aerospace and defense contracting, medical devices, fiber optics, scientific instruments), pharmaceuticals, potash and phosphates, metallurgy, chemical products, plastics, diamond cutting, financial services, petroleum refining, textiles.[6] |
| 54th (2018)[7] | |
| External | |
| Exports |
|
Export goods | Cut diamonds, refined petroleum, pharmaceuticals, machinery and equipment, medical instruments, computer hardware and software, agricultural products, chemicals, textiles and apparel.[8][9] |
Main export partners |
|
| Imports |
|
Import goods | Raw materials, military equipment, motor vehicles, investment goods, rough diamonds, crude petroleum, grain, consumer goods.[8][11] |
Main import partners |
|
FDI stock | $82.82 billion (2011 est.; 43rd) |
Gross external debt | $112 billion (31 December 2011 est.; 40th) |
| Public finances | |
| 59.8% of GDP (2018 est.; 28th) | |
| Revenues | $68.29 billion (2011 est.) |
| Expenses | $75.65 billion (2011 est.) |
Foreign reserves | $115,782 million (July 2018 est.[15]; 23rd) |
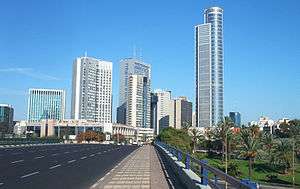
The economy of Israel is advanced by global standards.[16][17] Israel ranks within the top 20 nations in the world on the latest report of the UN's Human Development Index, which places it in the category of "Very Highly Developed", allowing the country to enjoy a higher standard of living than many other Western countries. The prosperity of Israel's advanced economy allows the country to have a sophisticated welfare state, a modern infrastructure, and a high-technology sector competitively on par with Silicon Valley.[16] Israel has the second-largest number of startup companies in the world after the United States,[18] and the third-largest number of NASDAQ-listed companies after the U.S. and China.[19] Intel[20], Microsoft[21], and Apple[22][23] built their first overseas research and development facilities in Israel, and other high-tech multi-national corporations, such as IBM, Google, HP, Cisco Systems, Facebook and Motorola have opened R&D centres in the country.[24]
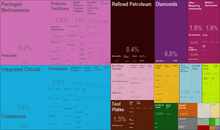
The country's major economic sectors are high-technology and industrial manufacturing; the Israeli diamond industry is one of the world's centers for diamond cutting and polishing, amounting to 23.2% of all exports.[25] Relatively poor in natural resources, Israel depends on imports of petroleum, raw materials, wheat, motor vehicles, uncut diamonds and production inputs, though the country's nearly total reliance on energy imports may change with recent discoveries of large natural gas reserves off its coast on the one hand and the leading role of the Israeli solar energy industry on the other.[26][27]
Israel's quality university education and the establishment of a highly motivated and educated populace is largely responsible for ushering in the country's high technology boom and rapid economic development.[28] With its strong educational infrastructure and high quality incubation system for new cutting edge ideas to create value driven goods and services has allowed the country to create a high concentration of high-tech companies across the country financially backed by a strong venture capital industry.[29] Its central high technology hub "Silicon Wadi" is considered second in importance only to its Californian counterpart.[30][31][32][33] Numerous Israeli companies have been acquired by global corporations for their reliable and quality corporate personnel.[34]
With such an impressive track record for creating profit driven technologies, Israel has become the first choice for many of world's leading entrepreneurs, investors, and industry giants. The economic dynamism of Israel has attracted attention from international business leaders such as Microsoft founder Bill Gates, investor Warren Buffett, real estate developer and U.S. President Donald Trump and telecommunications giant Carlos Slim. Each entrepreneur has praised Israel's economy and invested heavily across numerous Israeli industries beyond their traditional business activities and investments back in their home nations.[35][36][37][38][39][40][41][42][43][44] In 2007, American investor Warren Buffett's holding company Berkshire Hathaway bought an Israeli company, Iscar, its first acquisition outside the United States, for $4 billion.[45] The country was also the destination for Berkshire Hathaway's first investment outside the United States when it acquired ISCAR Metalworking.[34][46][47]
In September 2010, Israel was invited to join the OECD.[48] Israel has also signed free trade agreements with the European Union, the United States, the European Free Trade Association, Turkey, Mexico, Canada, Jordan, Egypt, and on 18 December 2007, became the first non-Latin-American country to sign a free trade agreement with the Mercosur trade bloc.[49][50] Israel is also a major tourist destination, with 3.6 million foreign tourists visiting it in 2017.[51][52][53][54]
History
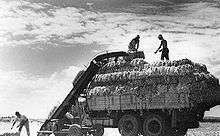
The British Mandate of Palestine that came into effect in 1920 aimed at restricting land purchases by Jewish immigrants. For this reason the Jewish population was initially more urban and had a higher share in industrial occupations. This particular development resulted economically in one of the few growth miracles of the region whereby the structure of firms was determined mainly by private entrepreneurs rather than by the government.[55] The first survey of the Dead Sea in 1911, by the Russian Jewish engineer Moshe Novomeysky, led to the establishment of Palestine Potash Ltd. in 1930, later renamed the Dead Sea Works.[56] In 1923, Pinhas Rutenberg was granted an exclusive concession for the production and distribution of electric power. He founded the Palestine Electric Company, later the Israel Electric Corporation.[57] Between 1920 and 1924, some of the countries largest factories were established, including the Shemen Oil Company, the Societe des Grand Moulins, the Palestine Silicate Company and the Palestine Salt Company.[58] In 1937, there were 86 spinning and weaving factories in the country, employing a workforce of 1,500. Capital and technical expertise were supplied by Jewish professionals from Europe. The Ata textile plant in Kiryat Ata, which went on to become an icon of the Israeli textile industry, was established in 1934.[59] The industry underwent rapid development during World War II, when supplies from Europe were cut off while local manufacturers were commissioned for army needs. By 1943, the number of factories had grown to 250, with a workforce of 5,630, and output increased tenfold.[60]
From 1924, trade fairs were held in Tel Aviv. The Levant Fair was inaugurated in 1932.[61]
After independence
After statehood, Israel faced a deep economic crisis. As well as having to recover from the devastating effects of the 1948 Arab–Israeli War, it also had to absorb hundreds of thousands of Jewish refugees from Europe and almost a million from the Arab world. Israel was financially overwhelmed and faced a deep economic crisis, which led to a policy of austerity from 1949 to 1959. Unemployment was high, and foreign currency reserves were scarce.[62]
In 1952, Israel and West Germany signed an agreement stipulating that West Germany was to pay Israel for the persecution of Jews during the Holocaust, and compensate for Jewish property stolen by the Nazis. Over the next 14 years, West Germany paid Israel 3 billion marks (equivalent to USD$111.5bn in modern currency). The reparations became a decisive part of Israel's income, comprising as high as 87.5% of Israel's income in 1956.[62] In 1950, the Israeli government launched Israel Bonds for American and Canadian Jews to buy. In 1951, the final results of the bonds program exceeded $52 million. Additionally, many American Jews made private donations to Israel, which in 1956 were thought to amount to $100 million a year. In 1957, bond sales amounted to 35% of Israel's special development budget.[63] Later in the century Israel became significantly reliant on economic aid from the United States,[64] a country which also became Israel's most important source of political support internationally.
The proceeds from these sources was invested in industrial and agricultural development projects, which allowed Israel to become economically self-sufficient. Among the projects made possible by the aid was the Hadera power plant, the Dead Sea Works, the National Water Carrier, port development in Haifa, Ashdod, and Eilat, desalination plants, and national infrastructure projects.
After statehood, priority was given to establishing industries in areas slated for development, among them Lachish, Ashkelon, the Negev and Galilee. The expansion of Israel's textile industry was a consequence of the development of cotton growing as a profitable agricultural branch. By the late 1960s, textiles were one of the largest industrial branches in Israel, second only to the foodstuff industry. Textiles constituted about 12% of industrial exports, becoming the second-largest export branch after polished diamonds.[60] In the 1990s, cheap East Asian labor decreased the profitability of the sector. Much of the work was subcontracted to 400 Israeli Arab sewing shops. As these closed down, Israeli firms, among them Delta, Polgat, Argeman and Kitan, began doing their sewing work in Jordan and Egypt, usually under the QIZ arrangement. In the early 2000s, Israeli companies had 30 plants in Jordan. Israeli exports reached $370 million a year, supplying such retailers and designers as Marks & Spencer, The Gap, Victoria's Secret, Walmart, Sears, Ralph Lauren, Calvin Klein, and Donna Karan.[60]
In its first two decades of existence, Israel's strong commitment to development led to economic growth rates that exceeded 10% annually. Between 1950 and 1963, the expenditure among wage-earner's families rose 97% in real terms.[65] Between 1955 and 1966, per capita consumption rose by 221%.[66] The years after the 1973 Yom Kippur War were a lost decade economically, as growth stalled, inflation soared and government expenditures rose significantly. Also worthy of mention is the 1983 Bank stock crisis. By 1984, the economic situation became almost catastrophic with inflation reaching an annual rate close to 450% and projected to reach over 1000% by the end of the following year. However, the successful economic stabilization plan implemented in 1985[67] and the subsequent introduction of market-oriented structural reforms[68][69] reinvigorated the economy and paved the way for its rapid growth in the 1990s and became a model for other countries facing similar economic crises.[70]
Two developments have helped to transform Israel's economy since the beginning of the 1990s. The first is waves of Jewish immigration, predominantly from the countries of the former USSR, that has brought over one million new citizens to Israel. These new Soviet Jewish immigrants, many of them highly educated had a wellspring of scientific and technical expertise to help spur Israel's burgeoning technology sector, now constitute some 15% of Israel's population.[71] The second development benefiting the Israeli economy is the peace process begun at the Madrid conference of October 1991, which led to the signing of accords and later to a peace treaty between Israel and Jordan (1994).
In the early 2000s, the Israel economy went into a downturn due to the crashing of the global dot-com bubble which bankrupted many startups established during the height of the bubble. The Second Intifada, which cost Israel billions of dollars in security costs, and a decline in investment and tourism,[72] sent unemployment in Israel to the double digits, growth in one quarter of 2000 was 10%. In 2002 the Israeli economy declined in one quarter about 4%. Afterwards Israel managed to create a remarkable recovery by opening up new markets to Israeli exporters farther afield, such as in the rapidly growing countries of East Asia. As well as a rebound in the tech sector with the gradual bottoming out of the dotcom crash and global increase in internet usage worldwide which created a demand for software, and a demand post-9/11 in Security and defense products. Both of which Israel was ready to provide due to early investment in those fields, allowed for a gradual easing of the unemployment situation within the country.
In the past few years there has been an unprecedented inflow of foreign investment in Israel, as companies that formerly shunned the Israeli market now see its potential contribution to their global strategies. In 2006, foreign investment in Israel totaled $13 billion, according to the Manufacturers Association of Israel.[73] The Financial Times said that 'bombs drop, yet Israel's economy grows'.[74] Moreover, while Israel's total gross external debt is US$95 billion, or approximately 41.6% of GDP, since 2001 it has become a net lender nation in terms of net external debt (the total value of assets vs. liabilities in debt instruments owed abroad), which as of June 2012 stood at a significant surplus of US$60 billion.[75] The country also maintains a current account surplus in an amount equivalent to about 3% of its gross domestic product in 2010.
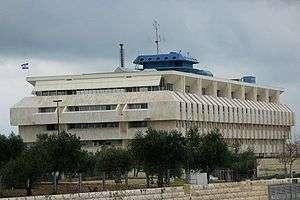
The Israeli economy withstood the late-2000s recession, registering positive GDP growth in 2009 and ending the decade with an unemployment rate lower than that of many western countries.[76] There are several reasons behind this economic resilience, for example, the fact, as stated above, that the country is a net lender rather than a borrower nation and the government and the Bank of Israel's generally conservative macro-economic policies. Two policies in particular can be cited, one is the refusal of the government to succumb to pressure by the banks to appropriate large sums of public money to aid them early in the crisis, thus limiting their risky behavior.[77] The second is the implementation of the recommendations of the Bach'ar commission in the early to mid-2000s which recommended decoupling the banks' depository- and Investment banking activities, contrary to the then-opposite trend, particularly in the United States, of easing such restrictions which had the effect of encouraging more risk-taking in the financial systems of those countries.[78]
OECD membership
In May 2007, Israel was invited to open accession discussions with the OECD.[79] In May 2010, the OECD voted unanimously to invite Israel to join, despite Palestinian objections.[80] It became a full member on 7 September 2010.[48][81] The OECD praised Israel's scientific and technological progress and described it as having "produced outstanding outcomes on a world scale."[80]
Challenges
Despite economic prosperity, the Israeli economy faces many challenges, some are short term and some are long term challenges. On the short term its inability to duplicate its success in the telecommunication industry into other growing industries hampers its economic outlooks. Its inability to foster large multinational companies in the last decade also calls into question its ability to employ large numbers of people in advanced industries.[82] On the long term, Israel is facing challenges of high dependency of the growing number of Ultra-Orthodox Jews who have a low level of official labor force participation amongst men, and this situation could lead to a materially lower employment-to-population ratio and a higher dependency ratio in the future.[83] The governor of the Bank of Israel, Stanley Fischer, stated that the growing poverty amongst the Ultra-Orthodox is hurting the Israeli economy.[84] According to the data published by Ian Fursman, 60% of the poor households in Israel are of the Haredi Jews and the Israeli Arabs. Both groups together represent 25–28% of the Israeli population. Organizations such as The Kemach Foundation, Gvahim, Jerusalem Village and The Jerusalem Business Networking Forum are addressing these challenges with job placement services and networking events.[85][86][87][88][89]
Data
The following table shows the main economic indicators in 1980–2017. Inflation under 2 % is in green.[90]
| Year | GDP (in Bil. US$ PPP) |
GDP per capita (in US$ PPP) |
GDP growth (real) |
Inflation rate (in Percent) |
Unemployment (in Percent) |
Government debt (in % of GDP) |
|---|---|---|---|---|---|---|
| 1980 | 27.7 | 7,062 | 4.8 % | n/a | ||
| 1981 | n/a | |||||
| 1982 | n/a | |||||
| 1983 | n/a | |||||
| 1984 | n/a | |||||
| 1985 | n/a | |||||
| 1986 | n/a | |||||
| 1987 | n/a | |||||
| 1988 | n/a | |||||
| 1989 | n/a | |||||
| 1990 | n/a | |||||
| 1991 | n/a | |||||
| 1992 | n/a | |||||
| 1993 | n/a | |||||
| 1994 | n/a | |||||
| 1995 | n/a | |||||
| 1996 | n/a | |||||
| 1997 | n/a | |||||
| 1998 | n/a | |||||
| 1999 | n/a | |||||
| 2000 | 79.6 % | |||||
| 2001 | ||||||
| 2002 | ||||||
| 2003 | ||||||
| 2004 | ||||||
| 2005 | ||||||
| 2006 | ||||||
| 2007 | ||||||
| 2008 | ||||||
| 2009 | ||||||
| 2010 | ||||||
| 2011 | ||||||
| 2012 | ||||||
| 2013 | ||||||
| 2014 | ||||||
| 2015 | ||||||
| 2016 | ||||||
| 2017 |
Sectors
Agriculture
In 2017, 2.3% of the country's GDP is derived from agriculture. Of a total labor force of 2.7 million, 2.6% are employed in agricultural production while 6.3% in services for agriculture.[91] While Israel imports substantial quantities of grain (approximately 80% of local consumption), it is largely self-sufficient in other agricultural products and food stuffs. For centuries, farmers of the region have grown varieties of citrus fruits, such as grapefruit, oranges and lemons. Citrus fruits are still Israel's major agricultural export. In addition, Israel is one of the world's leading greenhouse-food-exporting countries. The country exports more than $1.3 billion worth of agricultural products every year, including farm produce as well as $1.2 billion worth of agricultural inputs and technology.[92]
Financial services
Israel has over 100 active venture capital funds operating throughout the country with $10 billion USD under management. In 2004, international foreign funds from various nations around the world committed over 50 percent of the total dollars invested exemplifying the country's strong and sound reputation as an internationally sought after foreign investment by many countries.[93] Israel's venture capital sector has rapidly developed from the early 1990s, and has about 70 active venture capital funds (VC), of which 14 international VCs have Israeli offices. Israel's thriving venture capital and business-incubator industry played an important role in financing the country's flourishing high-tech sector.[94] In 2008, venture capital investment in Israel, rose 19 percent to $1.9 billion.[95]
"Between 1991 and 2000, Israel's annual venture-capital outlays, nearly all private, rose nearly 60-fold, from $58 million to $3.3 billion; companies launched by Israeli venture funds rose from 100 to 800; and Israel's information-technology revenues rose from $1.6 billion to $12.5 billion. By 1999, Israel ranked second only to the United States in invested private-equity capital as a share of GDP. Israel led the world in the share of its growth attributable to high-tech ventures: 70 percent."[96]
Israel's thriving venture capital industry has played an important role in funding the country's booming high-technology sector. The country is now teeming with hundreds of prosperous Israeli private equity and venture capital firms looking to invest in the next potential million or billion dollar business startup.[97] Many of Israel's venture capital firms have billions of dollars under management that are seeking to invest in domestic Israeli companies in order to create value by marking a strong presence across the country. The financial crisis of 2007–08 also affected the availability of venture capital locally. In 2009, there were 63 mergers and acquisitions in the Israeli market worth a total of $2.54 billion; 7% below 2008 levels ($2.74 billion), when 82 Israeli companies were merged or acquired, and 33% lower than 2007 proceeds ($3.79 billion) when 87 Israeli companies were merged or acquired.[98] Numerous Israeli high tech companies have been acquired by global corporations for its reliable corporate management and quality personnel.[34] In addition to venture capital funds, many of the world's leading investment banks, pension funds, and insurance companies have a strong presence in Israel committing their funds to financially back Israeli high-tech firms and benefit from its prosperous high tech sector. These institutional investors include Goldman Sachs, Bear Stearns, Deutsche Bank, JP Morgan, Credit Swiss First Boston, Merrill Lynch, CalPERS, Ontario Teachers Pension Plan, and AIG.[99]
Israel also has a small but fast growing hedge fund industry. Within five years between 2007 and 2012, the number of active hedge funds have doubled to 60 while the total asset values that the funds control have quadrupled in the same period . Israel based hedge funds have registered an increase of 162% since 2006 and currently manage a total of $2 billion (NIS 8 billion) as well as employing about 300 people.[100][101][102][103][104] The ever-growing hedge fund industry in Israel is also attracting a myriad of investors from around the world, particularly from the United States.[105]
High technology
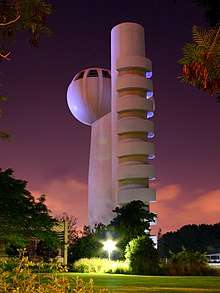
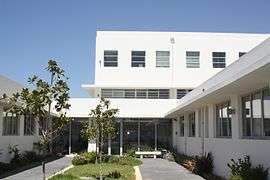
Science and technology in Israel is one of the country's most highly developed and industrialized sectors. The modern Israeli ecosystem of high technology is highly optimized making up a significant bulk of Israeli economy. The percentage of Israelis engaged in scientific and technological inquiry, and the amount spent on research and development (R&D) in relation to gross domestic product (GDP), is among the highest in the world.[106] Israel ranks fourth in the world in scientific activity, as measured by the number of scientific publications per million citizens. Israel's percentage of the total number of scientific articles published worldwide is almost 10 times higher than its percentage of the world's population.[107] Despite its small population relative to other industrialized nations around the world, Israel has the highest number of scientists and technicians per capita in the world with 140 scientists and technicians per 10,000 employees. In comparison, the same is 85 per 10,000 in the United States and 83 per 10,000 in Japan.[108]
Israeli scientists, engineers, and technicians have contributed to the modern advancement of the natural sciences, agricultural sciences, computer sciences, electronics, genetics, medicine, optics, solar energy and various fields of engineering. Israel is home to major corporate players in the high-tech industry and has one of the world's technologically most literate populations.[109] In 1998, Tel Aviv was named by Newsweek as one of the ten technologically most influential cities in the world.[110] In 2012, the city was also named one of the best places for high-tech startup companies, placed second behind its California counterpart.[111][112] In 2013, Tel Aviv repeated the feat where the American newspaper, Boston Globe ranked Tel Aviv as the second best city for business start-ups, after Silicon Valley[113] Israel has the largest number of startup companies globally, second only to the United States and remains one of the largest centers in the world for technology start-up enterprises.[29][16] 200 start-ups are created annually and more than 2500 start-up companies are operating throughout the country.[31][114]
As a result of the country's highly renowned and creative start-up culture, Israel is often referred to as the Start-up Nation (adapted from the book Start-Up Nation, by Dan Senor and Saul Singer)[115][116][117][118] and the "Silicon Valley of the Middle East".[97] There are even numerous programs that send people to Israel to explore the "Start-Up Nation" economy (such as TAVtech Ventures and TAMID Group).[119][120][121]
Energy


Historically, Israel relied on external imports for meeting most of its energy needs, spending an amount equivalent to over 5% of its GDP per year in 2009 on imports of energy products.[122] The transportation sector relies mainly on gasoline and diesel fuel, while the majority of electricity production is generated using imported coal. As of 2013, Israel was importing about 100 mln barrels of oil per year.[123] The country possesses negligible reserves of crude oil but does have abundant domestic natural gas resources which were discovered in large quantities starting in 2009, after many decades of previously unsuccessful exploration.[26][124][125][126][127]
Natural gas
Until the early 2000s, natural gas use in Israel was minimal. In the late 1990s, the government of Israel decided to encourage the usage of natural gas because of environmental, cost, and resource diversification reasons. At the time however, there were no domestic sources of natural gas and the expectation was that gas would be supplied from overseas in the form of LNG and by a future pipeline from Egypt (which eventually became the Arish–Ashkelon pipeline). Plans were made for the Israel Electric Corporation to construct several gas-driven power plants, for erecting a national gas distribution grid, and for an LNG import terminal. Soon thereafter, gas began to be located within Israeli territory, first in modest amounts and a decade later in very large quantities located in deep water off the Israeli coastline. This has greatly intensified the utilization of natural gas within the Israeli economy, especially in the electrical generation and industrial sectors, with consumption growing from an annual average of 9,900,000 m3 (350×106 cu ft) between 2000 and 2002 to 3.7×10⁹ m3 (129×109 cu ft) in 2010.[124]
| 2004 | 2005 | 2006 | 2007 | 2008 | 2009 | 2010 | 2014 | 2016 | 2018* | 2020* | 2022* | 2024* | 2026* | 2028* | 2030* |
|---|---|---|---|---|---|---|---|---|---|---|---|---|---|---|---|
| 1.2 | 1.6 | 2.3 | 2.7 | 3.7 | 4.2 | 5.2 | 7.6 | 9.5 | 10.1 | 11.1 | 11.7 | 13 | 14.3 | 15.3 | 16.8 |
| Figures are in Billion Cubic Meters (BCM) per year. *Projected | |||||||||||||||
Recent discoveries
In 2000, a modest discovery was made when a 33-billion-cubic-metre (BCM), or 1,200-billion-cubic-foot, natural-gas field was located offshore Ashkelon, with commercial production starting in 2004. As of 2014 however, this field is nearly depleted—earlier than expected due to increased pumping to partially compensate for the loss of imported Egyptian gas in the wake of unrest associated with the fall of the Mubarak regime in 2011. In 2009, a significant gas find named Tamar, with proven reserves of 223 BCM or 7.9×10¹² cu ft (307 BCM total proven + probable) was located in deep water approximately 90 km (60 mi) west of Haifa, as well as a smaller 15 BCM (530×109 cu ft) field situated nearer the coastline.[129][130][131][132] Furthermore, results of 3D seismic surveys and test drilling conducted since 2010 have confirmed that an estimated 621 BCM (21.9×10¹² cu ft) natural-gas deposit named Leviathan exists in a large underwater geological formation nearby the large gas field already discovered in 2009.[133][134][135][136] An article in The Economist stated that Israel had "verified" gas finds of 35 trillion cubic feet as of early 2014.[137] The US Energy Information Administration listed Israel as having 7.0 trillion cubic feet of proved reserves as of 1 January 2015.[138]
The Tamar field began commercial production on 30 March 2013 after four years of extensive development works.[139] The supply of gas from Tamar is expected to provide a boost to the Israeli economy, which has suffered losses of more than NIS20 billion between 2011 and 2013 resulting from the disruption of gas supplies from neighboring Egypt (and which are not expected to resume due to Egypt's decision to indefinitely suspend its gas supply agreement to Israel).[140][141] As a result, Israel, as well as its other neighbor Jordan, which also suffered from disruption of gas deliveries from Egypt, had to resort to importing significantly more expensive and polluting liquid heavy fuels as substitute sources of energy. The ensuing energy crisis in Israel was lifted once the Tamar field came online in 2013, while Jordan committed to a US$10 billion, 15-year gas supply deal totaling 45 BCM from the Israeli Leviathan field which is scheduled to come online in late 2019.[142] The agreement is estimated to save Jordan US$600 million per year in energy costs.[143] In 2018, the owners of the Tamar and Leviathan fields announced that they are negotiating an agreement with a consortium of Egyptian firms, subject to regulatory approval in both countries, for the supply of up to 64 BCM of gas over 10 years valued at up to US$15 billion. Although Egypt has been making strides in developing new gas fields in recent years to help it meet rising domestic demand, it also has idle LNG exporting capacity and the deal has the potential to help make it an important regional gas export hub.[144]
The large gas discoveries so far have confirmed that the Levant basin of the Eastern Mediterranean contains significant quantities of natural gas and, potentially, crude oil. Consequently, additional exploration for oil and gas off Israel's coastline is continuing.[126][145] A source close to Prime Minister Benjamin Netanyahu has valued Israel's natural gas reserves at $130 billion,[146] while in 2012 BusinessWeek estimated the reserves' value at $240 billion.[147] The businesses involved in exploration aim to export a share of future production, but others argue that it would be preferable, on geopolitical grounds, to use the gas within the country instead of other energy sources.[148] In early 2012 the Israeli cabinet announced plans to set up a sovereign wealth fund (called "the Israeli Citizens' Fund") that would allocate part of the royalties from energy exploration to education, defense and overseas investments.[149]
| Field[150] | Discovered | Production | Estimated size |
|---|---|---|---|
| Noa North | 1999[151] | 2012 to 2014 | originally, 50 billion cubic feet (1.4 billion cubic metres); field depleted |
| Mari-B | 2000 | 2004 to 2015 | originally, 1 trillion cubic feet (28 billion cubic metres); field depleted |
| Tamar | 2009 | 2013 | 10.8 trillion cubic feet (310 billion cubic metres)[132] |
| Dalit | 2009 | Not in production | 700 billion cubic feet (20 billion cubic metres) |
| Leviathan | 2010 | 2020 (expected) | 22 trillion cubic feet (620 billion cubic metres) |
| Dolphin | 2011 | Not in production | 81.3 billion cubic feet (2.30 billion cubic metres)[152] |
| Tanin | 2012 | Not in production | 1.2–1.3 trillion cubic feet (34–37 billion cubic metres) |
| Karish | 2013 | 2022 (expected) | 2.3–3.6 trillion cubic feet (65–102 billion cubic metres) |
Electricity
Since the founding of the state through the mid-2010s decade, the state-owned utility, Israel Electric Corporation (IEC) had an effective monopoly on power generation in the country. In 2010 the company sold 52,037 GWh of electricity. Until the mid-2010s the country also faced a persistently low operating reserve, which is mostly the result of Israel being an "electricity island". Most countries have the capability of relying on power drawn from producers in adjacent countries in the event of a power shortage. Israel's grid however, is unconnected to those of neighboring countries. This is mostly due to political reasons but also to the considerably less-developed nature of the power systems of Jordan and Egypt, whose systems constantly struggle to meet domestic demand and whose per-capita electric generation is less than one fifth that of Israel's. Nevertheless, while operating reserves in Israel were low, the country possessed sufficient generation and transmission capacity to meet domestic electricity needs and unlike in the countries surrounding it, rolling blackouts have historically been quite rare, even at periods of extreme demand.
Facing increasing demand for electricity and concerned about the low reserve situation, the government of Israel began taking steps to increase the supply of electricity and operating reserve, as well to reduce the monopoly position of the IEC and increase competition in the electricity market starting in second half of the 2000s decade. It instructed the IEC to construct several new power stations and encouraged private investment in the generation sector. By 2015, the IEC's share of total nationwide installed electric generation capacity had fallen to about 75%, with the company then possessing an installed generation capacity of about 13.6 gigawatts (GW). Since 2010, Independent Power Producers have constructed three new gas-fired combined cycle power stations with a total generation capacity of about 2.2 GW, while various industrial concerns constructed on-premises cogeneration facilities with a total electricity output of about 1 GW, and which are licensed by the electric authority to sell surplus electricity to the national grid at competitive rates. Also under construction is a 300 MW pumped storage facility, with two more in planning, plus several solar-powered plants.
In addition to the above steps, Israel and Cyprus are considering implementing the proposed EuroAsia Interconnector project. This consists of laying a 2000MW HVDC undersea power cable between them and between Cyprus and Greece, thus connecting Israel to the greater European power grid.[153] If carried out, this will allow to further increase the country's operating reserve as well as sell surplus electricity abroad.
In 2016, total nationwide electricity production was 67.2 GWh, of which 55.2% was generated using natural gas and 43.8% using coal — the first time the share of electricity production using natural gas exceeded that generated using coal.
| Coal | Fuel oil | Natural gas | Diesel | |
|---|---|---|---|---|
| Installed capacity by plant type | 39.7% | 3.4% | 39.8% | 18.9% |
| Total annual generation by fuel source | 61.0% | 0.9% | 36.6% | 1.5% |
Solar power
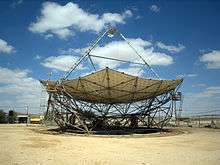
Solar power in Israel and the Israeli solar energy industry has a history that dates to the founding of the country. In the 1950s, Levi Yissar developed a solar water heater to help assuage an energy shortage in the new country.[154] By 1967 around one in twenty households heated their water with the sun and 50,000 solar heaters had been sold.[154] With the 1970s oil crisis, Harry Zvi Tabor, the father of Israel's solar industry, developed the prototype solar water heater that is now used in over 90% of Israeli homes.[155] Israeli engineers are on the cutting edge of solar energy technology,[156] and its solar companies work on projects around the world.[157]
Industrial manufacturing
Israel has a large industrial capacity with a well-developed chemical industry with many of its products aimed at the export market. Most of the chemical plants are located in Ramat Hovav, the Haifa Bay area and near the Dead Sea. Israel Chemicals is one of largest fertilizer and chemical companies in Israel and its subsidiary, the Dead Sea Works in Sdom is the world's fourth largest producer and supplier of potash products.[158] The company also produces other products such as magnesium chloride, industrial salts, de-icers, bath salts, table salt, and raw materials for the cosmetic industry.[158] One of the country's largest employers is Israel Aerospace Industries which produces mainly aviation, space, and defense products. In 2017 the company had an order backlog of 11.4 billion US dollars.[159] Another large employer is Teva Pharmaceutical Industries, one of the world's largest pharmaceutical companies, employing 40,000 people as of 2011. It specializes in generic and proprietary pharmaceuticals and active pharmaceutical ingredients. It is the largest generic drug manufacturer in the world and one of the 15 largest pharmaceutical companies worldwide.[160][161] Industrial production of metals, electrical equipment, construction materials, consumer goods, and textiles, as well as food processing also form a significant part of the manufacturing sector.
Diamond industry
Israel is one of the world's three major centers for polished diamonds, alongside Belgium and India. Israel's net polished diamond exports slid 22.8 percent in 2012 as polished diamond exports fell to $5.56 billion from $7.2 billion in 2011. Net exports of rough diamonds dropped 20.1 percent to $2.8 billion and net exports of polished diamonds slipped 24.9 percent to $4.3 billion, while net rough diamond imports dropped 12.9 percent to $3.8 billion. Net exports and imports have dropped due to the ongoing Global financial crisis, particularly within the Eurozone and the United States. The United States is the largest market accounting for 36% of overall export market for polished diamonds while Hong Kong remains at second with 28 percent and Belgium at 8 percent coming in third.[162][163][164][165] As of 2016, cut diamonds were Israel's largest export product, comprising 23.2% of all exports.[25]
Defense contracting
Israel is one of the world's major exporters of military equipment, accounting for 10% of the world total in 2007. Three Israeli companies were listed on the 2010 Stockholm International Peace Research Institute index of the world's top 100 arms-producing and military service companies: Elbit Systems, Israel Aerospace Industries and RAFAEL.[166][167] The Defense industry in Israel is a strategically important sector and a large employer within the country. It is also a major player in the global arms market and is the 11th largest arms exporter in the world as of 2012.[168] Total arms transfer agreements topped 12.9 billion between 2004 and 2011.[169] There are over 150 active defense companies based in the country with combined revenues of more than 3.5 billion USD annually.[170] Israeli defense equipment exports have reached 7 billion U.S. dollars in 2012, making it a 20 percent increase from the amount of defense-related exports in 2011. Much of the exports are sold to the United States and Europe. Other major regions that purchase Israeli defense equipment include Southeast Asia and Latin America.[171][172][173] India is also major country for Israeli arms exports and has remained Israel's largest arms market in the world.[174][175] Israel is considered to be the leading UAV exporter in the world.[176] According to the Stockholm International Peace Research Institute, Israeli defense companies were behind 41% of all drones exported in 2001–2011.[177]
Tourism
Tourism is one of Israel's major sources of income in the country, attracting 3.6 million foreign tourists in 2017, yielding a 25 percent growth since 2016 and contributed NIS 20 billion to the Israeli economy making it an all-time record.[51][52][178][179] The most popular paid site is Masada.[180]
External trade
Israel usually posts a modest trade deficit in goods. Its main goods imports consist of raw materials, crude oil, production inputs and finished consumer goods. Most of its exports are high-value-added items such as electronic components and other high-technology equipment, tools, and machinery, cut diamonds, refined petrochemicals, and pharmaceuticals. It normally posts a substantial trade surplus in services thanks to tourism and service industries such as software development, engineering services, and biomedical and scientific research and development. Therefore, overall external trade is positive, contributing to a significant current account surplus which as of 2017 stood at 4.7% of GDP.[8]
In 2016, Israeli goods exports totaled US $55.8 billion.[181] It imported US $61.9 billion worth of goods in the same year.[182] In 2017 total exports (goods and services) amounted to US $102.3 billion, while imports totaled $96.7 billion.[183]
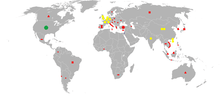
The United States is Israel's largest trading partner, and Israel is the United States' 26th-largest trading partner;[184] two-way trade totaled some $24.5 billion in 2010, up from $12.7 billion in 1997. The principal U.S. exports to Israel include computers, integrated circuits, aircraft parts and other defense equipment, wheat, and automobiles. Israel's chief exports to the U.S. include cut diamonds, jewelry, integrated circuits, printing machinery, and telecommunications equipment. The two countries signed a free trade agreement (FTA) in 1985 that progressively eliminated tariffs on most goods traded between the two countries over the following ten years. An agricultural trade accord was signed in November 1996, which addressed the remaining goods not covered in the FTA. Some non-tariff barriers and tariffs on goods remain, however. Israel also has trade and cooperation agreements in place with the European Union and Canada, and is seeking to conclude such agreements with a number of other countries, including Turkey, Jordan and several countries in Eastern Europe.
In regional terms, the European Union is the top destination for Israeli exports. In the four-month period between October 2011 and January 2012, Israel exported goods totalling $5 billion to the EU – amounting to 35% of Israel's overall exports. During the same period, Israeli exports to East Asia and the Far East totaled some $3.1 billion.[185]
Until 1995, Israel's trade with the Arab world was minimal due to the Arab League boycott, which was begun against the Jewish community of Palestine in 1945. Arab nations not only refused to have direct trade with Israel (the primary boycott), but they also refused to do business with any corporation that operated in Israel (secondary boycott), or any corporation that did business with a corporation that did business with Israel (tertiary boycott).
In 2013, commercial trade between Israel and the Palestinian territories were valued at US$20 billion annually.[186]
In 2012, ten companies were responsible for 47.7% of Israel's exports. These companies were Intel Israel, Elbit Systems, Oil Refineries Ltd, Teva Pharmaceuticals, Iscar, Israel Chemicals, Makhteshim Agan, Paz Oil Company, Israel Aerospace Industries and the Indigo division of Hewlett-Packard. The Bank of Israel and Israel's Export Institute have warned that the country is too dependent on a small number of exporters.[187]
Export destinations and import origins
|
| ||||||||||||||||||||||||||||||||||||||||||||||||||||||||||||||||||||||||||||||||||||||||||||||||||||||||||||||||||||||||
Rankings
The Global Competitiveness Report of 2016 to 2017 ranked Israel as having the world's second most innovative economy.[208] It was also ranked 18th among 188 world nations on the UN's Human Development Index, which places it in the category of "Very Highly Developed."[209] As of 2014, Israel ranks 19th out of 124 countries on the economic complexity index. The IMD World Competitiveness Yearbook of 2016 ranked Israel's economy as world 21st most competitive out of the 61 economies surveyed.[210] The Israeli economy was ranked as the world's most durable economy in the face of crises, and was also ranked first in the rate research and development center investments.[211] The Bank of Israel was ranked first among central banks for its efficient functioning, up from the 8th place in 2009. Israel was ranked first also in its supply of skilled manpower.[211] Israeli companies, particularly in the high-tech area, have enjoyed considerable success raising money on Wall Street and other world financial markets: as of 2010 Israel ranked second among foreign countries in the number of its companies listed on U.S. stock exchanges.[212]
Having moved away from the socialist economic model since the mid-1980s and early 1990s, Israel has made dramatic moves toward the free-market capitalist paradigm. As of 2012, Israel's economic freedom score is 67.8, making its economy the 48th freest in the 2012 Index of Economic Freedom. Israel's economic competitiveness is helped by strong protection of property rights, relatively low corruption levels, and high openness to global trade and investment. Income and corporate tax rates remain relatively high.[213] As of 2011, Israel ranks 36th out of 182 countries in Transparency International's Corruption Perceptions Index. Bribery and other forms of corruption are illegal in Israel, which is a signatory to the OECD Bribery Convention since 2008.[213]
Indicators
Average wages in 2007 hovered around $133 per day.[214]
| Annual data 2011 | |
|---|---|
| Population (m): 7.6 | Population growth: 1.5% |
| GDP per capita (US$; PPP): $31,400 | Real GDP growth: 4.7% |
| Unemployment rate (2011): 5.6% | Inflation: 3.5% |
| Exchange rate (av) NIS:US$: 3.9 | Current-account balance (% of GDP): 0.1% |
See also
References
- ↑ "World Economic Outlook". International Monetary Fund. Retrieved 19 May 2018.
- 1 2 3 4 5 6 "The World Factbook- Israel". Central Intelligence Agency. Retrieved 12 May 2018.
- ↑ name="CIA World Fact Book - Israel"
- ↑ "Israel: a divided society". Israel: High voter turnout results in setback for Netanyahu. 23 January 2013. Retrieved 23 January 2013.
- ↑ "Israel Central Bureau of Statistics". Central Bureau of Statistics. Archived from the original on 27 May 2015. Retrieved 27 May 2015.
- ↑ "Israel: Trade Statistics". Global Edge. Retrieved 18 March 2013.
- ↑ "Ease of Doing Business in Israel". Doingbusiness.org. Retrieved 21 November 2017.
- 1 2 3 "Israel Country Profile". CIA World Factbook. Retrieved 3 March 2018.
- ↑ "Israel". OEC.
- ↑ "Exports Partners of Israel". CIA World Factbook. 2016. Retrieved 3 March 2018.
- ↑ "Israel". OEC.
- ↑ "Credit scoring agency gives Israel its highest-ever rating". Retrieved 10 August 2018.
- ↑ "Credit Rating - Moody's". moodys.com. Retrieved 10 August 2018.
- ↑ Editorial, Reuters. "Fitch Affirms Israel at 'A+'; Outlook Stable". U.S. Retrieved 10 August 2018.
- ↑ http://www.maariv.co.il/breaking-news/Article-655128
- 1 2 3 Chua, Amy (2003). World On Fire. Knopf Doubleday Publishing. pp. 219–220. ISBN 978-0385721868.
- ↑ "Economy of Israel" in CIA 2011 World Factbook, web:CIA-IS.
- ↑ Bounfour, Ahmed; Edvinsson, Leif (2005). Intellectual Capital for Communities: Nations, Regions, and Cities. Butterworth-Heinemann. p. 47 (368 pages). ISBN 0-7506-7773-2.
- ↑ Richard Behar (11 May 2016). "Inside Israel's Secret Startup Machine". Forbes. Retrieved 30 October 2016.
- ↑ Krawitz, Avi (27 February 2007). "Intel to expand Jerusalem R&D". The Jerusalem Post. Retrieved 20 March 2012.
- ↑ "Microsoft Israel R&D center: Leadership". Microsoft. Archived from the original on 13 March 2012. Retrieved 19 March 2012.
Avi returned to Israel in 1991, and established the first Microsoft R&D Center outside the US ...
- ↑ Shelach, Shmulik (14 December 2011). "Apple to set up Israel development center". Globes. Retrieved 10 February 2013.
- ↑ Shelach, Shmulik (10 February 2013). "Apple opens Ra'anana development center". Globes. Retrieved 10 February 2013.
- ↑ "Berkshire Announces Acquisition". New York Times. 6 May 2006. Retrieved 15 May 2010.
- 1 2 https://atlas.media.mit.edu/en/profile/country/isr/
- 1 2 Buck, Tobias (31 August 2012). "Field of dreams: Israel's natural gas". Financial Times Magazine. Retrieved 2 September 2012.
- ↑ "What a gas!". The Economist. 11 November 2010.
- ↑ David Adler (10 March 2014). "Ambitious Israeli students look to top institutions abroad". ICEF. Retrieved 20 January 2015.
- 1 2 Karr, Steven (24 October 2014). "Imagine a World Without Israel - Part 2". Huffington Post. Retrieved 29 October 2016.
- ↑ Chua, Amy (2003). World On Fire. Knopf Doubleday Publishing. p. 31. ISBN 978-0385721868.
- 1 2 "The Intellectual Capital of the State of Israel" (PDF). State of Israel Ministry of Industry, Trade, and Labor. November 2007. p. 27. Retrieved 18 March 2013.
- ↑ "Israel's technology cluster". The Economist. 19 March 2008. Retrieved 17 October 2012.
- ↑ Dolmadjian, Katia (28 June 2011). "Israeli innovators build new 'Silicon Valley'". Agence France-Presse. Retrieved 17 October 2012.
- 1 2 3 "FUNDING THE FUTURE: Advancing STEM in Israeli Education" (PDF). STEM Israel. 4 December 2012. Retrieved 18 March 2013.
- ↑ "Carlos Slim investing 60 million dollars in an Israeli startup". Israel News. Retrieved 12 April 2015.
- ↑ Ora Coren. "Mexican mogul Carlos Slim eyes investments in Israel". Haaretz. Retrieved 12 April 2015.
- ↑ "Carlos Slim: We want to invest more in Israel". Globes. 28 November 2013. Retrieved 12 April 2015.
- ↑ "Donald Trump Plans World-Class Golf Course in Israel". Algemeiner. 17 May 2013. Retrieved 9 August 2013.
- ↑ Allison Kaplan Sommer (2 December 2002). "Microsoft's Bill Gates: Israel is a vital resource for us". Israel 21. Retrieved 9 August 2013.
- ↑ Maya Shwayder (15 January 2013). "Donald Trump, Big In Israel, Endorses Prime Minister Benjamin Netanyahu". IB Times. Retrieved 9 August 2013.
- ↑ "Bill Gates pledges new investment in Israel". Wis TV. 26 October 2005. Retrieved 9 August 2013.
- ↑ "Donald Trump to U.S. – "You're fired!"". Wise Money Israel. 21 June 2013. Retrieved 9 August 2013.
- ↑ David Lev (2 May 2013). "Buffett: Israel a Top Place for Ideas, Investments". Israel National News. Retrieved 9 August 2013.
- ↑ "Israeli Business Investments". Israeli Business Investment.com. Archived from the original on 2 July 2013. Retrieved 9 August 2013.
- ↑ "Berkshire Announces Acquisition". New York Times. 6 May 2006. Retrieved 15 May 2010.
- ↑ Shelach, Shmulik (14 December 2011). "Apple to set up Israel development center". Globes. Retrieved 10 February 2013.
- ↑ Shelach, Shmulik (10 February 2013). "Apple opens Ra'anana development center". Globes. Retrieved 10 February 2013.
- 1 2 "Israel's accession to the OECD". Organisation for Economic Co-operation and Development. Retrieved 15 October 2012.
- ↑ Israel's Free Trade Area Agreements, IL: Tamas, archived from the original on 3 October 2011, retrieved 8 September 2011
- ↑ "Israel signs free trade agreement with Mercosur". Israel Ministry of Foreign Affairs. 19 December 2007. Retrieved 15 October 2012.
- 1 2 Yan (3 January 2018). "Israel sees record 3.6 mln inbound tourists in 2017". Xinhua.
- 1 2 Amir, Rebecca Stadlen (3 January 2018). "Israel sets new record with 3.6 million tourists in 2017". Israel21.
- ↑ Raz-Chaimovich, Michal (27 December 2017). "Record 3.6m tourists visit Israel in 2017". Globes.
- ↑ "Israel Sees Record 3.6 Million Tourists in 2017". Atlanta Jewish Times. 4 January 2018. Archived from the original on 11 January 2018.
- ↑ Baten, Jörg (2016). A History of the Global Economy. From 1500 to the Present. Cambridge University Press. p. 227. ISBN 9781107507180.
- ↑ The political economy of Israel: From ideology to stagnation, Yakir Plessner, p.72. Google Books. Retrieved on 8 September 2011.
- ↑ "The Seventh Dominion?". Time. 4 March 1929. Retrieved 24 May 2007.
- ↑ The Roots of Separatism in Palestine: British Economic Policy, 1920-1929, ed. Barbara Jean Smith
- ↑ Tsur, Doron. (12 October 2010) "When the guns fell silent", Haaretz. Retrieved on 8 September 2011.
- 1 2 3 "Textiles", Jewish Virtual Library. Retrieved on 8 September 2011.
- ↑ "City of Work and Prosperity": The Levant Fair Archived 24 December 2013 at the Wayback Machine.
- 1 2 הויכוח סביב הסכם השילומים (in Hebrew). Archived from the original on 17 December 2011. Retrieved 15 October 2012.
- ↑ "ORGANIZATIONS: Dollars for Israel". Time. 21 January 1957.
- ↑ Mark, Clyde (12 July 2004). "Israel: US Foreign Assistance" (PDF). Congressional Research Service. Retrieved 19 July 2012.
- ↑ The Challenge Of Israel by Misha Louvish
- ↑ Israel: A History by Anita Shapira
- ↑ Eleventh Knesset. Knesset.gov.il. Retrieved on 8 September 2011.
- ↑ Bruno, Michael; Minford, Patrick (1986). "Sharp Disinflation Strategy: Israel 1985". Economic Policy. 1 (2): 379–407. JSTOR 1344561.
- ↑ Israel's Economy: 1986–2008, Rafi Melnick and Yosef Mealem
- ↑ Fischer, Stanley (1987). "The Israeli Stabilization Program, 1985-86". The American Economic Review. American Economic Association. 77 (2): 275–278. JSTOR 1805463.
- ↑ Sherwood, Harriet (17 August 2011). "Israel's former Soviet immigrants transform adopted country". The Guardian. Retrieved 25 February 2018.
- ↑ De Boer, Paul; Missaglia, Marco (September 2007). "Economic consequences of intifada: a sequel" (PDF). Econometric Institute Report. Erasmus University Rotterdam. Retrieved 15 October 2012.
- ↑ "Israeli Growth", Dateline World Jewry, September 2007
- ↑ / Middle East / Arab-Israel conflict – Israeli economy shrugs off political turmoil. Financial Times (7 May 2007). Retrieved on 8 September 2011.
- ↑ "Israel's International Investment Position (IIP), June 2012". Bank of Israel. 19 September 2012. Retrieved 15 October 2012.
- ↑ Bassok, Moti (1 January 2010). "GDP, jobs figures end 2009 on a high". Haaretz. Retrieved 17 October 2012.
- ↑ Benchimol, J. (2016). "Money and monetary policy in Israel during the last decade". Journal of Policy Modeling. 38 (1): 103–124. doi:10.1016/j.jpolmod.2015.12.007.
- ↑ Rolnik, Guy (31 December 2009). כך ביזבזנו עוד משבר ענק [How another Giant Crisis was Wasted]. TheMarker (in Hebrew). Retrieved 17 October 2012.
- ↑ "Israel invited to join the OECD". Retrieved 21 May 2007.
- 1 2 OECD members vote unanimously to invite Israel to join. BBC News (10 May 2010). Retrieved on 8 September 2011.
- ↑ "Members and partners". Organisation for Economic Co-operation and Development. Retrieved 15 October 2012.
- ↑ "What's Next for the Startup Nation?". Archived from the original on 19 August 2012. Retrieved 15 October 2012.
- ↑ OECD Economic Outlook: Israel
- ↑ BoI chief: Haredi unemployment is hurting Israel's economy
- ↑ "Helping business people blossom". The Jerusalem Post | JPost.com. Retrieved 30 May 2016.
- ↑ "'Made in Israel'". The Jerusalem Post | JPost.com. Retrieved 30 May 2016.
- ↑ "Native and new Israelis try to bridge the immigrant gap". The Times of Israel. Retrieved 30 May 2016.
- ↑ "Nonprofit Gvahim celebrates first career-placement program for olim in Jerusalem". The Jerusalem Post | JPost.com. Retrieved 30 May 2016.
- ↑ "Israel Country Study Guide Volume 1 Strategic Information and Developments - IBP, Inc - Google Books". Books.google.com. Retrieved 28 January 2018.
- ↑ "Report for Selected Countries and Subjects". www.imf.org. Retrieved 2018-09-19.
- ↑ Agriculture in Israel – Facts and Figures 2008 – Israeli ministry of Agriculture Presentation Archived 9 August 2009 at the Wayback Machine.. Moag.gov.il. Retrieved on 8 September 2011.
- ↑ "Israeli Agro-Technology". Jewish Virtual Library. Retrieved 27 March 2013.
- ↑ "Economic Overviews". Israel Trade Commission. Retrieved 18 March 2013.
- ↑ Venture Capital in Israel Archived 18 February 2006 at the Wayback Machine.. Investinisrael.gov.il (21 June 2010). Retrieved on 8 September 2011.
- ↑ International venture funding rose 5 percent in 2008. VentureBeat (18 February 2009). Retrieved on 8 September 2011.
- ↑ Gilder, George (Summer 2009). "Silicon Israel – How market capitalism saved the Jewish state". City Journal. 19 (3). Retrieved 24 August 2018.
- 1 2 "China-Israel economic, tech cooperation to enter new stage: Israeli minister". China Daily. 9 September 2017.
- ↑ Venture Capital in Israel Archived 18 February 2006 at the Wayback Machine.
- ↑ Yoram Ettinger. "Investing in Israel". The New York Times. Archived from the original on 9 May 2013. Retrieved 18 March 2013.
- ↑ Israel belatedly joins the global hedge fund boom - Israel News | Haaretz Daily Newspaper
- ↑ Israel Stakes Claim As Future Hedge Fund Center | FINalternatives
- ↑ Israeli hedge fund industry enjoys massive growth
- ↑ "Archived copy". Archived from the original on 27 October 2012. Retrieved 16 January 2013.
- ↑ Tzur Management - Israel Hedge Fund Survey | Tzur Management
- ↑ How Israeli hedge funds can exploit their US potential - Globes
- ↑ Invest In Israel. Where Breakthroughs Happen Archived 17 June 2012 at the Wayback Machine.
- ↑ Ilani, Ofri (17 November 2009). "Israel ranks fourth in the world in scientific activity, study finds". Haaretz. Retrieved 17 October 2012.
- ↑ Shteinbuk, Eduard (22 July 2011). "R&D and Innovation as a Growth Engine" (PDF). National Research University – Higher School of Economics. Retrieved 11 May 2013.
- ↑ "Israel profile - Media". BBC News. British Broadcasting Corporation. 24 July 2012. Retrieved 14 October 2012.
- ↑ "Tel Aviv One of The World's Top High-Tech Centers". Jewish Virtual Library. American-Israeli Cooperative Enterprise. Retrieved 14 October 2012.
- ↑ "After Silicon Valley, Tel Aviv Ranks Best for Tech Startups: Study". Bloomberg.
- ↑ Tel Aviv named top startup center | ISRAEL21c
- ↑ "Tel Aviv No. 2 city for tech startups". Ynetnews.com. Retrieved 28 January 2018.
- ↑ "Israel Association of Electronics & Software Industries Overview 2011" (PDF). Israel Association of Electronics and Software Industries. Archived from the original (PDF) on 13 May 2013. Retrieved 18 March 2013.
- ↑ Mitchell, Julian. "Startup Nation: This Israeli Company Uses Military Principles To Build Scalable Businesses". Forbes. Retrieved 13 August 2017.
- ↑ "How Israel turned itself into a startup nation - Times of India". The Times of India. Retrieved 13 August 2017.
- ↑ "What next for the start-up nation?". The Economist. 21 January 2012. ISSN 0013-0613. Retrieved 13 August 2017.
- ↑ Rogers, Stewart (6 October 2017). "Israel: 'Startup Nation' — the good, the great, and the one fatal flaw". VentureBeat. Retrieved 2 April 2018.
- ↑ "The TAMID Israel Investment Group". www.schusterman.org. Retrieved 13 August 2017.
- ↑ "Ivy Leaguers on winter break learn coding in Israel". Israel21c. Retrieved 13 August 2017.
- ↑ "TavTech: Launching The Next Generation Of The Startup Nation". The Forward. Retrieved 13 August 2017.
- ↑ Asa-El, Amotz (27 January 2009). "Gas discovery tempers Israeli recession blues". MarketWatch. Archived from the original on 28 January 2013. Retrieved 17 October 2012.
- ↑ Israel's Key Energy Statistics - Energy Information Administration site
- 1 2 "Oil and natural gas in the Eastern Mediterranean region (summer 2013 report)". U.S. Energy Information Administration. 15 August 2013. Archived from the original on 1 September 2013. Retrieved 24 August 2013.
- ↑ Levinson, Charles; Chazan, Guy (30 December 2010). "Big Gas Find Sparks a Frenzy in Israel". The Wall Street Journal. Retrieved 1 January 2011.
- 1 2 Bar-Eli, Avi (26 April 2011). "400 Drills in 60 Years: Is there Oil in Israel?". TheMarker (in Hebrew). Retrieved 27 April 2011.
- ↑ Udasin, Sharon (3 July 2012). "New Natural Gas Wealth Means Historic Change for Israel". National Geographic News. part of "The Great Energy Challenge" series. Retrieved 25 August 2012.
- ↑ "Delivery System". Israel Natural Gas Lines, Ltd. Archived from the original on 4 September 2012. Retrieved 24 March 2012.
- ↑ "Delek Group Subsidiaries Announce Preliminary Results of 3D Seismic Survey & Updates on Tamar & Mari-B Fields" (Press release). Delek Group. 3 June 2010. Archived from the original on 21 January 2013. Retrieved 3 June 2010.
- ↑ Bar-Eli, Avi (12 August 2009). "Tamar offshore field promises even more gas than expected". Haaretz. Retrieved 17 October 2012.
- ↑ Scheer, Steven (3 June 2010). "Noble increases Tamar gas reserve estimate 15 pct". Reuters. Retrieved 17 October 2012.
- 1 2 "Tamar Reserves Update". Isramco Negev 2, LP. 1 February 2014. p. 2. Retrieved 2 February 2014.
- ↑ Solomon, Shoshanna; Khan, Sarmad (13 July 2014). "Israel Shares Rise as Gas Field Reserves Are Increased". Bloomberg News. Retrieved 13 July 2014.
- ↑ "Noble Energy Announces Successful Leviathan Appraisal Results and Increases Resource Size" (Press release). Noble Energy. 19 December 2011. Archived from the original on 8 January 2012. Retrieved 28 December 2011.
- ↑ "Significant Discovery Announced at Leviathan-1" (Press release). Delek Group. 29 December 2010. Archived from the original on 21 January 2013. Retrieved 30 December 2010.
- ↑ Barkat, Amiram; Koren, Hillel (1 May 2013). "Leviathan gas reserves raised again". Globes. Retrieved 1 May 2013.
- ↑ https://www.economist.com/news/middle-east-and-africa/21595039-obstacles-still-block-flow-oil-and-gas-eastern-mediterranean-too Israel’s and Palestine’s gas and oil: Too optimistic?
- ↑ US Energy Information Administration, Natural gas proved reserves, 2015.
- ↑ Solomon, Shoshanna; Ackerman, Gwen (30 March 2013). "Israel Begins Gas Production at Tamar Field in Boost to Economy". Bloomberg. Retrieved 30 March 2013.
- ↑ Barkat, Amiram (24 December 2013). "Israel in talks to export gas via Egypt". Globes. Retrieved 18 April 2013.
- ↑ Barkat, Amiram (30 March 2013). עצמאות אנרגטית: החלה הזרמת הגז הטבעי ממאגר "תמר"; צפוי להגיע לישראל תוך 24 שעות [Energy Independence: Gas from Tamar Expected to Arrive in 24 Hours]. Globes (in Hebrew). Retrieved 30 March 2013.
- ↑ "Leviathan partners say all conditions met to supply natgas to Jordan". Reuters. 7 March 2018. Retrieved 10 March 2018.
- ↑ Omari, Raed (8 March 2018). "'Lands for Israel gas pipeline acquired'". The Jordan Times. Retrieved 10 March 2018.
- ↑ "Israel announces major gas deal with Egypt". Deutsche Welle. 19 February 2018. Retrieved 10 March 2018.
- ↑ Zeno, Lior (10 May 2011). "Two Weeks' Postponement in Pelagic's Drilling License Approval". TheMarker. Retrieved 21 May 2011.
- ↑ Barkat, Amiram (19 February 2012). "'Israel's gas reserves worth $130b'". Globes. Retrieved 20 February 2012.
- ↑ Gismatullin, Edward; Ben-David, Calev (2 August 2012). "Israel Finds $240 Billion Gas Hoard Stranded by Politics: Energy". BusinessWeek. Retrieved 3 August 2012.
- ↑ Trilnick, Itai (8 February 2012). "Don't export gas, think tank urges Israeli leaders". Haaretz. Retrieved 17 October 2012.
- ↑ Shemer, Nadav; Udasin, Sharon (19 February 2012). "Cabinet outlines plan for sovereign wealth fund". Jerusalem Post. Retrieved 20 February 2012.
- ↑ Israel’s Natural Gas Bonanza Archived 22 July 2009 at the Wayback Machine.. Energy Tribune. Retrieved on 8 September 2011.
- ↑ Beckwith, Robin (March 2011). "Israel's Gas Bonanza" (PDF). Journal of Petroleum Technology: 46. Retrieved 5 February 2012.
- ↑ Yeshayahou, Koby (12 February 2012). "Dolphin gas field estimate cut by 85%". Globes. Retrieved 26 July 2012.
- ↑ "Israel, Cyprus in underwater electricity cable deal". AFP. 4 March 2012. Retrieved 25 March 2012.
- 1 2 Petrotyranny by John C. Bacher, David Suzuki, published by Dundurn Press Ltd., 2000; reference is at Page 70 Petrotyranny
- ↑ Sandler, Neal (26 March 2008). "At the Zenith of Solar Energy". Bloomberg Businessweek. Retrieved 17 October 2012.
- ↑ Israel Pushes Solar Energy Technology, Linda Gradstein, National Public Radio, 22 October 2007.
- ↑ Looking to the sun, Tom Parry, Canadian Broadcasting Corporation, 15 August 2007.
- 1 2 "Case Study: Dead Sea Works - Sdom, Israel". Water Online. Archived from the original on 9 February 2013. Retrieved 15 October 2012.
- ↑ Azulai, Yuval (13 October 2017). "בלעדי: מנכ"ל התעשייה האווירית מדבר על הכל בראיון סוער" [IAI CEO tells all in exclusive interview] (in Hebrew). Globes. Retrieved 14 October 2017.
- ↑ WebCite query result
- ↑ WebCite query result
- ↑ Jewellery Business - Israel’s 2012 polished diamond exports decline
- ↑ "Diamond Exports". Retrieved 16 January 2013.
- ↑ Scheer, Steven (2 January 2013). "Israel 2012 diamond exports fall, may rebound if no more crises". Reuters.
- ↑ Diamonds.net - Israel's Polished Diamond Exports -22% in 2012
- ↑ Rosenberg, Israel David (27 February 2012). "For arms, Mideast is buyer's, not a seller's, market". Gant Daily. Jerusalem, Israel. The Media Line. Archived from the original on 1 July 2014. Retrieved 6 March 2012.
- ↑ "The SIPRI Top 100 arms-producing and military services companies, 2010". Stockholm International Peace Research Institute. Archived from the original on 24 May 2011. Retrieved 6 March 2012.
- ↑ Top List TIV Tables-SIPRI. Armstrade.sipri.org. Retrieved on 9 May 2012.
- ↑ Israel among top arms exporters and importers - JPost - Defense
- ↑ Thenakedfacts
- ↑ Defense equipment and arms exports from Israel to reach $7 billion in 2012 1101134 - Army Recognition Archived 18 January 2013 at the Wayback Machine.
- ↑ Israel's arms exports increased by 20 percent in 2012 - Israel News | Haaretz Daily Newspaper
- ↑ Israel's arms industry hoping success of Iron Dome will bring it sales - Israel News | Haaretz Daily Newspaper
- ↑ Israel & India: New Allies | Brookings Institution
- ↑ "$10 bn business: How Israel became India's most important partner in arms bazaar". The Times Of India. 23 September 2012.
- ↑ Israel builds up its war robot industry. United Press International. 26 April 2013.
- ↑ "Israel – an unmanned air systems (UAS) super power". Defense Update.
- ↑ Raz-Chaimovich, Michal (27 December 2017). "Record 3.6m tourists visit Israel in 2017". Globes.
- ↑ "Israel Sees Record 3.6 Million Tourists in 2017". Atlanta Jewish Times. 4 January 2018. Archived from the original on 11 January 2018.
- ↑ "Masada tourists' favorite spot in Israel". Ynetnews. Retrieved 8 April 2009.
- ↑ "OEC - Products exported by Israel (2016)". Atlas.media.mit.edu. Retrieved 12 March 2018.
- ↑ "OEC - Products imported by Israel (2016)". Atlas.media.mit.edu. Retrieved 12 March 2018.
- ↑ http://www.cbs.gov.il/reader/newhodaot/hodaa_template.html?hodaa=201809065
- ↑ "MAX - Unsupported Browser Warning". Ustr.gov. Retrieved 28 January 2018.
- ↑ Coren, Ora; Bassok, Moti (6 March 2012). "Asia overtakes U.S. as target market for Israeli exports". Haaretz. Retrieved 6 March 2012.
- ↑ Israeli-Palestinian business arbitration center established
- ↑ Cohen, Ora (9 July 2013). "Israel 'dangerously reliant on handful of exports'". Haaretz. Retrieved 9 July 2013. (Subscription required.)
- ↑ "OEC - Products that Israel exports to the United States (2016)". Atlas.media.mit.edu. Retrieved 28 January 2018.
- ↑ "OEC - Products that Israel exports to Hong Kong (2016)". Atlas.media.mit.edu. Retrieved 28 January 2018.
- ↑ "OEC - Products that Israel exports to the United Kingdom (2016)". Atlas.media.mit.edu. Retrieved 28 January 2018.
- ↑ "OEC - Products that Israel exports to China (2016)". Atlas.media.mit.edu. Retrieved 28 January 2018.
- ↑ "OEC - Products that Israel exports to Belgium-Luxembourg (2015)". Atlas.media.mit.edu. Retrieved 28 January 2018.
- ↑ "OEC - Products that Israel exports to India (2016)". Atlas.media.mit.edu. Retrieved 28 January 2018.
- ↑ "OEC - Products that Israel exports to the Netherlands (2016)". Atlas.media.mit.edu. Retrieved 28 January 2018.
- ↑ "OEC - Products that Israel exports to Germany (2016)". Atlas.media.mit.edu. Retrieved 28 January 2018.
- ↑ "OEC - Products that Israel exports to Switzerland (2016)". Atlas.media.mit.edu. Retrieved 28 January 2018.
- ↑ "OEC - Products that Israel exports to France (2016)". Atlas.media.mit.edu. Retrieved 28 January 2018.
- ↑ "What does Israel import from the United States (2016)". Atlas.media.mit.edu. Retrieved 5 May 2018.
- ↑ "What does Israel import from China (2016)". Atlas.media.mit.edu. Retrieved 5 May 2018.
- ↑ "What does Israel import from Switzerland (2016)". Atlas.media.mit.edu. Retrieved 5 May 2018.
- ↑ "What does Israel import from Germany (2016)". Atlas.media.mit.edu. Retrieved 5 May 2018.
- ↑ "What does Israel import from Belgium-Luxembourg (2015)". Atlas.media.mit.edu. Retrieved 28 January 2018.
- ↑ "What does Israel import from the United Kingdom? (2016)". The Observatory of Economic Complexity. 2017. Retrieved 5 May 2018.
- ↑ "What does Israel import from the Netherlands? (2016)". The Observatory of Economic Complexity. 2017. Retrieved 5 May 2018.
- ↑ "What does Israel import from Italy? (2016)". The Observatory of Economic Complexity. 2017. Retrieved 5 May 2018.
- ↑ http://atlas.media.mit.edu/en/visualize/tree_map/hs92/import/isr/tur/show/2015/
- ↑ "What does Israel import from Japan? (2016)". The Observatory of Economic Complexity. 2017. Retrieved 5 May 2018.
- ↑ "The most innovative country in the world takes top spot again". World Economic Forum. Retrieved 21 January 2017.
- ↑ "Human Development Report 2015" (PDF). United Nations Development Programme - Human Development Reports. Retrieved 21 January 2016.
- ↑ "The 2016 IMD World Competitiveness Scoreboard" (PDF). IMD World Competitiveness Center. 30 May 2016. Retrieved 21 January 2017.
- 1 2 'Israel's economy most durable in face of crises'. Ynet News (20 May 2010). Retrieved on 8 September 2011.
- ↑ U.S. listed Israeli companies. Ishitech.co.il. Retrieved on 8 September 2011.
- 1 2 "Israel". The Heritage Foundation. Retrieved 15 October 2012.
- ↑ IMF Report. Imf.org (29 April 2003). Retrieved on 8 September 2011.
Further reading
- Ben-Porath, Yoram ed. The Israeli Economy: Maturing through Crises. Cambridge, MA: Harvard University Press, 1986.
- Chill, Dan. The Arab Boycott of Israel: Economic Aggression and World Reaction. New York: Praeger, 1976.
- Kanovsky, Eliyahu. The Economy of the Israeli Kibbutz. Cambridge, MA: Harvard University Press, 1966.
- Klein, Michael. A Gemara of the Israel Economy. Cambridge, MA: National Bureau of Economic Research, 2005.
- Michaely, Michael. Foreign Trade Regimes and Economic Development: Israel. New York: National Bureau of Economic Research, 1975.
- Ram, Uri (2008). The Globalization of Israel: McWorld in Tel Aviv, Jihad in Jerusalem. New York: Routledge. ISBN 0-415-95304-9.
- Seliktar, Ofira (2000), "The Changing Political Economy of Israel: From Agricultural Pioneers to the "Silicon Valley" of the Middle East", in Freedman, Robert, Israel’s First Fifty Years, Gainesville, FL: University of Florida Press, pp. 197–218 .
- Senor, Dan and Singer, Saul, Start-up Nation: The Story of Israel's Economic Miracle, Hachette, New York (2009) ISBN 0-446-54146-X
- Rubner, Alex. The Economy of Israel: A Critical Account of the First Ten Years. New York: Frederick A Praeger, 1960.
- Aharoni, Sara; Aharoni, Meir (2005), Industry & Economy in Israel, Israel books .
- Maman, Daniel and Rosenhek, Zeev. The Israeli Central Bank: Political Economy: Global Logics & Local Actors. Routledge, 2011.
- The Global Political Economy of Israel
External links
| Wikimedia Commons has media related to Economy of Israel. |
- Finance Israel (official website), Israel Ministry of Finance, archived from the original on 7 March 2012, retrieved 14 March 2012 .
- "Israel". The World Factbook. Central Intelligence Agency.
- Israel and the IMF, International Monetary Fund
- World Bank Trade Summary Statistics Israel 2012
- Israel, Organisation for Economic Co-operation and Development .
- Israel Economy, The Heritage Foundation .
- Israel Business and Economy at Curlie (based on DMOZ)
- Tariffs applied by Israel as provided by ITC's Market Access Map, an online database of customs tariffs and market requirements
- Investigative Dashboard List of Israel Company Registries
- Hebrew documents about the recession in Israel 1966-1967:
- http://israelidocuments.blogspot.co.il/2016/02/50-1967-1966.html