Economy of Australia
 Sydney's central business district is Australia's largest financial and business services hub. | |
| Currency | Australian dollar (AUD) = 0.72 USD |
|---|---|
| 1 July – 30 June | |
Trade organisations | APEC, G20, OECD, WTO |
| Statistics | |
| GDP | (IMF; 2017)[1] |
| GDP rank | (IMF; 2017)[2][3] |
GDP growth | 0.6% (Q3 2017)[4][5] |
GDP per capita |
|
GDP per capita rank | (IMF; 2017)[6][7] |
GDP by sector | |
| |
| 0.333 (2014)[10] | |
Labour force | 12.7 million (2017)[11] |
Labour force by occupation |
|
| Unemployment | 5.5% (February 2018)[12] |
Average gross salary |
|
Main industries |
|
| 14th (2018)[16] | |
| External | |
| Exports | $190.2 billion (2016)[17] |
Export goods | iron ore, coal, petroleum gases, gold, synthetic corundum, wheat and meslin, bovine meat, wool, meat of sheep or goat[17] |
Main export partners |
|
| Imports | $196.1 billion (2016)[17] |
Import goods | cars, petroleum, automatic data processing equipment, medicaments, other food preparations, cigars, wine, baked goods, alcohol of less than 80% volume[17] |
Main import partners |
|
FDI stock |
|
Gross external debt | US$1.487 trillion (30 June 2017)[19] |
| Public finances | |
| 42.3% of GDP (October 2017)[20] | |
| Revenues | $461 billion (2017 est.) |
| Expenses | $484 billion (2017 est.) |
| Economic aid | donor: ODA, $3.02 billion (2016)[21] |
Foreign reserves | $51.838 billion (Oct 2017)[25] |
The economy of Australia is a large mixed-market economy, with a GDP of A$1.69 trillion as of 2017.[26] Australia is the second-wealthiest nation in terms of wealth per adult, after Switzerland.[27] Australia's total wealth was AUD$8.9 trillion as of June 2016.[28] In 2016, Australia was the 14th-largest national economy by nominal GDP,[2] 20th-largest by PPP-adjusted GDP,[3] and was the 25th-largest goods exporter and 20th-largest goods importer.[29] Australia took the record for the longest run of uninterrupted GDP growth in the developed world with the March 2017 financial quarter, the 103rd quarter and marked 26 years since the country had a technical recession (two consecutive quarters of negative growth).[30]
The Australian economy is dominated by its service sector, comprising 61.1% of the GDP and employing 79.2% of the labour force in 2016.[8] East Asia (including ASEAN and Northeast Asia) is a top export destination, accounting for about 64% of exports in 2016.[31] Australia has the eighth-highest total estimated value of natural resources, valued at US$19.9 trillion in 2016.[32] At the height of the mining boom in 2009–10, the total value-added of the mining industry was 8.4% of GDP.[33] Despite the recent decline in the mining sector, the Australian economy has remained resilient and stable[34][35] and has not experienced a recession since July 1991.[36]
The Australian Securities Exchange in Sydney is the 16th-largest stock exchange in the world in terms of domestic market capitalisation[27] and has the largest interest rate derivatives market in Asia.[37] Some of Australia's large companies include but are not limited to: Wesfarmers, Woolworths, Rio Tinto Group, BHP Billiton, Commonwealth Bank, National Australia Bank, Westpac, ANZ, Macquarie Group, Telstra and Caltex Australia.[38] The currency of Australia and its territories is the Australian dollar which it shares with several Pacific nation states.
Australia is a member of the APEC, G20, OECD and WTO. The country has also entered into free trade agreements with ASEAN, Canada, Chile, China, South Korea, Malaysia, New Zealand, Peru, Japan, Singapore, Thailand and the United States.[39][40][41] The ANZCERTA agreement with New Zealand has greatly increased integration with the economy of New Zealand and in 2011 there was a plan to form an Australasian Single Economic Market by 2015.[42]
History
20th century
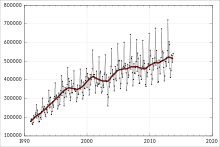
Australia's average GDP growth rate for the period 1901–2000 was 3.4% annually. As opposed to many neighbouring Southeast Asian countries, the process towards independence was relatively peaceful and thus did not have significant negative impact on the economy and standard of living.[43] Growth peaked during the 1920s, followed by the 1950s and the 1980s. By contrast, the late 1910s/early 1920s, the 1930s, the 1970s and early 1990s were marked by financial crises.
Economic liberalisation
From the early 1980s onwards, the Australian economy has undergone intermittent economic liberalisation. In 1983, under prime minister Bob Hawke, but mainly driven by treasurer Paul Keating, the Australian dollar was floated and financial deregulation was undertaken.
Early 1990s recession
The early 1990s recession came swiftly after the Black Monday of October 1987, as a result of a stock collapse of unprecedented size which caused the Dow Jones Industrial Average to fall by 22.6%. This collapse, larger than the stock market crash of 1929, was handled effectively by the global economy and the stock market began to quickly recover. But in North America, the lumbering savings and loans industry was facing decline, which eventually led to a savings and loan crisis which compromised the well-being of millions of US people. The following recession thus impacted the many countries closely linked to the USs, including Australia. Paul Keating, who was prime minister at the time, famously referred to it as "the recession that Australia had to have."[44] During the recession, GDP fell by 1.7%, employment by 3.4% and the unemployment rate rose to 10.8%.[45] However, the recession did assist in reducing long-term inflation rate expectations and Australia has maintained a low inflation environment since the 1990s to the present day.
Mining
Mining has contributed to Australia's high level of economic growth, from the gold rush in the 1840s to the present day. The opportunities for large profits in pastoralism and mining attracted considerable amounts of British capital, while expansion was supported by enormous government outlays for transport, communication, and urban infrastructures, which also depended heavily on British finance. As the economy expanded, large-scale immigration satisfied the growing demand for workers, especially after the end of convict transportation to the eastern mainland in 1840. Australia's mining operations secured continued economic growth and Western Australia itself benefited strongly from mining iron ore and gold from the 1960s and 1970s which fueled the rise of suburbanisation and consumerism in Perth, the capital and most populous city of Western Australia, as well as other regional centres.
Global financial crisis
The Australian government stimulus package ($11.8 billion) helped to prevent a recession.[46]
The World Bank expected Australia's GDP growth rate to be 3.2% in 2011 and 3.8% in 2012.[47] The economy expanded by 0.4% in the fourth quarter of 2011, and expanded by 1.3% in the first quarter of 2012.[48][49] The growth rate was reported to be 4.3% year-on-year.[50]
The International Monetary Fund in April 2012 predicted that Australia would be the best-performing major advanced economy in the world over the next two years; the Australian Government Department of the Treasury anticipated "forecast growth of 3.0% in 2012 and 3.5% in 2013",[51] the National Australia Bank in April 2012 cut its growth forecast for Australia to 2.9% from 3.2%.,[52] and JP Morgan in May 2012 cut its growth forecast to 2.7% in calendar 2012 from a previous forecast of 3.0%, also its forecast for growth in 2013 to 3.0% from 3.3%.[53] Deutsche Bank in August 2012, and Société Générale in October 2012, warned that there is risk of recession in Australia in 2013.[54][55]
While Australia's overall national economy grew, some non-mining states and Australia's non-mining economy experienced a recession.[56][57][58]
Data
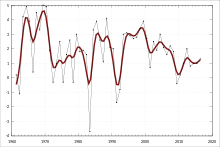
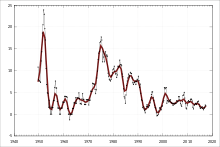
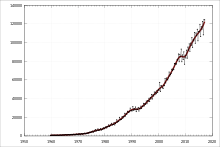
The following table shows the main economic indicators in 1980–2017. Inflation under 2 % is in green.[59]
| Year | GDP (in Bil. US$ PPP) |
GDP per capita (in US$ PPP) |
GDP growth (real) |
Inflation rate (in Percent) |
Unemployment (in Percent) |
Government debt (in % of GDP) |
|---|---|---|---|---|---|---|
| 1980 | 155.1 | 10,480 | 6.1 % | n/a | ||
| 1981 | n/a | |||||
| 1982 | n/a | |||||
| 1983 | n/a | |||||
| 1984 | n/a | |||||
| 1985 | n/a | |||||
| 1986 | n/a | |||||
| 1987 | n/a | |||||
| 1988 | n/a | |||||
| 1989 | 17.1 % | |||||
| 1990 | ||||||
| 1991 | ||||||
| 1992 | ||||||
| 1993 | ||||||
| 1994 | ||||||
| 1995 | ||||||
| 1996 | ||||||
| 1997 | ||||||
| 1998 | ||||||
| 1999 | ||||||
| 2000 | ||||||
| 2001 | ||||||
| 2002 | ||||||
| 2003 | ||||||
| 2004 | ||||||
| 2005 | ||||||
| 2006 | ||||||
| 2007 | ||||||
| 2008 | ||||||
| 2009 | ||||||
| 2010 | ||||||
| 2011 | ||||||
| 2012 | ||||||
| 2013 | ||||||
| 2014 | ||||||
| 2015 | ||||||
| 2016 | ||||||
| 2017 |
Overview
Australia's per-capita GDP is higher than that of the UK, Canada, Germany and France in terms of purchasing power parity. Per Capita GDP (PPP) Australia is ranked 18th in the world (CIA World Factbook 2016). The country was ranked second in the United Nations 2016 Human Development Index and sixth in The Economist worldwide quality-of-life index 2005.[60][61] In 2014, using constant exchange rates, Australia's wealth had grown by 4.4% annually on average since 2007, compared with a 9.2% rate over 2000–2007.[62] Australia's sovereign credit rating is "AAA" for all three major rating agencies, higher than the United States of America.
The emphasis on exporting commodities rather than manufactures underpinned a significant increase in Australia's terms of trade during the rise in commodity prices since 2000. However, due to a colonial heritage a lot of companies operating in Australia are foreign-owned and as a result, Australia has had persistent current account deficits for over 60 years despite periods of positive net merchandise exports; given the net income outlay between Australia and the rest of the world is always negative. The current account deficit totalled AUD$44.5 billion in 2016[63] or 2.6% of GDP.
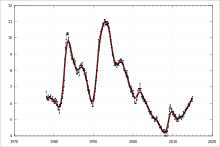
Inflation has typically been between 2–3% and the pre-GFC cash rate typically ranged between 5–7%, however, partly in response to the end of the mining boom the cash rate has recently been steadily falling, dropping from 4.75% in October 2011 to 1.5% in Aug 2016. The service sector of the economy, including tourism, education and financial services, constitutes 69% of GDP.[64] Australian National University in Canberra also provides a probabilistic interest-rate-setting project for the Australian economy, which is compiled by shadow board members from the ANU academic staff.[65]
Rich in natural resources, Australia is a major exporter of agricultural products, particularly wheat and wool, minerals such as iron ore and gold, and energy in the forms of liquified natural gas and coal. Although agriculture and natural resources constitute only 3% and 5% of GDP, respectively, they contribute substantially to Australia's export composition. Australia's largest export markets are Japan, China, South Korea, India and the US.[66]
At the turn of the current century, Australia experienced a significant mining boom. The mining sector's contribution to overall GDP grew from around 4.5% in 1993–94, to almost 8% in 2006–07. The services sector also grew considerably, with property and business services in particular growing from 10% to 14.5% of GDP over the same period, making it the largest single component of GDP (in sectoral terms). This growth has largely been at the expense of the manufacturing sector, which in 2006–07 accounted for around 12% of GDP. A decade earlier, it was the largest sector in the economy, accounting for just over 15% of GDP.[67]
Regional differences
Between 2010 and 2013, much of the economic growth in Australia was attributed to areas of the country where mining- and resource-based industries and services are mostly located. Western Australia and the Northern Territory are the only states that have economic growth.[68][69][70] During 2012 and 2013 Australian Capital Territory, Queensland, Tasmania, South Australia, New South Wales and Victoria experiences recessions at various times.[68][71][72][73][74][75] The Australian economy is characterised as a "two-speed economy".[76][77][78][79][80][81][82] From June 2012 to March 2013 Victoria experienced a recession. In 2012 the Government of Victoria cut 10% of all jobs in the public service.[83][84] The period since has seen these trends reversed with West Australia and the Northern Territory, who are heavily dependent on mining, experience significant downturns in GDP while the eastern states returned to growth, led by strong upturns in NSW and Victoria.[85]
Taxation
Taxation in Australia is levied at the federal, state, and local government levels. The federal government raises revenue from personal income taxes and business taxes. Other taxes include the goods and services tax (General Service Tax), excise and customs duties. The federal government is the main source of income for state governments. As a result of state dependence on federal taxation revenue to meet decentralised expenditure responsibilities, Australia is said to have a vertical fiscal imbalance.
Besides receipts of funds from the federal government, states and territories have their own taxes, in many cases as slightly different rates. State taxes commonly include payroll tax levied on businesses, a poker-machine tax on businesses that offer gambling services, land tax on people and businesses that own land and most significantly, stamp duty on sales of land (in every state) and other items (chattels in some states, unlisted shares in others, and even sales of contracts in some states).
The states effectively lost the ability to raise income tax during the Second World War. In 1942, Canberra invoked its Constitutional taxation power (s. 51 (ii)) and enacted the Income Tax Act and three other statutes to levy a uniform income tax across the country. These acts sought to raise the funds necessary to meet burgeoning wartime expenses and reduce the unequal tax burden between the states by replacing state income taxes with a centralised tax system. The legislation could not expressly prohibit state income taxes (s. 51(ii) does not curtail the power of states to levy taxes) but the federal government's proposal made localised income tax extremely difficult politically. The federal government offered instead compensatory grants authorised by s. 96 of the Constitution for the loss of state income (State Grants (Income Tax Reimbursement) Act 1942).
The states rejected Canberra's regime and challenged the legislation's validity in the First Uniform Tax Case (South Australia v Commonwealth) of 1942. The High Court of Australia held that each of the statutes establishing Commonwealth income tax was a valid use of the s. 51(ii) power, in which Latham CJ noted that the system did not undermine essential state functions and imposed only economic and political pressure upon them.
The Second Uniform Tax Case (Victoria v Commonwealth (1957)) reaffirmed the court's earlier decision and confirmed the power of the federal government's power to make s. 96 grants conditionally (in this case, a grant made on the condition that the recipient state does not levy income tax).
Since the Second Uniform Tax Case, a number of other political and legal decisions have centralised fiscal power with the Commonwealth. In Ha vs. New South Wales (1997), the High Court found that the Business Franchise Licences (Tobacco) Act 1987 (NSW) was invalid because it levied a customs duty, a power exercisable only by the Commonwealth (s.90). This decision effectively invalidated state taxes on cigarettes, alcohol and petrol. Similarly, the imposition of a Commonwealth goods and services tax (GST) in 2000 transferred another revenue base to the Commonwealth.
Consequently, Australia has one of the most pronounced vertical fiscal imbalances in the world: the states and territories collect just 18% of all governmental revenues but are responsible for almost 50% of the spending areas. Furthermore, the centralisation of revenue collection has allowed Canberra to force state policy in areas well beyond the scope of its constitutional powers, by using the grants power (s.96) to mandate the terms on which the states spend money in areas over which it has no power (such as spending on education, health and policing).
Local governments (called councils in Australia) have their own taxes (called rates) to enable them to provide services such as local road repairs, local planning and building management, garbage collection, street cleaning, park maintenance services, libraries, and museums. Councils also rely on state and federal funding to provide infrastructure and services such as roads, bridges, sporting facilities and buildings, aged care, maternal and child health, and childcare.
In 2000, a goods and services tax (GST) was introduced, similar to the European-style VAT.
Employment
According to the Australian Bureau of Statistics (ABS) seasonally adjusted estimates, the unemployment rate decreased 0.1% to 5.5% in September 2017 while the labor force participation rate remained steady at 65.2%. The trend participation rate for 15- to 24-year-olds increased by 0.3 percentage points to 67.7 per cent while unemployment rate for this group declined by less than 0.1% to 12.7%, decreasing by 0.3% over the year.[86] According to the Australian Bureau of statistics, in August 2017, the quarterly underemployment rate decreased by 0.2% to 8.6% while the quarterly underutilisation rate (the unemployed plus the under-employed)[87] decreased by 0.2% to 14.1 per cent.[88]
According to Roy Morgan Research the unemployment rate in August 2017 was 10.2%,[89] while Australian workers who were considered either unemployed or underemployed was estimated to be 19.7% (2.565 million) in the same month.[89] Around 4.247 million were estimated to be in part-time employment.[90]
In 2007 228,621 Newstart unemployment allowance recipients were registered, a total that increased to 646,414 or 5.3% of the total labour force by March 2013.[91] As of March 2017, the number of Newstart recipients stands at 746,681 or 5.8% of the labour force; a proportional increase of 0.5% in four years.[92]
The accuracy of official unemployment figures has been brought into question in the Australian media due to discrepancies between the methods of different research bodies (Roy Morgan versus the ABS), differing definitions of the term 'unemployed' and the ABS' practice of counting under-employed people as "employed".[87][93]
As of May 2017, the Australia labour force were employed in the following industries:[94]
| Rank | Industry | No. of employees ('000s) | % of total |
|---|---|---|---|
| 1 | Health care and social assistance | 1562.6 | 12.9% |
| 2 | Retail trade | 1228.4 | 10.1% |
| 3 | Construction | 1108.3 | 9.1% |
| 4 | Professional, scientific and technical services | 1018.5 | 8.4% |
| 5 | Education and training | 971.8 | 8.0% |
| 6 | Manufacturing | 906.5 | 7.5% |
| 7 | Accommodation and food services | 872.1 | 7.2% |
| 8 | Public administration and safety | 812.0 | 6.7% |
| 9 | Transport, postal and warehousing | 614.0 | 5.1% |
| 10 | Financial and insurance services | 436.1 | 3.6% |
| 11 | Administrative and support services | 411.0 | 3.4% |
| 12 | Wholesale trade | 391.0 | 3.2% |
| 13 | Agriculture, forestry and fishing | 296.7 | 2.4% |
| 14 | Mining | 235.8 | 1.9% |
| 15 | Arts and recreation | 215.7 | 1.8% |
| 16 | Rental, hiring and real estate services | 212.8 | 1.8% |
| 17 | Information media and telecommunications | 211.4 | 1.0% |
| 18 | Utilities | 125.5 | 1.0% |
| Total labour force | 12113.3[95] | 100.0% | |
Employment for newly qualified professionals
According to the Australian Graduate Survey done by Graduate Careers Australia, full-time employment for newly qualified professionals from various occupations (around four months after the completion of their qualifications) experienced some declines between 2012 and 2015.[96] Some examples are:
| Field of Education | 2012[97] | 2013[98] | 2014[99] | 2015[100] | Change 2012–2015 |
|---|---|---|---|---|---|
| Dentistry | 83.6% | 83.3% | 79.6% | 86.7% | +3.1% |
| Computer Science | 74.7% | 70.3% | 67.2% | 67% | -7.7% |
| Architecture | 63.9% | 60.0% | 57.8% | 70.2% | +6.3% |
| Psychology | 63.1% | 56.1% | 52.1% | 55.2% | -7.9% |
| Business studies | 74.5% | 71.8% | 69.7% | 70.8% | -3.7% |
| Electronic/Computer engineering | 79.5% | 80.9% | 74.9% | 78.1% | -1.4% |
| Mechanical engineering | 88.4% | 82.4% | 71.0% | 72.2% | -16.2% |
| Surveying | 93.0% | 86.5% | 83.9% | 90.7% | -2.3% |
| Health other | 73.3% | 69.7% | 70.4% | 69.2% | -4.1% |
| Nursing (initial) | 92.2% | 83.1% | 80.5% | 79% | -13.2% |
| Nursing (post-initial) | 86.1% | 71.4% | 75.8% | 74.9% | -11.2% |
| Medicine | 98.1% | 96.9% | 97.5% | 96.3% | -1.8% |
| Education (initial) | 74.9% | 70.8% | 70% | 71.8% | -3.1% |
| Education (post-initial) | 58.8% | 71.4% | 69.2% | 72.7% | +13.9% |
The Graduate Careers Survey 2014 explained, "However, GCA's Beyond Graduation Survey (BGS) indicates that the middle- and longer-term outlook is very positive, with the employment figures for 2010 graduates growing by 14 percentage points three years later."[99] The Beyond Graduation Survey 2013 included 12,384 responses[101] and the Graduate Careers Survey 2014 survey included 113,263 responses ("59.3 per cent of the almost 191,000 Australian resident graduates who were surveyed responded to the AGS.")[99]
The professional associations of some of these occupations expressed their criticism of the immigration policy in 2014.[102]
States and territories ranked by unemployment rates
| Rank | States | Unemployment rate (September 2017)[86] |
|---|---|---|
| 1 | Victoria | 6.0% |
| 2 | Queensland | 5.9% |
| 3 | South Australia | 5.8% |
| 4 | Tasmania | 5.7% |
| 5 | Western Australia | 5.7% |
| 6 | New South Wales | 4.6% |
| 7 | Australian Capital Territory | 4.4% |
| 8 | Northern Territory | 4.1% |
Note: All data in the table above are seasonally adjusted, except for the Northern Territory and the Australian Capital Territory, which are trend data.[86]
In September 2017, South Australia's seasonally adjusted unemployment rate rose from 5.8% to 5.9% but the trend unemployment rate fell below 6% for the first time in four years to 5.8%.[103]
Sectors

Industry
Mining
In 2014–15 mineral extraction in Australia was valued at 212 billion Australian dollars. Of this, Coal represented 45,869 million, oil and natural gas 40,369 million, Iron ore 69,486 million, Gold ore 13,685 million, and other metals 7,903 million.[104]
Coal is mined primarily in Queensland, New South Wales and Victoria. Fifty-four per cent of the coal mined in Australia is exported, mostly to East Asia. In 2000–01, 258.5 million tonnes of coal was mined, and 193.6 million tonnes exported. Coal provides about 85% of Australia's electricity production.[105] In fiscal year 2008–09, 487 million tonnes of coal was mined, and 261 million tonnes exported.[106] Australia is the world's leading coal exporter.[107]
The Australian mining corporations Rio Tinto Group and BHP are among the largest in the world.
Australia's Argyle mine is the second-largest diamond mine in the world estimated to produce 12.6 million carats in 2014, worth over $500 million. Argyle is known for producing some of the world's most valuable pink and red diamonds.
Manufacturing
The manufacturing industry in Australia has declined from 30% of GDP in the 1960s to 12% of GDP in 2007.[108]
In 2008, four companies mass-produced cars in Australia.[109] Mitsubishi ceased production in March 2008, followed by Ford in 2016, and Holden and Toyota in 2017.[110]
Until trade liberalisation in the mid 1980s, Australia had a large textile industry. This decline continued through the first decade of the 21st century.[111] Since the 1980s, tariffs have steadily been reduced; in early 2010, the tariffs were reduced from 17.5 per cent to 10 per cent on clothing, and 7.5–10% to 5% for footwear and other textiles.[112] As of 2010, most textile manufacturing, even by Australian companies, is performed in Asia.
Agriculture
Agriculture contributes 3% of Australia's GDP at the farm gate and when value-added processing beyond the farm is included this figure rises to 12%.[113] Sixty per cent of farm products are exported. Irrigation is an important and widespread practice for a country where many parts receive low rainfall. Agriculture, Forestry and Fishing was the second-strongest industry from 2013 to 2015, with the number of employees growing from 295,495 in February 2013 to 325,321 in February 2015.[114]
Services
IT-related jobs (such as computer systems design and engineering) are defined as Professional, Scientific and Technical Services by the Department of Education, Employment and Workplace Relations of Australia. IT job creation occurs mostly in the state capital cities of Australia.[115]
Finance
Australia's "big four banks" (National Australia Bank, Commonwealth Bank, Australia and New Zealand Banking Group and Westpac) are among the 'World's 50 Safest Banks' as of April 2012.[116]
Between 1991 and 2013, 36,720 mergers and acquisitions with a total known value of US$2,040 billion with the involvement of Australian firms have been announced.[117] In the year 2013, 1,515 transactions valued at US$78 billion had been announced which was a decrease in terms of numbers (−18%) and value (−11%) compared to 2012. The largest takeover or merger transaction involving Australian companies was the 2007 takeover of the Coles Group by Wesfarmers, totalling A$22 billion.[118]
Tourism
In the financial year 2014/15, tourism represented 3.0% of Australia's GDP contributing A$47.5 billion to the national economy.[119] Domestic tourism is a significant part of the tourism industry, representing 73% of the total direct tourism GDP.[119]
In calendar year 2015, there were 7.4 million visitor arrivals.[120] Tourism employed 580,800 people in Australia in 2014–15, 5% of the workforce.[119] About 43.7% of persons employed in tourism were part-time. Tourism also contributed 8.0% of Australia's total export earnings in 2010–11.[119]
Media
In 2011–12, Australia was ranked 30th out of 179 countries in accordance to press freedom. Media is a strong industry in Australia, with Fairfax Media and News Corporation representing two of the country's largest media companies.
Education
School attendance is compulsory in Australia, from the age of 5 up until approximately 16 (although it varies between each state and territory).[121] Australia also has an adult literacy rate that was estimated to be 99% in 2003.[122]
In the Programme for International Student Assessment, Australia regularly scores among the top five of thirty major developed countries (member countries of the Organisation for Economic Co-operation and Development). In 2018 there were 525,054 international students in Australia, comprising a market of 32,2 billion A$.[123]
Logistics
Infrastructure
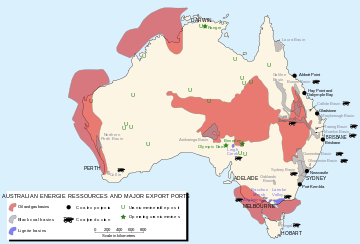
Energy
The Australian economy is dependent on imported crude oil and petroleum products, the economy's petroleum import dependency is around 80%—crude oil + petroleum products.[124]
Trade and economic performance
In the second half of the 20th century, Australian trade shifted away from Europe and North America to Japan and other East Asian markets. Regional franchising businesses, now a $128 billion sector, have been operating co-branded sites overseas for years with new investors coming from Western Australia and Queensland.[125]
In the late 19th century, Australia's economic strength relative to the rest of the world was reflected in its GDP. In 1870, Australia had the highest GDP per capita in the world due to economic growth fuelled by its natural resources. However, as Australia's population grew rapidly over the 20th century, its GDP per capita dropped relative to countries such as the US and Norway. However, the Australian economy has been performing nominally better than other economies of the OECD and has supported economic growth for over 20 consecutive years.[126] According to the Reserve Bank of Australia, Australian per capita GDP growth is higher than that of New Zealand, US, Canada and The Netherlands.[127] The past performance of the Australian economy has been heavily influenced by US, Japanese and Chinese economic growth.
Australian national debt
Australia's net external debt exceeded $1 trillion in April 2017 as a result of Australia's structural current account deficits.[128] Although these deficits have narrowed over the last decade due to an increase in net merchandise trade, this effect has been partly offset by the return of Australian government debt; net federal debt was estimated at $326.0 billion in the 2016–17 federal budget[129] of which 60% is owed to foreigners.[128] The entirety of the debt has been accumulated through ten straight budget deficits as Australia had negative net government debt (i.e. The Australian government had net positive bond holdings) a decade earlier in the 2006–07 fiscal year.[130]
Chinese investment
There is substantial export to China of iron ore, wool and other raw materials, and over 120,000 Chinese students study in Australian schools and universities. China is the largest purchaser of Australian debt.[131] In 2009, offers were made by state-owned Chinese companies to invest $22 billion in Australia's resource extraction industry.[131]
The Signing of the China-Australia Free-Trade Agreement, signed November 2014, has the potential to drastically increase Chinese Investments as agriculture and services become more lenient.
Australia's special investor visa program introduced in 2012 encouraged Chinese investment. The visa program fast-tracks visas and eases the residency requirement for a permanent visa for those ready to invest over five million Australian dollars into state government bonds, specific infrastructure and property investments. Wealthy Chinese interested in retirement houses, top schools and cleaner air, began looking to Australia after Canada started scaling back its investment visa program in 2012 and eliminated its main investor visa program in 2014. In early 2014 it was reported that the Australia's special investor visa was granted to 65 mostly Chinese millionaires who brought over $440 million into the country. By 2017, almost 90% of the more than 1,300 foreigners who used Australia's special investor visa program were from China.[132][133] Australia also has an investor visa program with a required investment of one million Australian dollars but with more restrictions and a lengthier period of time to get a permanent visa.[133]
In 2017, it was reported that Australia is the third-most popular destination for Chinese to invest wealth offshore, with a 7% increase in Chinese private wealth flowing into Australia while interest in the top two investment destinations, Hong Kong and the United States, fell by 18% and 3%, respectively. In 2017 there were 1.6 million high-net-worth Chinese (with at least 10 million Chinese yuan to invest) and 24 per cent of the 3,000 wealthy Chinese surveyed had private investments in Australia. Migration was one of the top three reasons for Chinese investment offshore.[134]
In 2018, in the Lowy Institute poll there had a sharp rise in the proportion of the Australian population who say the Australian government is "allowing too much investment from China".
This number rose from 56 per cent in 2014 to 72 per cent in 2018.[135]
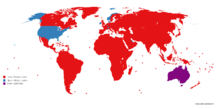
Trade agreements
FTA (Free Trade Agreement) effective[136]
|
FTA (Free Trade Agreement) negotiation
|
Australia's balance of payments
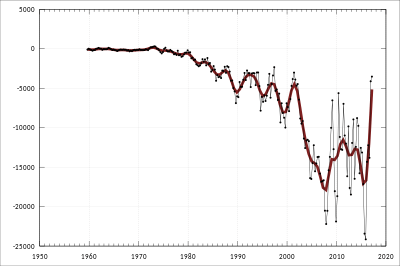
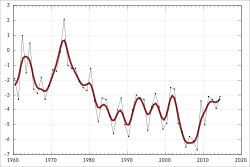
In trade terms, the Australian economy has had persistently large current account deficits (CADs) for more than 50 years.[137][138] One of the factors that undermines balance of payments is Australia's export base, making it highly vulnerable to the volatility in the prices of commodity goods. In addition, due to a colonial heritage a lot of companies operating in Australia are foreign-owned and, as a result, Australia's net income outlay between it and the rest of the world is always negative; this results in persistent current account deficits even when there is a positive export .
Dependent upon commodities, the Australian government endeavoured to redevelop the Australian manufacturing sector. This initiative, also known as microeconomic reform, helped Australian manufacturing to grow from 10.1% in 1983–1984 to 17.8% in 2003–2004.[139]
There are other factors that have contributed to the extremely high current account deficit in Australia such as lack of international competitiveness.[140]
However, as Australia's CAD is almost entirely generated by the private sector, as outlined in Professor John Pitchford's 'Consenting Adults Thesis' in the early 1990s, there is an argument that the CAD is not a significant issue. Historically, Australia has relied on overseas capital to fill the gap between domestic savings and investment, and many of these investment opportunities could not have been pursued if Australia did not have access to foreign savings. This suggests that Australia's apparently low savings level and CAD are not necessarily a significant problem. As long as the investment that is being funded by overseas capital inflow generates sufficient returns to pay for the servicing costs in the future, the increase in foreign liabilities can be viewed as sustainable in the longer term.[141]
Personal wealth
According to the 2011 Credit Suisse Global Wealth report, Australia's wealth per adult had quadrupled over the past decade, and its total wealth was US$6.4 trillion. In the report Australia was the second-wealthiest country in the world behind Switzerland based on average wealth per adult, and had the highest median wealth in the world (US$222,000, nearly four times the amount of each US adult) and a proportion of people with wealth above US$100,000 that was eight times the world average. This was attributed to a resilient Australian dollar, property ownership levels and a strong labour market. Compared to the rest of the world, very few Australians had a net worth of less than US$1,000, which was attributed to relatively low credit card and student loan debt.[142] In 2013, Australia was identified by the Credit Suisse as retaining its 2012 position as the nation with the second-highest average wealth per adult (US$403,000);[143] however, the nation's poverty rate was also reported to have increased from 10.2% in 2000–01 to 11.8% at the time of the 2013 report on global wealth.[144]
Despite the economic slowdown, in the 2014 Credit Suisse Global Wealth Report, Australia continued to have the second-highest average wealth per adult (US$430,800) and the highest median wealth (US$225,400), with a total wealth of $7.2 trillion. The average level of real assets (US$319,700) was the second-highest in the world after Norway and 60% of gross household assets. The report explained that this partly reflects a large endowment of land and natural resources relative to population, and also high urban real estate prices. Only 6% of Australians had a net worth below US$10,000, compared to 29% in the USA and 70% for the world as a whole. The average debt was 20% of gross assets. The proportion of people with wealth above US$100,000 was the highest in the world (eight times the world average). Australia had 3.8% (1,783,000 people) of the top 1% of global wealth holders while having 0.4% of the world's adult population.[62] The wealth share by Australia's top decile was 51.1% in 2000, 50.7% in 2007, and 51.1% in 2014.[145] In 2016, Australia continued to be the second-wealthiest nation in terms of wealth per adult.[27]
In 2017, Australia was the world's top destination for millionaires, beating the United States for the second consecutive year. An estimated 11,000 millionaires moved to Australia in 2016, compared with the 10,000 who moved to the United States. Australia was especially attractive to Chinese millionaires due to its relative proximity, cleaner environment, political and economic stability, and investor visa programs. Also, the primary reason for millionaires leaving China is top schools abroad that will give their children a better education and career connections.[132][133]
Mergers and acquisitions
All in all over 43,150 deals have been completed national, inbound or outbound Australia. This cumulates to an overall value of US$2,554 billion. There was a strong upward trend between 1989 and 2007. In this peak year almost 3,100 deals took place, which is almost 60% more than in 2017, the current low. Australian companies are particularly investing in the fields of metals and minerals (15% of all deals from Australia into foreign countries). Runner-up is the oil and gas industry with only 6.4%.[146]
Here is a list of the top 10 deals with participation of Australian companies as the acquirer or target company:
| Date | Acquirer name | Acquirer industry | Acquirer nation | Target name | Target industry | Target country | Value in US$bn |
| 12 May 2008 | Westpac Banking Corp | Banks | Australia | St George Bank Ltd | Banks | Australia | 17,932.98 |
| 2 July 2007 | Wesfarmers Ltd | Food & beverage retailing | Australia | Coles Group Ltd | Food & beverage retailing | Australia | 15,287.79 |
| 16 October 2006 | Kemble Water Ltd | Other Financials | Australia | Thames Water PLC | Water and waste management | United Kingdom | 14,888.80 |
| 27 October 2006 | Cemex SAB de CV | Construction materials | Mexico | Rinker Group Ltd | Construction materials | Australia | 14,247.73 |
| 20 October 2016 | Investor Group | Other Financials | Australia | Ausgrid Pty Ltd | Power | Australia | 12,499.92 |
| 19 March 2001 | BHP Ltd | Metals & mining | Australia | Billiton PLC | Metals & mining | United Kingdom | 11,510.99 |
| 21 June 2011 | SABMiller Beverage Investments | Other Financials | Australia | Foster's Group Ltd | Food and beverage | Australia | 10,792.76 |
| 6 December 1996 | Investors | Other Financials | Australia | Telstra Corp Ltd | Telecommunications services | Australia | 9,976.59 |
| 2 November 2010 | Shareholders | Other Financials | Australia | Westfield Group-Assets(54) | Non-residential | Australia | 9,482.42 |
Politics
The Liberal/National Coalition (right wing) and the Labor Party (left wing) have formed every Australian Government since Federation, and continue to be the major forces in the predominantly two-party system under which Australia operates.
Poverty
In 2017 ACOSS released a new report revealing that poverty is growing in Australia, with an estimated 2.9 million of people, or 13.3% of all people, living below the internationally accepted poverty line it also estimated that there are 731,000 children in poverty, and 17.5% of children under the age of 15 are in poverty.
Homelessness
There were 105,237 people experiencing homelessness in Australia on census night in 2011. This equated to 1 in 200 Australians,[147] and represented an increase of 17% from the 2006 census, with the rate of homelessness increasing from 45 per 10,000 to 49 per 10,000.
The number of homeless people in Australia jumped by more than 14,000—or 14 per cent—in the five years to 2016, according to census data. The Australian Bureau of Statistics (ABS) said 116,000 people were homeless on census night in 2016, representing 50 homeless people per 10,000.[148]
See also
Notes
- 1 2 "Report for Selected Countries and Subjects (Australia)". World Economic Outlook Database. International Monetary Fund. April 2018. Retrieved 2 December 2017.
- 1 2 "GDP ranking". World Bank Open Data. World Bank. 1 July 2017. Retrieved 6 September 2017.
- 1 2 "GDP ranking, PPP based". World Bank Open Data. World Bank. 1 July 2017. Retrieved 6 September 2017.
- ↑ "5206.0 – Australian National Accounts: National Income, Expenditure and Product, Jun 2017". Australian Bureau of Statistics. 6 September 2017. Retrieved 6 September 2017.
- ↑ "Key Economic Indicators Snapshot". Reserve Bank of Australia. 26 July 2017. Retrieved 14 September 2017.
- ↑ "GDP per capita (current US$)". World Bank Open Data. World Bank. Retrieved 6 September 2017.
- ↑ "GDP per capita, PPP (current international $)". World Bank Open Data. World Bank. Retrieved 6 September 2017.
- 1 2 3 "Australian Industry Report 2016, Chapter 2: Economic Conditions" (PDF). Australian Government: Department of Industry, Innovation and Science. p. 33. Archived from the original (PDF) on 5 September 2017. Retrieved 5 September 2017.
- ↑ "6401.0 – Consumer Price Index, Australia, Sep 2017". Australian Bureau of Statistics. 25 October 2017. Retrieved 25 October 2017.
- ↑ "6523.0 – Household Income and Wealth, Australia, 2013–14". Australian Bureau of Statistics. 28 July 2016. Retrieved 5 September 2017.
- ↑ "Labor force, total". World Bank Open Data. World Bank. Retrieved 5 September 2017.
- ↑ "6202.0 – Labour Force, Australia, Sep 2017". Australian Bureau of Statistics. 19 October 2017. Retrieved 19 October 2017.
- ↑ "6302.0 – Average Weekly Earnings, Australia, May 2017". Australian Bureau of Statistics. 17 August 2017. Retrieved 24 September 2017.
- ↑ "Professional, scientific & technical services industry fact sheet". business.gov.au. Australian Government. 7 June 2017. Retrieved 6 September 2017.
- ↑ Australian Bureau of Statistics (6 September 2017). "Industry Gross Value Added". 5206.0 – Australian National Accounts: National Income, Expenditure and Product (June Quarter 2017) (PDF) (Report). pp. 33, 36. Retrieved 26 October 2017.
- ↑ "Ease of Doing Business in Australia". Doingbusiness.org. The World Bank. Retrieved 24 November 2017.
- 1 2 3 4 5 6 "Trade Profiles: Australia". WTO Statistics Database. World Trade Organization. Retrieved 5 September 2017.
- ↑ "Country Fact Sheet: Australia" (PDF). United Nations Conference on Trade and Development. World Investment Report 2017. Retrieved 25 September 2017.
- ↑ "1344.0 – International Monetary Fund – Special Data Dissemination Standard, 2017". Australian Bureau of Statistics. 20 September 2017. Retrieved 25 September 2017.
- ↑ "General government gross debt". IMF. 2017. Retrieved 11 February 2017.
- ↑ "Development aid rises again in 2016 but flows to poorest countries dip". OECD. 11 April 2017. Retrieved 25 September 2017.
- ↑ Janda, Michael (17 May 2017). "Federal budget 2017: Standard & Poor's reaffirms Australia's AAA credit rating". Australian Broadcasting Corporation. Retrieved 25 September 2017.
- ↑ Uren, David (24 August 2017). "Australia on track to keep AAA rating, says Moody's". The Australian. Archived from the original on 2017-09-23. Retrieved 25 September 2017. ; "Australia's credit rating safe for now: Moody's". In Daily. Australian Associated Press. 9 March 2017. Retrieved 25 September 2017.
- ↑ Fitch Ratings (12 May 2017). "Fitch Affirms Australia at 'AAA'/Stable". Reuters. Retrieved 25 September 2017.
- ↑ "Official Reserve Assets". Reserve Bank of Australia. 7 November 2017. Retrieved 7 November 2017.
- ↑ "1345.0 – Key Economic Indicators, 2017". Australian Bureau of Statistics. Retrieved 6 September 2017.
- 1 2 3 "Australia is a top 20 country". Australian Government: Department of Foreign Affairs and Trade. 18 May 2017. Archived from the original on 6 September 2017. Retrieved 6 September 2017.
- ↑ "Australian household wealth now stands at $8.9 trillion". businessinsider.com.au. Retrieved 26 July 2017.
- ↑ "AUSTRALIA-OCEANIA :: AUSTRALIA". The World Factbook. CIA. 6 September 2017. Retrieved 25 September 2017.
- ↑ Bagshaw, Eryk; Massola, James (7 June 2017). "GDP: Australia grabs record for longest time without a recession". The Sydney Morning Herald. Retrieved 6 September 2017.
- ↑ Thirlwell, Mark (16 June 2017). "Australia's export performance in 2016". Austrade. Retrieved 10 September 2017.
- ↑ Anthony, Craig (12 September 2016). "10 Countries with the Most Natural Resources". Investopedia.
- ↑ "Mining Industry – Economic Contribution". ABS. Retrieved 7 April 2015.
- ↑ "Aussie jumps on surprising economic strength". The Sydney Morning Herald. 2 March 2016. Retrieved 4 March 2016.
- ↑ "Economy puts aside post-mining boom blues". Nine Network News. 2 March 2016. Retrieved 4 March 2016.
- ↑ "Australia goes 25 years with recession". BBC. 1 March 2017. Retrieved 26 July 2017.
- ↑ "Corporate Overview". Australian Securities Exchange. Retrieved 6 September 2017.
- ↑ Hatch, Patrick (7 March 2016). "Australia's 10 Largest Companies". The Sydney Morning Herald. Retrieved 6 September 2017.
- ↑ "International agreements on trade and investment". Austrade. Retrieved 11 September 2011.
- ↑ "Free trade agreements – rules of origin". Australian Customs and Border Protection Services. Retrieved 8 February 2015.
- ↑ http://dfat.gov.au/trade/agreements/not-yet-in-force/pafta/Pages/peru-australia-fta.aspx
- ↑ "Australia New Zealand Closer Economic Agreement (ANZCERTA)". Austrade.gov.au. 1 January 2007. Retrieved 11 September 2011.
- ↑ Baten, Jörg (2016). A History of the Global Economy. From 1500 to the Present. Cambridge University Press. p. 288. ISBN 9781107507180.
- ↑ Paul Keating – Chronology Archived 26 September 2011 at the Wayback Machine. at australianpolitics.com
- ↑ "The real reasons why it was the 1990s recession we had to have". The Age. 2 December 2006. Retrieved 8 January 2014.
- ↑ Junankar, P. (2013). "Australia: The Miracle Economy". IZA Discussion Papers 7505, Institute for the Study of Labor (IZA).
- ↑ "World Bank expects Australian GDP growth of 3.2% in 2011 and 3.8% in 2012 | The Stump". Blogs.crikey.com.au. 13 January 2011. Retrieved 24 July 2012.
- ↑ "Australia's economy expands 0.4% in the fourth-quarter". BBC News. 7 March 2012.
- ↑ "Australia Posts 1.3% GDP; Aussie Dollar Soars". International Business Times. 6 June 2012. Archived from the original on 8 June 2012. Retrieved 24 July 2012.
- ↑ Creighton, Adam (6 June 2012). "GDP growth surges 1.3pc for first quarter". The Australian.
- ↑ "Australian economy to outperform the world: IMF". Special Broadcasting Service. Australian Associated Press. 18 April 2012. Archived from the original on 2012-04-23. Retrieved 24 July 2012.
- ↑ "NAB Cuts Australia's Growth Forecast to 2.9%". International Business Times. 11 April 2012. Archived from the original on 13 April 2012. Retrieved 24 July 2012.
- ↑ "JP Morgan Cuts Australian 2012 GDP Forecast To 2.7% Vs 3.0%". The Wall Street Journal.
- ↑ Glynn, James (21 August 2012). "Deutsche Bank Warns of Australian Recession Risk". The Wall Street Journal.
- ↑ "Dylan Price predicts an Australian recession in 2013". Business Insider.
- ↑ "National economy grows but some non-mining states in recession". The Conversation. Retrieved 22 March 2013.
- ↑ Syvret, Paul (7 April 2012). "Mining punches through recession". Courier Mail. Archived from the original on 16 April 2012.
- ↑ "Non-mining states going backwards". ABC. Retrieved 22 March 2013.
- ↑ "Report for Selected Countries and Subjects". www.imf.org. Retrieved 2018-09-11.
- ↑ "Statistics". hdr. Retrieved 13 May 2014.
- ↑ "Quality of Life" (PDF). The Economist. Retrieved 13 May 2014.
- 1 2 Credit Suisse (1 October 2014). "Global Wealth Report 2014" (PDF). University of Western Ontario. p. 57. Retrieved 6 September 2017.
- ↑ "Balance of Payments and International Investment Position". Retrieved 26 July 2017.
- ↑ http://www.rba.gov.au/snapshots/economy-snapshot/%5Bpermanent+dead+link%5D
- ↑ "CAMA RBA Shadow Board". Retrieved 23 May 2014.
- ↑ "Australian Government, DFAT, Composition of Trade Australia 2008–09" (PDF). Archived from the original (PDF) on 16 September 2012. Retrieved 23 May 2014.
- ↑ "Summary". Archived from the original on 7 September 2008.
- 1 2 "Economy grows but some non-mining states in recession" (PDF). Archived from the original (PDF) on 24 August 2006.
- ↑ Tim Colebatch (8 March 2012). "State close to recession". The Sydney Morning Herald. Retrieved 25 July 2012.
- ↑ Tim Colebatch (24 October 2009). "No place for political stunts in tackling economic crisis". The Sydney Morning Herald. Retrieved 25 July 2012.
- ↑ "David Walsh: MONA economic benefits for Tasmania". Crikey. 8 June 2012. Retrieved 24 July 2012.
- ↑ "South Australia is in recession, Westpac warns". The Advertiser. Adelaide. 4 April 2012. Retrieved 24 July 2012.
- ↑ "Rate cut may save NSW sliding into recession". The Daily Telegraph. Australia. 10 June 2012. Retrieved 24 July 2012.
- ↑ "Victoria in a state of decay". Herald Sun. Australia. 10 March 2012. Archived from the original on 2 July 2012.
- ↑ "State close to recession – National News – National – General". Melbourne Times Weekly. 8 March 2012. Retrieved 24 July 2012.
- ↑ Creighton, Adam (8 June 2012). "Reserve Bank governor says Australia has long had a two-speed economy". The Australian.
- ↑ "HIA bursts Swan's economic bubble". Archived from the original on 1 July 2012. Retrieved 13 May 2014.
- ↑ "Banking made tricky by '10-speed' economy: Clyne". The Sydney Morning Herald. 14 August 2012.
- ↑ Tim Colebatch (24 October 2009). "No place for political stunts in tackling economic crisis". The Age. Melbourne, Australia. Retrieved 24 July 2012.
- ↑ "Flow across Tasman tipped to reverse". Stuff.co.nz. 9 June 2012. Retrieved 24 July 2012.
- ↑ "Warning to drop recession row". Australian Broadcasting Corporation. 7 June 2012. Retrieved 24 July 2012.
- ↑ "Giddings rejects figures". The Mercury – The Voice of Tasmania. 7 June 2012. Retrieved 24 July 2012.
- ↑ "Australia: Victorian premier removed as state slides into recession". WSWS.org. Retrieved 13 May 2014.
- ↑ "Victoria, SA and Tasmania slide into recession". Melbourne Times Weekly. Archived from the original on 10 April 2013. Retrieved 13 May 2014.
- ↑ "Commsec state of the states, 2016" (PDF).
- 1 2 3 "6202.0 – Labour Force, Australia, Sep 2017: LABOUR FORCE COMMENTARY SEPTEMBER 2017". Australian Bureau of Statistics. 19 October 2017. Retrieved 19 October 2017.
- 1 2 Bite, Natasha (18 January 2013). "Under-employed numbers are on the rise too masking unemployment figures". News.com.au.
- ↑ "6202.0 – Labour Force, Australia, Aug 2017: LABOUR FORCE COMMENTARY AUGUST 2017". Australian Bureau of Statistics. 14 September 2017. Archived from the original on 2017-10-11. Retrieved 19 October 2017.
- 1 2 "Roy Morgan Unemployment & Under-employment Estimates (2005–2017)". Roy Morgan Research. Retrieved 19 September 2017.
- ↑ "Roy Morgan Employment Estimates (1999–2017)". Roy Morgan Research. Retrieved 19 September 2017.
- ↑ Patricia Karvelas (13 November 2013). "Call for end to welfare poverty". The Australian. Retrieved 15 November 2013.
- ↑ "DSS Demographics March 2017". data.gov.au. Retrieved 28 July 2017.
- ↑ Michael Janda (14 May 2012). "Doing a job on the employment figures". ABC News – The Drum. Retrieved 15 November 2013.
- ↑ "Labour Force, Australia, Detailed, Quarterly, May 2017". abs.gov.au. 22 June 2017. Retrieved 28 July 2017.
- ↑ The industry categories do not sum to the total labour force as the ABS allocates some Australian employment into "Other Services", which was not included in this table
- ↑ "Australian Graduate Survey". Graduate Careers Australia. Retrieved 26 August 2017. ; "Gradstats". Graduate Careers Australia. Retrieved 26 August 2017.
- ↑ "Gradstats 2012" (PDF). Graduate Careers Australia. December 2012. Retrieved 26 August 2017.
- ↑ "Gradstats 2013" (PDF). Graduate Careers Australia. December 2013. Retrieved 26 August 2017.
- 1 2 3 "Gradstats 2014" (PDF). Graduate Careers Australia. December 2014. Retrieved 26 August 2017.
- ↑ "Gradstats 2015" (PDF). Graduate Careers Australia. December 2015. Retrieved 26 August 2017.
- ↑ "Beyond Graduation 2013" (PDF). Graduate Careers Australia. 2014. Retrieved 29 August 2017.
- ↑ Ross, John (2 April 2014). "Dentists join the growing calls for cap on student uni places". The Australian. Archived from the original on 2017-08-19. Retrieved 29 August 2017.
- ↑ Harmsen, Nick (19 October 2017). "South Australia's unemployment rate falls to its best level since 2013". Australian Broadcasting Corporation. Retrieved 10 November 2017.
- ↑ "ABS – Mining".
- ↑ "The Importance of Coal in the Modern World – Australia". Gladstone Centre for Clean Coal. Archived from the original on 8 February 2007. Retrieved 17 March 2007.
- ↑ "Australia Mineral Statistics 2009– June Quarter" (PDF). Australian Bureau of Agricultural and Resource Economics. Archived from the original (PDF) on 7 July 2011. Retrieved 3 October 2009.
- ↑ International Energy Agency. (31 August 2008) Coal Information 2008. Organisation for Economic Cooperation & Development. ISBN 92-64-04241-5
- ↑ "Australian Manufacturing (PDF)" (PDF). Archived from the original (PDF) on 25 January 2014. Retrieved 20 May 2014.
- ↑ Hassall, David (12 April 2012). "Tomcar – New local vehicle manufacturer". GoAuto. Retrieved 10 February 2014.
- ↑ "Toyota workers out of jobs as car manufacturer closes Altona plant". Australia: ABC News. 6 December 2017. Retrieved 9 October 2017.
- ↑ "Australian manufacturing—structural trends 2001–02 to 2006–07". 24 November 2008. Retrieved 9 July 2014.
- ↑ Peter Anderson (1 January 2010). "ACCI Welcomes textiles and car tariff cuts (ACCI media release 003/10)" (PDF). Retrieved 13 February 2010.
- ↑ "Farm Facts". National Farmers Federation. Retrieved 25 October 2012.
- ↑ finder.com.au's Careers in Australia Report 2015
- ↑ "Employment Research Statistics" (PDF). deewr.gov.au. Retrieved 20 May 2014.
- ↑ "WORLD'S 50 SAFEST BANKS 2012 | Global Finance". Gfmag.com. Retrieved 24 July 2012.
- ↑ "Statistics on Mergers & Acquisitions (M&A) – M&A Courses | Mergers & Acquisitions Courses". Imaa-institute.org. Archived from the original on 6 January 2012. Retrieved 2 January 2014.
- ↑ Carson, Vanda (2 July 2007). "Wesfarmers buys Coles". The Age. Melbourne, Australia. Retrieved 12 June 2011.
- 1 2 3 4 Australian Bureau of Statistics. "Tourism Satellite Account 2014–15:Key Figures".
- ↑ "Visitor Arrivals Data". Tourism Australia. Archived from the original on 5 September 2015. Retrieved 5 July 2015.
- ↑ "Schooling Overview". Australian Government, Department of Education, Employment and Workplace Relations. Archived from the original on 28 March 2011.
- ↑ "Literacy". The World Factbook. Retrieved 10 October 2013.
- ↑ "Australia hosting unprecedented numbers of international students". ABC News. 18 April 2018. Retrieved 18 June 2018.
- ↑ "Oil import dependency Australia". Crude Oil Peak. January 2010. Retrieved 11 June 2011.
- ↑ Blackie, Tony (10 July 2008). "Battle of the Brfukuands". Business Review Weekly. 30 (27). pp. 32–35.
- ↑ "Downwonder: The "lucky country" may not be so for too much longer" @ The Economist – 29 March 2007
- ↑ "Australia in the Global Economy" by Malcolm Edey the Assistant Governor (Economic) – Address to the Australia & Japan Economic Outlook Conference 2007 – Sydney – 16 March 2007
- 1 2 "Australia has $1 trillion foreign debt. Should we be worried?". The Sydney Morning Herald. 8 April 2017. Retrieved 8 August 2017.
- ↑ "Budget Paper No.1 2016–17". budget.gov.au. Retrieved 8 August 2017.
- ↑ "Australian Government is now debt free". Retrieved 8 August 2017.
- 1 2 "Australia Feels Chill as China’s Shadow Grows" article by Michael Wines in The New York Times 2 June 2009
- 1 2 "What you need to know about new Chinese wealth flowing into Australia". Special Broadcasting Service. 18 February 2014. Retrieved 9 August 2017.
- 1 2 3 Frank, Robert (25 February 2017). "For Millionaire Immigrants, a Global Welcome Mat". The New York Times. Retrieved 9 August 2017.
- ↑ Needham, Kirsty (20 June 2017). "China's richest have $30 trillion to spend, and more investing in Australia". The Sydney Morning Herald. Retrieved 9 August 2017.
- ↑ https://www.sbs.com.au/news/australians-are-losing-trust-in-the-us-a-new-poll-shows
- ↑ "Australia's Trade Agreements". Home – Australian Department of Foreign Affairs and Trade. Australian Government. Retrieved 21 July 2016.
- ↑ "The Australian economy: Downwonder The "lucky country" may not be so for too much longer". The Economist. 29 March 2007. Retrieved 11 June 2011.
- ↑ "Future of Australian Economy" by Exon
- ↑ Leading Edge, R: "Australia in the Global Economy", Tim Dixon and John O'Mahomy, page 133.
- ↑ "Fear of Sudden Stops: Lessons from Australia and Chile" (PDF). iadb.org. Archived from the original (PDF) on 18 May 2013. Retrieved 28 May 2012.
- ↑ Tim Dixon & James O'Mahoney, Australia in the Global Economy 2010, Leading Edge Education, Pearson Australia
- ↑ "Australia wealthiest nation in world, according to a new report". 9 Finance. Nine.com.au. 20 October 2011. Archived from the original on 21 July 2012. Retrieved 24 July 2012.
- ↑ "Global Wealth Reaches New All-Time High". The Financialist. Credit Suisse. 9 October 2013. Archived from the original on 2016-07-29. Retrieved 10 October 2013.
- ↑ "Richest nation but poverty increasing". The Australian. AAP. 12 October 2013. Retrieved 12 October 2013.
- ↑ Credit Suisse (1 October 2014). "Global Wealth Report 2014" (PDF). University of Western Ontario. p. 33. Retrieved 6 September 2017.
- ↑ "M&A Statistics by Countries". Institute for Mergers, Acquisitions and Alliances (IMAA). Retrieved 23 February 2018.
- ↑ "2049.0 – Census of Population and Housing: Estimating homelessness, 2011". abs.gov.au.
- ↑ http://www.abc.net.au/news/2018-03-14/homelessness-in-australia-jumps-14pc-over-five-year-period/9547786
References
- Macfarlane, I. J. (1998). "Australian Monetary Policy in the Last Quarter of the Twentieth Century". Reserve Bank of Australia Bulletin, October 1998
- Parham, Dean. (2002). "Microeconomic reforms and the revival in Australia’s growth in productivity and living standards". Assistant Commissioner – Productivity Commission, Canberra Conference of Economists Adelaide, 1 October 2002 (Adobe Acrobat *.PDF document)
Further reading
- Millmow, Alex. A History of Australasian Economic Thought (Routledge, 2017), 250 pp. online review
External links
| History | |
|---|---|
| Currency | |
| State economies | |
| Industries | |
| Taxation | |
| Banking and Finance | |
| Regulatory agencies | |
| Energy | |
| Economic conditions | |
| Unions | |
| Trade agreements | |
| |
| |||||||||||