Economy of Hong Kong
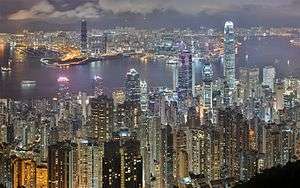 Central and Victoria Harbour of Hong Kong | |
| Currency | Hong Kong dollar (HKD) |
|---|---|
| 1 April – 31 March | |
Trade organisations | APEC and WTO |
| Statistics | |
| GDP |
2,662,637 million HKD (340.1 billion USD, at current market prices, 2017) PPP: $444.6 billion (2016.)PPP per capita rank: 8th GDP PPP per capita rank: 10th with USD $58,552 (2016)[1] |
GDP growth | 3.7% (2017)[2] |
GDP per capita | HK$360,220; 2017 (US$46,000; 2017)[3] |
GDP by sector | agriculture: (0.1%) industry: (9%) services: (90.9%) (2016 est.) |
| 1.7% (2017)[4] | |
Population below poverty line | N/A |
| 53.9 (2017) | |
Labour force | 3.968.7 million (July 2017)[5] |
Labour force by occupation | manufacturing (6.5%), construction (2.1%), wholesale and retail trade, restaurants, and hotels (43.3%), financing, insurance, and real estate (20.7%), transport and communications (7.8%), community and social services (19.5%) |
| Unemployment | 3.1% (July 2017)[6] |
Main industries | textiles, clothing, tourism, banking, shipping, electronics, plastics, toys, watches, clocks |
|
| |
| External | |
| Exports | $460.6 billion (2016) |
Main export partners |
|
| Imports | $514.5 billion (2016) |
Main import partners |
|
FDI stock | 1,034.1 billion HKD (132.7 billion USD, 2016, direct investment inflow) |
| Public finances | |
| HK$1.5 billion (2014) | |
| Revenues | $78.2 billion (2017-2018) |
| Expenses | $60.5 billion (2017) |
| Economic aid | N/A |
|
Standard & Poor's:[10] AAA (Domestic) AAA (Foreign) AAA (T&C Assessment) Outlook: Stable[11] Moody's:[11] Aa1 Outlook: Stable Fitch:[11] AA+ Outlook: Stable | |
Foreign reserves | US$431 billion (December 2017)[12] |
As one of the world's leading international financial centres, Hong Kong's service-oriented economy is characterized by its low taxation, almost free port trade and well established international financial market.[13] Its currency, called the Hong Kong dollar, is legally issued by three major international commercial banks,[14] and pegged to the US dollar.[15][16] Interest rates are determined by the individual banks in Hong Kong to ensure they are market driven.[17] There is no officially recognised central banking system, although the Hong Kong Monetary Authority functions as a financial regulatory authority.[18][19]
According to the Index of Economic Freedom,[20] Hong Kong has had the highest degree of economic freedom in the world since the inception of the index in 1995. Its economy is governed under positive non-interventionism, and is highly dependent on international trade and finance. For this reason it is regarded as among the most favorable places to start a company. In fact, a recent study[21] shows that Hong Kong has come from 998 registered start-ups in 2014 to over 2800 in 2018, with eCommerce (22%), Fintech (12%), Software (12%) and Advertising (11%) companies comprising the majority.[22] The Economic Freedom of the World Index listed Hong Kong as the number one nation, with a score of 8.97, in 2015.[23]
Hong Kong's economic strengths include a sound banking system, virtually no public debt, a strong legal system, ample foreign exchange reserves at around US $408 billion as of mid-2017, rigorous anti-corruption measures and close ties with mainland China.[24] The Hong Kong Stock Exchange is a favourable destination for international firms and firms from mainland China to be listed due to Hong Kong's highly internationalised and modernised financial industry along with its capital market in Asia, its size, regulations and available financial tools, which are comparable to London and New York.[25][26]
Hong Kong's gross domestic product has grown 180 times between 1961 and 1997. Also, the GDP per capita rose by 87 times within the same time frame.[27] Its economy is slightly larger than Israel's or Ireland's[28][29][30] and its GDP per capita at purchasing power parity was the sixth highest globally in 2011, higher than the United States and the Netherlands and slightly lower than Brunei. In 2009, Hong Kong's real economic growth fell by 2.8% as a result of the global financial turmoil.
By the late 20th century, Hong Kong was the seventh largest port in the world and second only to New York and Rotterdam in terms of container throughput. Hong Kong is a full Member of World Trade Organization.[31] The Kwai Chung container complex was the largest in Asia; while Hong Kong shipping owners were second only to those of Greece in terms of total tonnage holdings in the world. The Hong Kong Stock Exchange is the sixth largest in the world, with a market capitalisation of about US$3.732 trillion.
Hong Kong has also had an abundant supply of labour from the regions nearby. A skilled labour force coupled with the adoption of modern British/Western business methods and technology ensured that opportunities for external trade, investment, and recruitment were maximised. Prices and wages in Hong Kong are relatively flexible, depending on the performance and stability of the economy of Hong Kong.[32]
Hong Kong raises revenues from the sale and taxation of land and through attracting international businesses to provide capital for its public finance, due to its low tax policy. According to Healy Consultants, Hong Kong has the most attractive business environment within East Asia, in terms of attracting foreign direct investment (FDI).[33] In 2013, Hong Kong was the third largest recipient of FDI in the world.[34]
Hong Kong ranked fourth on the Tax Justice Network's 2011 Financial Secrecy Index.[35]
The Hong Kong Government was the fourth highest ranked Asian government[36] in the World Economic Forum's Network Readiness Index (NRI), a measure of a government's information and communication technologies in 2016, and ranked 13th globally.[37]
Stock exchange
The Hong Kong Stock Exchange is the sixth largest in the world, with a market capitalisation of about US$3.732 trillion as of mid-2017. In 2006, the value of initial public offerings (IPO) conducted in Hong Kong was second highest in the world after London.[38] In 2009, Hong Kong raised 22 percent of IPO capital, becoming the largest centre of IPOs in the world.[39] The exchange is the world's 10th largest by turnover and third largest in China.[40]
Economic predictions
Since the 1997 handover, Hong Kong's economic future became far more exposed to the challenges of economic globalisation and the direct competition from cities in mainland China. In particular, Shanghai claimed to have a geographical advantage. The Shanghai municipal government dreamt of turning the city into China's main economic centre by as early as 2010. The target is to allow Shanghai to catch up to New York by 2040–2050.[41]
Positive non-interventionism
Hong Kong's economic policy has often been cited by economists such as Milton Friedman and the Cato Institute as an example of laissez-faire capitalism, attributing the city's success to the policy. However, others have argued that the economic strategy is not adequately characterised by the term laissez-faire.[42] They point out that there are still many ways in which the government is involved in the economy, some of which exceed the degree of involvement in other capitalist countries. For example, the government is involved in public works projects, healthcare, education, and social welfare spending. Further, although rates of taxation on personal and corporate income are low by international standards, unlike most other countries Hong Kong's government raises a significant portion of its revenues from land leases and land taxation. All land in Hong Kong is owned by the government and is leased to private developers and users on fixed terms, for fees which are paid to the state treasury. By restricting the sale of land leases, the Hong Kong government keeps the price of land at what some consider as artificially high prices and this allows the government to support public spending with a low tax rate on income and profit.[43]

Economic freedom
Hong Kong has been ranked as the world's freest economy in the Index of Economic Freedom of The Heritage Foundation for 24 consecutive years, since its inception in 1995.[20][44] The index measures restrictions on business, trade, investment, finance, property rights and labour, and considers the impact of corruption, government size and monetary controls in 183 economies. Hong Kong is the only economy to have scored 90 points or above on the 100-point scale, achieved in 2014 and 2018.[45]
Economic data
The following table shows the main economic indicators in 1980–2017. Inflation under 2 % is in green.[46]
| Year | GDP (in Bil. US$ PPP) |
GDP per capita (in US$ PPP) |
GDP growth (real) |
Inflation rate (in Percent) |
Unemployment (in Percent) |
Government debt (in % of GDP) |
|---|---|---|---|---|---|---|
| 1980 | 34.5 | 6,771 | 3.8 % | n/a | ||
| 1981 | n/a | |||||
| 1982 | n/a | |||||
| 1983 | n/a | |||||
| 1984 | n/a | |||||
| 1985 | n/a | |||||
| 1986 | n/a | |||||
| 1987 | n/a | |||||
| 1988 | n/a | |||||
| 1989 | n/a | |||||
| 1990 | n/a | |||||
| 1991 | n/a | |||||
| 1992 | n/a | |||||
| 1993 | n/a | |||||
| 1994 | n/a | |||||
| 1995 | n/a | |||||
| 1996 | n/a | |||||
| 1997 | n/a | |||||
| 1998 | n/a | |||||
| 1999 | n/a | |||||
| 2000 | n/a | |||||
| 2001 | 3.3 % | |||||
| 2002 | ||||||
| 2003 | ||||||
| 2004 | ||||||
| 2005 | ||||||
| 2006 | ||||||
| 2007 | ||||||
| 2008 | ||||||
| 2009 | ||||||
| 2010 | ||||||
| 2011 | ||||||
| 2012 | ||||||
| 2013 | ||||||
| 2014 | ||||||
| 2015 | ||||||
| 2016 | ||||||
| 2017 |
GDP[47]
- GDP (nominal, 2017) – HK$2,669,009 million
- GDP – real growth rate: +3.7% (2017)
- GDP – per capita: HK$360,000 (2017)
- GDP – composition by sector [48] (2015):
- Finance and insurance: 17.6%
- Tourism: 5.0%
- Trade: 22.2%
- Professional Services: 12.4%
- Other Sectors: 42.8%
| Economy of Hong Kong |
|---|
| Identity |
| Resources |
| Companies |
| Other Hong Kong topics |
|
|
| Hong Kong Portal |
Population[47]
Labour[51]
- Labour force: 3.9 million (mid-2017)
- Employed: 3.86 million (96.8%, mid-2017)
- Public administration, social and personal services 510,321
- Finance and insurance 223.221
- Import/export, wholesale and retail trade 808,251
- Transport, storage, postal and courier service 178,1
- Average Work Week: 45 hours
- Unemployed: 128,200 (3.1%, mid-2017)
- Underemployed: 44,200 (1.2%, mid-2017)
FY 2017–18 budget
- Total Revenues: HK$612.4 billion
- Total Expenditures: HK$474.4 billion
- Balance: HK$138 billion
- Government debt HK$11,227.5 million (US$1.44 billion; 30 June 2011)[52]
Trade (selective data for various years)
- Two-way Trade: US$823.9 billion, +23.6% (2010), +11.1% p.a. (1986–2010)
- With mainland China:' $402.6 billion, +24.2% (2010), 48.9% share
- Exports: $459.4 billion, -0.5% (2016)
- To mainland China:' $205.7 billion, +26.5% (2010), 52.7% share
- Re-exports: $381.2 billion, +22.8% (2010), +14.3% p.a. (1986–2010)
- To mainland China:' $247.7 (2016)
- Imports: $513.8 billion, +9.1% (2016),
- From mainland China:' $245.3 billion (2016)
Poverty
It was reported in 2013 that at least 100,000 persons were living in cage homes in the poor districts of Hong Kong.[53]
See also
- Mainland and HK Closer Economic Partnership Arrangement (CEPA)
- Mainland and Macau Closer Economic Partnership Arrangement (CEPA)
- Economy of China
- Economy of East Asia
- Individual Visit Scheme
- Positive non-interventionism
- The Hongs
- Taiwan Miracle
- Poverty Campaign: Speak Up
- Seamen's strike of 1922
- Nylonkong
References
- ↑ "Hong Kong SAR: Gross domestic product per capita, current prices (U.S. dollars)". World Economic Outlook Database, September 2011. International Monetary Fund. Retrieved 22 December 2011.
- ↑ National Income – Publications. Census and Statistics Department, Government of Hong Kong. Retrieved 1 November 2012.
- ↑ National Income – Publications. Census and Statistics Department, Government of Hong Kong. Retrieved 1 November 2012.
- ↑ Census and Statistics Department (June 2014). "Monthly Report on the Consumer Price Index" (PDF).
- ↑ "Statistics on Labour Force, Unemployment and Underemployment". Census and Statistics Department.
- ↑ Labour – Overview Archived 6 April 2011 at the Wayback Machine.. Census and Statistics Department, Government of Hong Kong. Retrieved 1 November 2012.
- ↑ "Ease of Doing Business in Hong Kong SAR, China". Doingbusiness.org. Retrieved 2017-11-24.
- ↑ "Export Partners of Hong Kong". The World Factbook. 2012. Retrieved 23 July 2013.
- ↑ "Import Partners of Hong Kong". The World Factbook. 2011. Retrieved 25 June 2013.
- ↑ "Sovereigns rating list". Standard & Poor's. Retrieved 26 May 2011.
- 1 2 3 Rogers, Simon; Sedghi, Ami (15 April 2011). "How Fitch, Moody's and S&P rate each country's credit rating". The Guardian. London. Retrieved 31 May 2011.
- ↑ "International Reserves and Foreign Currency Liquidity – HONG KONG". International Monetary Fund. 5 May 2011. Retrieved 31 May 2011.
- ↑ "The Profitability of the Banking Sector in Hong Kong" (PDF). Hkma.gov.hk. Retrieved 27 July 2018.
- ↑ LEGAL TENDER NOTES ISSUE ORDINANCE. Legislation.gov.hk (30 June 1997)
- ↑ "Monetary Stability" (PDF). Hkma.gov.hk. Retrieved 27 July 2018.
- ↑ "Triennial Central Bank Survey of Foreign Exchange and Derivatives Market Activity in April 2007" (PDF). Triennial Central Bank Survey 2007. Bank for International Settlements: 7. September 2007. Retrieved 5 September 2010.
- ↑ Gough, Neil; Sang-Hun, Choe (19 July 2012). "Asian Financial Regulators Examine Local Lending Rates". The New York Times.
- ↑ "The Hong Kong Association of Banks". Hkab.org.hk.
- ↑ Chiu, Peter. "Hong Kong's Banking Industry Facing Keen Competition". Revues.org.
- 1 2 "Index of Economic Freedom". Heritage Foundation.
- ↑ WHub (2018). "Hong Kong Start Up Ecosystem Whitepaper".
- ↑ "RootBranded | Mindshift Magazine". RootBranded | Saving Great Ideas from Obscurity. Retrieved 2018-09-17.
- ↑ "Economic Freedom". Fraser Institute. Retrieved 16 September 2018.
- ↑ "Hong Kong". U.S. Department of State.
- ↑ "London retains financial services crown". Financial Times.
- ↑ "The Global Financial Centres Index 13" (PDF). Zyen.com. March 2013. Retrieved 27 July 2018.
- ↑ Rikkie Yeung (2008). Moving Millions: The Commercial Success and Political Controversies of Hong Kong's Railways. Hong Kong University Press. ISBN 978-962-209-963-0.
- ↑ "Nominal GDP list of countries. Data for the year 2010". World Economic Outlook Database, September 2011. International Monetary Fund. Retrieved 22 December 2011.
- ↑ "Gross domestic product (2009)" (PDF). The World Bank: World Development Indicators database. World Bank. 27 September 2010. Retrieved 5 October 2010.
- ↑ Field listing – GDP (official exchange rate), The World Factbook
- ↑ Hong Kong, China – Member information. WTO. Retrieved 1 November 2012.
- ↑ Hong Kong Monetary Authority (30 December 2009). "A Structural Investigation into the Price and Wage Dynamics in Hong Kong" (PDF).
- ↑ "Hong Kong Company Formation". Retrieved 27 August 2013.
- ↑ "UNCTAD World Investment Report". UNCTAD. Retrieved 27 August 2013.
- ↑ "Archived copy". Archived from the original on 28 August 2013. Retrieved 2013-08-12.
- ↑ After Singapore, S. Korea and Taiwan
- ↑ "Global Information Technology Report 2016". World Economic Forum. Retrieved 16 September 2018.
- ↑ Hong Kong surpasses New York in IPOs, International Herald Tribune, 25 December 2006. Retrieved 20 January 2007.
- ↑ "Hong Kong IPOs May Raise Record $48 Billion in 2010, E&Y Says". Bloomberg. 21 December 2009.
- ↑ After Shenzhen and Shanghai
- ↑ Richardson, Harry W. Bae, Chang-Hee C. [2005] (2005) Globalization and Urban Development: Advances in Spatial Science. ISBN 3-540-22362-2
- ↑ Journal of Contemporary China (2000), 9(24) 291–308 "Archived copy" (PDF). Archived from the original (PDF) on 10 September 2008. Retrieved 12 December 2006.
- ↑ Geocities. "Doesn't Hong Kong show the potentials of "free market" capitalism?". Archived from the original on 20 October 2009. Retrieved 9 October 2010.
- ↑ "The World's Freest Economy Is Also Its Least-Affordable Housing Market". Bloomburg BusinessWeek. Retrieved 28 January 2014.
- ↑ "2014 Index of Economic Freedom – Hong Kong". The Heritage Foundation. Retrieved 16 September 2018.
- ↑ "Report for Selected Countries and Subjects". www.imf.org. Retrieved 2018-10-07.
- 1 2 "Gross Domestic Product (GDP)". Census and Statistics Department. 2016-11-11.
- ↑ "The Four Key Industries and Other Selected Industries". Census and Statistics Department. 2016-11-29.
- ↑ Hong Kong Census and Statistics Department
- ↑ "Table 1 : Summary Statistics" (PDF).
- ↑ Quarterly Report on General Household Survey, July to September 2009, Census and Statistics Department
- ↑ Financial results for the three months ended June 30, 2011. Info.gov.hk (30 June 2011). Retrieved 1 November 2012.
- ↑ Clarin.com. "Vivir en jaulas, el drama de miles de chinos pobres en Hong Kong". Clarin.com. Retrieved 30 March 2018.
External links
- Hong Kong Economy
- Hong Kong Government
- Hong Kong Economic Structure, The Economist, 10 January 2007. Retrieved 24 February 2007.
- The Hong Kong Experiment by Milton Friedman
- Economic History of Hong Kong Catherine R. Schenk, University of Glasgow
- Key Economic and Social Indicators – Hong Kong Census and Statistics Department
- Hong Kong Forex Nows (IBTimes HK)
- World Bank Summary Trade Statistics Hong Kong
- Tariffs applied by Hong Kong as provided by ITC's Market Access Map, an online database of customs tariffs and market requirements
| History | |
|---|---|
| Currency | |
| Industry and Business | |
| Government agencies | |
| Employment and Tax | |
| Infrastructure and Transport | |
| Rankings | |
| Finance and Banking |
|
| Agreements | |
| Energy | |
| Other | |
| |
| Nations | |
|---|---|
| Summits | |
| Other | |
| |