Economy of China
 | |
| Currency | Renminbi Yuan (CNY) = 0.145 USD[1] |
|---|---|
| Calendar year | |
Trade organizations | WTO, APEC, G-20 and others |
| Statistics | |
| GDP |
$13.457 trillion (nominal; 2018 est.)[1] $25.313 trillion (PPP; 2018 est.)[1] |
| GDP rank | |
GDP growth | 6.9% (2017)[2] |
GDP per capita |
$9,633 (nominal; 2018 est.)[1] $18,119 (PPP; 2018 est.)[1] |
GDP per capita rank | |
GDP by sector | Agriculture: 8.6%, industry: 39.8%, services: 51.6% (2016)[3] |
|
| |
Population below poverty line |
11.1% live less than $3.10/day[5] (2013; World Bank) |
| 40.0 (2018 est.)[6] | |
|
| |
Labor force | 803.6 million (1st; 2017)[8] |
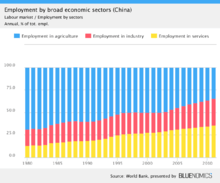
Labor force by occupation | Agriculture: 29.5%, industry: 29.9%, services: 40.6% (2014) |
| Unemployment | 3.97% (Q1 2017)[9] |
Main industries |
|
| 78th (2017)[10] | |
| External | |
| Exports | US$2.26 trillion (2017)[11] |
Export goods |
|
Main export partners |
|
| Imports | US$1.84 trillion (2017)[11] |
Import goods |
|
Main import partners |
|
FDI stock |
|
Gross external debt | $1.42 trillion (31 March 2017)[14] |
| Public finances | |
|
| |
| Revenues | $2.94 trillion (2018 est.) |
| Expenses | $3.46 trillion (2018 est.) |
Foreign reserves |
|
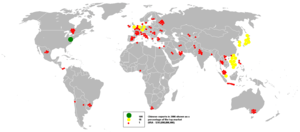
The socialist market economy of the People's Republic of China[20] is the world's second largest economy by nominal GDP[1][21][22] and the world's largest economy by purchasing power parity.[23] Until 2015, China was the world's fastest-growing major economy, with growth rates averaging 10% over 30 years.[24][25] Due to historical and political facts of China's developing economy, China's public sector accounts for a bigger share of the national economy than the burgeoning private sector.[26][27] According to the IMF, on a per capita income basis China ranked 71st by GDP (nominal) and 78th by GDP (PPP) per capita in 2016. The country has an estimated $23 trillion worth of natural resources, 90% of which are coal and rare earth metals.[28] China also has the world's largest total banking sector assets of $39.9 trillion (252 trillion CNY) with $26.54 trillion in total deposits.[29][30]
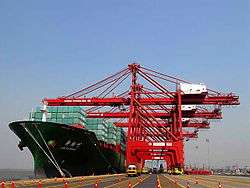
China is the world's largest manufacturing economy and exporter of goods.[31] It is also the world's fastest-growing consumer market and second-largest importer of goods.[32] China is a net importer of services products.[33] It is the largest trading nation in the world and plays a prominent role in international trade[34][35] and has increasingly engaged in trade organizations and treaties in recent years. China became a member of the World Trade Organization in 2001.[36] It also has free trade agreements with several nations, including ASEAN, Australia, New Zealand, Pakistan, South Korea and Switzerland.[37] The provinces in the coastal regions of China[38] tend to be more industrialized while regions in the hinterland are less developed. As China's economic importance has grown, so has attention to the structure and health of the economy.[39][40]
To avoid the long-term socioeconomic cost[41] of environmental pollution in China,[42][43] it has been suggested by Nicholas Stern and Fergus Green of the Grantham Research Institute on Climate Change and the Environment that the economy of China be shifted to more advanced industrial development with high-tech, low carbon emissions with better allocation of national resources to innovation and R&D for sustainable economic growth in order to reduce the impact of China's heavy industry. This is in accord with the planning goals of the central government.[44] Xi Jinping's Chinese Dream is described as achieving the "Two 100s", namely the material goal of China becoming a "moderately well-off society" by 2021, the 100th anniversary of the founding of the Communist Party and the modernization goal of China becoming a fully developed nation by 2049, the 100th anniversary of the founding of the People's Republic.[45] The internationalization of the Chinese economy continues to affect the standardized economic forecast officially launched in China by the Purchasing Managers Index in 2005. As China's economy grows, so does China's Renminbi, which undergoes the process needed for its internationalization.[46] China initiated the founding of the Asian Infrastructure Investment Bank in 2015. The economic development of Shenzhen is dubbed as the next Silicon Valley in the world.[47][48][49][50]
In recent years, government claimed growth numbers have come under increased scrutiny, with both non-chinese financial and economic observes as well as chinese government officials claiming the government has been inflating its economic output. Examples include the provincial government in Liaoning publicly admitting that the government had been overstating GDP by 20% when publishing its economic data from 2011 to 2014. Tianjin's trillion yuan GDP claim for 2016 was in fact a third lower, at 665 billion yuan ($103 billion).[51][52][53] In 2015, one United States-focused financial commentator suggested China's official figures for GDP growth might be double the actual rate.[54] A Wall Street Journal survey of 64 select economists found that 96% of respondents think China's GDP estimates do not "accurately reflect the state of the Chinese economy".[55] However, a paper by the National Bureau of Economic Research in 2017 argued in the opposite direction.[56] Regarding the credibility of official data, China's premier has been quoted as saying the GDP numbers are "man-made" and unreliable and should be used "for reference only".[57]
Regional economies

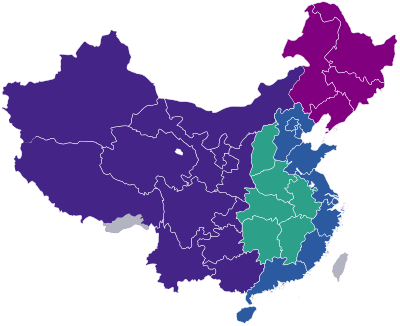
China's unequal transportation system—combined with important differences in the availability of natural and human resources and in industrial infrastructure—has produced significant variations in the regional economies of China.
Economic development has generally been more rapid in coastal provinces than in the interior and there are large disparities in per capita income between regions. The three wealthiest regions are along the southeast coast, centered on the Pearl River Delta; along the east coast, centered on the Lower Yangtze River; and near the Bohai Gulf, in the Beijing–Tianjin region. It is the rapid development of these areas that is expected to have the most significant effect on the Asian regional economy as a whole and Chinese government policy is designed to remove the obstacles to accelerated growth in these wealthier regions.
- See also: List of administrative regions by GDP, List of administrative regions by GDP per capita and List of cities by GDP per capita.
GDP by Administrative Division
There are 33 administrative divisions in China. Below are the top administrative divisions in China ranked by GDP in 2017,[58] as GDP was converted from CNY to USD using a FX rate of 6.7518 CNY/USD.[59]
| PPP: abbreviation of purchasing power parity; Nominal: CNY 6.7518 per U.S. dollar; PPP: CNY 3.5063 per Intl. dollar (based on IMF WEO April 2018)[59] | ||||||||||||
| provinces | GDP (in billions) | GDP per capita | Mid-year population (given*1000) | |||||||||
| Rank | CN¥ | Nominal (US$) | PPP (intl$.) | real growth (%) | Share (%) | Rank | CN¥ | Nominal (US$) | PPP (intl$.) | Share (%) | ||
| Mainland China | 82,712.20 | 12,250.39 | 23,589.60 | 6.9 | 100 | 59,660 | 8,836 | 17,015 | 100 | 1,386,395 | ||
| Guangdong | 1 | 8,987.92 | 1,331.19 | 2,563.36 | 7.5 | 10.87 | 8 | 81,089 | 12,010 | 23,127 | 136 | 109,240 |
| Jiangsu | 2 | 8,590.09 | 1,272.27 | 2,449.90 | 7.2 | 10.39 | 4 | 107,189 | 17,176 | 32,570 | 180 | 79,875 |
| Shandong | 3 | 7,267.82 | 1,076.43 | 2,072.79 | 7.4 | 8.79 | 9 | 72,851 | 10,790 | 20,777 | 122 | 99,470 |
| Zhejiang | 4 | 5,176.83 | 766.73 | 1,476.44 | 7.8 | 6.26 | 5 | 92,057 | 13,634 | 26,255 | 154 | 55,645 |
| Henan | 5 | 4,498.82 | 666.31 | 1,283.07 | 7.8 | 5.44 | 19 | 47,129 | 6,980 | 13,441 | 79 | 95,062 |
| Sichuan | 6 | 3,698.02 | 547.71 | 1,054.68 | 8.1 | 4.47 | 22 | 44,651 | 6,613 | 12,735 | 75 | 82,330 |
| Hubei | 7 | 3,652.30 | 540.94 | 1,041.64 | 7.8 | 4.42 | 11 | 61,971 | 9,179 | 17,674 | 104 | 58,685 |
| Hebei | 8 | 3,596.40 | 532.66 | 1,025.70 | 6.7 | 4.35 | 18 | 47,985 | 7,107 | 13,685 | 80 | 74,475 |
| Hunan | 9 | 3,459.06 | 512.32 | 986.53 | 8.0 | 4.18 | 16 | 50,563 | 7,489 | 14,421 | 85 | 68,025 |
| Fujian | 10 | 3,229.83 | 478.37 | 921.15 | 8.1 | 3.90 | 6 | 82,976 | 12,289 | 23,665 | 139 | 38,565 |
Hong Kong and Macau
In accordance with the One Country, Two Systems policy, the economies of the former British colony of Hong Kong and Portuguese colony of Macau are separate from the rest of China and each other. Both Hong Kong and Macau are free to conduct and engage in economic negotiations with foreign countries, as well as participating as full members in various international economic organizations such as the World Customs Organization, the World Trade Organization and the Asia-Pacific Economic Cooperation forum, often under the names "Hong Kong, China" and "Macau, China".
- See also: Closer Economic Partnership Arrangement (disambiguation) with Hong Kong and Macau.
Development
- See also: List of administrative divisions by Human Development Index (HDI).

The economic reforms implemented in 1979 helped to propel China into the ranks of the world's major economic powers. China shows a great development potential from its remarkable economic growth rate in these years.
To guide economic development, the Chinese central government adopts "five-year plans" that detail its economic priorities and essential policies. The Thirteenth Five-Year Plan (2016–2020) is currently being implemented.
Like Japan and South Korea before it, China has grown steadily, raising the income levels and living standards of its citizens while producing goods that are consumed globally. Between 1978 and 2005, China's per capita GDP grew from $153 to $1,284. Its current account surplus increased more than twelve-fold between 1982 and 2004, from $5.7 billion to $71 billion. During this time, China also became an industrial powerhouse, moving beyond initial successes in low-wage sectors like clothing and footwear to the increasingly sophisticated production of computers, pharmaceuticals, and automobiles.
However, it remains unclear how long the Chinese economy can maintain this trajectory. According to the 11th five-year plan, China needed to sustain an annual growth rate of 8% for the foreseeable future. Only with such levels of growth, the leadership argued, could China continue to develop its industrial prowess, raise its citizen's standard of living, and redress the inequalities that were cropping up across the country. Yet no country had ever before maintained the kind of growth that China was predicting. Moreover, China had to some extent already undergone the easier parts of development. In the 1980s, it had transformed its vast and inefficient agricultural sector, freeing its peasants from the confines of central planning and winning them to the cause of reform. In the 1990s, it had likewise started to restructure its stagnant industrial sector, wooing foreign investors for the first time. These policies had catalysed the country's phenomenal growth. Instead, China had to take what many regarded as the final step toward the market, liberalizing the banking sector and launching the beginnings of a real capital market. According to an article in Journal of the Asia Pacific Economy by Mete Feridun of University of Greenwich Business School and Abdul Jalil from Wuhan University in China, financial development leads to a reduction in the income inequality in China.[61] This process, however, would not be easy. As of 2004, China's state-owned enterprises were still only partially reorganized, and its banks were dealing with the burden of over $205 billion (1.7 trillion RMB) in non-performing loans, monies that had little chance of ever being repaid. The country had a floating exchange rate, and strict controls on both the current and capital accounts.
In mid-2014 China announced it was taking steps to boost the economy, which at the time was running at a rate 7.4% per annum, but was slowing. The measures included plans to build a multi-tier transport network, comprising railways, roads and airports, to create a new economic belt alongside the Yangtze River.[62]
Issues with overclaiming
Chinese provinces and cities have long been suspected of cooking up numbers, with the focus on local government officials, whose performance are often assessed based on how well their respective economies have performed.[63] In recent years, China claimed growth numbers come under scrutiny, with both non-Chinese financial and economic observers as well as Chinese government officials claiming the government has been inflating its economic output.[64][65][66] Instances of overclaiming officially came to light when:
- Binhai New Area in the northern Chinese city of Tianjin. Tianjin's trillion yuan GDP claim for 2016, was in fact a third lower, at 665 billion yuan ($103 billion).
- Inner Mongolia’s government also stated, that about 40% of the region’s reported industrial output in 2016, as well as 26% of reported fiscal revenues, did not exist.
- The provincial government in Liaoning publicly admitted that the government has been cooking the books when publishing it's economic data from 2011 to 2014. Liaoning, frequently called China's rust belt, admitted in 2017, that local GDP numbers from 2011 to 2014 had been inflated artificially by about 20%.
Regarding the credibility, a team of Bloomberg economists wrote "We don't have total confidence in the numbers, and we are surprised by the acceleration in services output given the collapse in the equity market,". A Wall Street Journal survey of 64 select economists found that 96% of respondents think China's GDP estimates don't "accurately reflect the state of the Chinese economy."[67] According to some analysts, chinese officials likely "overstate GDP by about 2 to 3 percentage points,".[68] China's own premier has previously said he's far from confident in the country's GDP estimates, calling them "man-made" and unreliable, according to a leaked document from 2007 obtained by WikiLeaks. He said government data releases, especially the GDP numbers, should be used "for reference only."[69]
Analyst Gary Shilling suggests that China's official figures are off by as much as 50%; he estimates an actual growth rate of 3.5% rather than 7%. Other analysts like Wilbur Ross and Donald Straszheim agree with this assessment, and estimate a growth rate at around 4% or less. Donald Straszheim even went as far to say that growth rates in what he describes as old China are as low as 0%, while explaining that the "new" China of services and consumer spending is tough to measure in the absence of robust data from the private sector.[70]
Regional development
 | ||
| The East Coast (w/ existing development programmes) | ||
| "Rise of Central China" | ||
| "Revitalize Northeast China" | ||
| "China Western Development" | ||
These strategies are aimed at the relatively poorer regions in China in an attempt to prevent widening inequalities:
- China Western Development, designed to increase the economic situation of the western provinces through capital investment and development of natural resources.
- Revitalize Northeast China, to rejuvenate the industrial bases in Northeast China. It covers the three provinces of Heilongjiang, Jilin, and Liaoning, as well as the five eastern prefectures of Inner Mongolia.
- Rise of Central China Plan, to accelerate the development of its central regions. It covers six provinces: Shanxi, Henan, Anhui, Hubei, Hunan, and Jiangxi.
- Third Front, focused on the southwestern provinces.
Foreign investment abroad:
- Go Global, to encourage its enterprises to invest overseas.
Key national projects
The "West-to-East Electricity Transmission", the "West-to-East Gas Transmission", and the "South–North Water Transfer Project" are the government's three key strategic projects, aimed at realigning overall of 12 billion cu m per year. Construction of the "South-to-North Water Diversion" project was officially launched on 27 December 2002 and completion of Phase I is scheduled for 2010; this will relieve serious water shortfall in northern China and realize a rational distribution of the water resources of the Yangtze, Yellow, Huaihe, and Haihe river valleys.
Macroeconomic trends
In January 1985, the State Council of China approved to establish a SNA (System of National Accounting), use the gross domestic product (GDP) to measure the national economy. China started the study of theoretical foundation, guiding, and accounting model etc., for establishing a new system of national economic accounting. In 1986, as the first citizen of the People's Republic of China to receive a Ph.D. in economics from an overseas country, Dr. Fengbo Zhang headed Chinese Macroeconomic Research – the key research project of the seventh Five-Year Plan of China, as well as completing and publishing the China GDP data by China's own research. The summary of the above has been included in the book Chinese Macroeconomic Structure and Policy (1988) Editor: Fengbo Zhang, collectively authored by the Research Center of the State Council of China. This is the first GDP data published by China. The State Council of China issued "The notice regarding implementation of System of National Accounting" in August 1992, the SNA system officially is introduced to China, replaced Soviet Union's MPS system, Western economic indicator GDP became China's most important economic indicator (WikiChina: China GDP, The First China GDP).
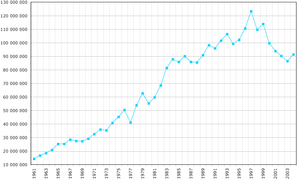
The table below shows the trend of the GDP of China at market prices estimated by the International Monetary Fund (IMF) with figures in millions (Chinese yuan).[71][72] See also.[73] For purchasing power parity comparisons, the US dollar is exchanged at 2.05 CNY only.
| China's Historical GDP for 1952 –present[74](SNA2008)[75] (purchasing power parity of Chinese Yuan, as Int'l.dollar based on IMF WEO April 2018[76]) | |||||||||||
| year | GDP | GDP per capita (GDPPC) based on mid-year population |
Reference index | ||||||||
| GDP in billions | real growth (%) |
GDPPC | real growth (%) |
Mid-year population in thousands |
exchange rate 1 foreign currency to CNY | ||||||
| CNY | USD | PPP (Int'l$.) |
CNY | USD | PPP (Int'l$.) |
USD 1 | Int'l$. 1 (PPP) | ||||
| p2017 | 82,712.20 | 12,250.39 | 23,589.60 | 6.9 | 59,660 | 8,836 | 17,015 | 6.3 | 1,386,395 | 6.7518 | 3.5063 |
| r2016 | 74,358.50 | 11,194.69 | 21,231.94 | 6.7 | 53,974 | 8,126 | 15,411 | 6.1 | 1,378,665 | 6.6423 | 3.5022 |
| r2015 | 68,905.21 | 11,063.07 | 19,414.84 | 6.9 | 50,251 | 8,068 | 14,159 | 6.4 | 1,371,220 | 6.2284 | 3.5491 |
| r2014 | 64,397.40 | 10,483.40 | 18,138.58 | 7.3 | 47,203 | 7,684 | 13,295 | 6.8 | 1,364,270 | 6.1428 | 3.5503 |
| 2013 | 59,524.44 | 9,611.26 | 16,641.35 | 7.8 | 43,852 | 7,081 | 12,260 | 7.3 | 1,357,380 | 6.1932 | 3.5769 |
| 2012 | 54,036.74 | 8,560.28 | 15,218.19 | 7.9 | 40,007 | 6,338 | 11,267 | 7.4 | 1,350,695 | 6.3125 | 3.5508 |
| 2011 | 48,930.06 | 7,575.72 | 13,958.08 | 9.5 | 36,403 | 5,636 | 10,385 | 9.0 | 1,344,130 | 6.4588 | 3.5055 |
| 2010 | 41,303.03 | 6,101.34 | 12,476.00 | 10.6 | 30,876 | 4,561 | 9,326 | 10.1 | 1,337,705 | 6.7695 | 3.3106 |
| 2005 | 18,731.89 | 2,286.69 | 6,551.90 | 11.4 | 14,368 | 1,754 | 5,026 | 10.7 | 1,303,720 | 8.1917 | 2.8590 |
| 2000 | 10,028.01 | 1,211.35 | 3,687.72 | 8.5 | 7,942 | 959 | 2,921 | 7.6 | 1,262,645 | 8.2784 | 2.7193 |
| 1990 | 1,887.29 | 394.57 | 1,108.48 | 3.9 | 1,663 | 348 | 977 | 2.4 | 1,135,185 | 4.7832 | 1.7026 |
| 1980 | 458.76 | 306.17 | 306.76 | 7.8 | 468 | 312 | 313 | 6.5 | 981,235 | 1.4984 | 1.4955 |
| 1970 | 227.97 | 92.60 | 19.3 | 279 | 113 | 16.1 | 818,320 | 2.4618 | |||
| 1960 | 147.01 | 59.72 | 8.0 | 220 | 90 | -0.2 | 667,070 | 2.4618 | |||
| 1952 | 67.91 | 30.55 | 119 | 54 | 568,910 | 2.2227 | |||||
The following table shows important economic indicators in 1980–2017.[77]
| Year | Total Investment (in % of GDP) |
Inflation rate (in Percent) |
Unemployment (in Percent) |
Budget balance (in % of GDP) |
Government debt (in % of GDP) |
Current account (in % of GDP) |
|---|---|---|---|---|---|---|
| 1980 | 35.5 % | n/a | 4.9 % | n/a | n/a | n/a |
| 1981 | 33.5 % | 2.5 % | 3.8 % | n/a | n/a | n/a |
| 1982 | 32.4 % | 2.0 % | 3.2 % | 0.2 % | n/a | n/a |
| 1983 | 32.4 % | 2.0 % | 2.3 % | 0.0 % | n/a | n/a |
| 1984 | 34.9 % | 2.7 % | 1.9 % | 0.1 % | n/a | n/a |
| 1985 | 39.5 % | 9.3 % | 1.8 % | 0.9 % | n/a | n/a |
| 1986 | 38.2 % | 6.5 % | 2.0 % | −0.3 % | n/a | n/a |
| 1987 | 37.8 % | 7.3 % | 2.0 % | −0.7 % | n/a | n/a |
| 1988 | 39.5 % | 18.8 % | 2.0 % | −1.0 % | n/a | n/a |
| 1989 | 37.5 % | 18.0 % | 2.6 % | −0.9 % | n/a | n/a |
| 1990 | 34.4 % | 3.1 % | 2.5 % | −0.7 % | n/a | n/a |
| 1991 | 35.7 % | 3.4 % | 2.3 % | −1.0 % | n/a | n/a |
| 1992 | 39.6 % | 6.4 % | 2.3 % | −1.2 % | n/a | n/a |
| 1993 | 44.0 % | 14.7 % | 2.6 % | −0.9 % | n/a | n/a |
| 1994 | 40.8 % | 24.1 % | 2.8 % | −1.7 % | n/a | n/a |
| 1995 | 39.6 % | 17.1 % | 2.9 % | −0.9 % | 21.4 % | n/a |
| 1996 | 38.2 % | 8.3 % | 3.0 % | −0.7 % | 21.3 % | n/a |
| 1997 | 36.2 % | 2.8 % | 3.1 % | −0.7 % | 20.4 % | 3.8 % |
| 1998 | 35.6 % | −0.8 % | 3.1 % | −1.1 % | 20.5 % | 3.0 % |
| 1999 | 34.9 % | −1.4 % | 3.1 % | −2.3 % | 21.7 % | 1.9 % |
| 2000 | 34.3 % | 0.4 % | 3.1 % | −2.8 % | 22.8 % | 1.7 % |
| 2001 | 36.3 % | 0.7 % | 3.6 % | −2.6 % | 24.4 % | 1.3 % |
| 2002 | 36.9 % | −0.8 % | 4.0 % | −2.9 % | 25.7 % | 2.4 % |
| 2003 | 40.4 % | 1.2 % | 4.3 % | −2.4 % | 26.6 % | 2.6 % |
| 2004 | 42.7 % | 3.9 % | 4.2 % | −1.5 % | 26.2 % | 3.5 % |
| 2005 | 41.0 % | 1.8 % | 4.2 % | −1.4 % | 26.1 % | 5.7 % |
| 2006 | 40.6 % | 1.5 % | 4.1 % | −1.1 % | 25.4 % | 8.4 % |
| 2007 | 41.2 % | 4.8 % | 4.0 % | 0.1 % | 29.0 % | 9.9 % |
| 2008 | 43.2 % | 5.9 % | 4.0 % | 0.0 % | 27.0 % | 9.1 % |
| 2009 | 46.3 % | −0.7 % | 4.3 % | −1.5 % | 34.3 % | 4.8 % |
| 2010 | 47.9 % | 3.3 % | 4.1 % | −0.4 % | 33.7 % | 3.9 % |
| 2011 | 48.0 % | 5.4 % | 4.1 % | −0.1 % | 33.6 % | 1.8 % |
| 2012 | 47.2 % | 2.6 % | 4.1 % | −0.3 % | 34.3 % | 2.5 % |
| 2013 | 47.3 % | 2.6 % | 4.1 % | −0.8 % | 37.0 % | 1.5 % |
| 2014 | 46.8 % | 2.0 % | 4.1 % | −0.8 % | 39.9 % | 2.2 % |
| 2015 | 44.7 % | 1.4 % | 4.1 % | −2.8 % | 41.1 % | 2.7 % |
| 2016 | 44.1 % | 2.0 % | 4.0 % | −3.7 % | 44.3 % | 1.8 % |
| 2017 | 44.4 % | 1.6 % | 3.9 % | −3.9 % | 47.8 % | 1.4 % |
Systemic issues and environment
Over the years, large subsidies were built into the price structure of certain commodities and these subsidies grew substantially in the late 1970s and 1980s.[78]
By 2010, rapidly rising wages and a general increase in the standard of living had put increased energy use on a collision course with the need to reduce carbon emissions in order to control global warming. There were diligent efforts to increase energy efficiency and increase use of renewable sources; over 1,000 inefficient power plants had been closed, but projections continued to show a dramatic rise in carbon emissions from burning fossil fuels.[79]
National debt
The International Monetary Fund, the Federal Reserve Bank of St. Louis[80] and other sources, such as the Article IV Consultation Reports,[81] state that, at the end of 2014, the "general government gross debt"-to-GDP ratio for China was 41.44 percent.[82] With China's 2014 GDP being US$ 10,356.508 billion,[82][83] this makes the government debt of China approximately US$ 4.3 trillion.
By the mid-2010s, many analysts have expressed concern over the overall "size" of the Chinese government debt.[84][85][86][87]
A 2015 International Monetary Fund report concluded that China's public debt is relatively low "and on a stable path in all standard stress tests except for the scenario with contingent liability shocks", such as "a large-scale bank recapitalization or financial system bailout to deal, for example, with a potential rise in NPLs from deleveraging".[88]
"Shadow banking" has risen in China, posing risks to the financial system.[89][90]
Chinese authorities have dismissed analysts' worries, insisting "the country still has room to increase government debt."[91] Former Fed Chairman Ben Bernanke, earlier in 2016, commented that "the ... debt pile facing China [is] an 'internal' problem, given the majority of the borrowings was issued in local currency.[92] Many economists have expressed the same views as Bernanke.[93]
Regulatory environment and tax system
Though China's economy has expanded rapidly, its regulatory environment has not kept pace. Since Deng Xiaoping's open market reforms, the growth of new businesses has outpaced the government's ability to regulate them. This has created a situation where businesses, faced with mounting competition and poor oversight, take drastic measures to increase profit margins, often at the expense of consumer safety. This issue became more prominent in 2007, with a number of restrictions being placed on problematic Chinese exports by the United States.[94]
From the 1950s to the 1980s, the central government's revenues derived chiefly from the profits of the state enterprises, which were remitted to the state. Some government revenues also came from taxes, of which the most important was the general industrial and commercial tax.
The trend, however, has been for remitted profits of the state enterprises to be replaced with taxes on those profits. Initially, this tax system was adjusted so as to allow for differences in the market capitalization and pricing situations of various firms, but more-uniform tax schedules were introduced in the early 1990s. In addition, personal income and value-added taxes were implemented at that time.
Inflation
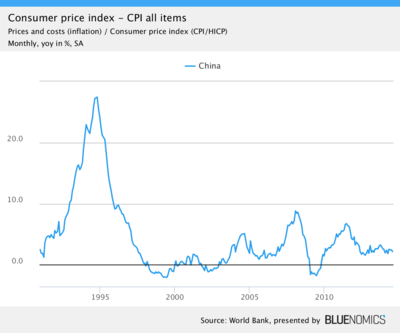
During the winter of 2007–2008, inflation ran about 7% on an annual basis, rising to 8.7% in statistics for February 2008, released in March 2008.[95][96][97]
Shortages of gasoline and diesel fuel developed in the fall of 2007 due to reluctance of refineries to produce fuel at low prices set by the state. These prices were slightly increased in November 2007 with fuel selling for $2.65 a gallon, still slightly below world prices. Price controls were in effect on numerous basic products and services, but were ineffective with food, prices of which were rising at an annual rate of 18.2% in November 2007.[98][99] The problem of inflation has caused concern at the highest levels of the Chinese government. On 9 January 2008, the government of China issued the following statement on its official website: "The Chinese government decided on Wednesday to take further measures to stabilize market prices and increase the severity of punishments for those guilty of driving up prices through hoarding or cheating."[100][101]
Pork is an important part of the Chinese economy with a per capita consumption of a fifth of a pound per day. The worldwide rise in the price of animal feed associated with increased production of ethanol from corn resulted in steep rises in pork prices in China in 2007. Increased cost of production interacted badly with increased demand resulting from rapidly rising wages. The state responded by subsidizing pork prices for students and the urban poor and called for increased production. Release of pork from the nation's strategic pork reserve was considered.[102]
By January 2008, the inflation rate rose to 7.1%, which BBC News described as the highest inflation rate since 1997, due to the winter storms that month.[103] China's inflation rate jumped to a new decade high of 8.7 percent in February 2008 after severe winter storms disrupted the economy and worsened food shortages, the government said 11 March 2008.[104] Throughout the summer and fall, however, inflation fell again to a low of 6.6% in October 2008.[105]
By November 2010, the inflation rate rose up to 5.1%, driven by an 11.7% increase in food prices year on year. According to the bureau, industrial output went up 13.3 percent. As supplies have run short, prices for fuel and other commodities have risen.[106]
Investment cycles
Chinese investment has always been highly cyclical.[107] Ever since the 1958 Great Leap Forward, growth in fixed capital formation has typically peaked about every five years. Recent peaks occurred in 1978, 1984, 1988, 1993, 2003 and 2009. The corresponding troughs were in 1981, 1986, 1989, 1997 and 2005.
In China, the majority of investment is carried out by entities that are at least partially state-owned. Most of these are under the control of local governments. Thus booms are primarily the result of perverse incentives at the local-government level.[108] Unlike entrepreneurs in a free-enterprise economy, Chinese local officials are motivated primarily by political considerations. As their performance evaluations are based, to a large extent, on GDP growth within their jurisdictions, they have a strong incentive to promote large-scale investment projects.[109][110] They also don’t face any real bankruptcy risk. When localities get into trouble, they are invariably bailed out by state-owned banks. Under these circumstances, overinvestment is inevitable.
A typical cycle begins with a relaxation of central government credit and industrial policy. This allows local governments to push investment aggressively, both through state-sector entities they control directly and by offering investment-promotion incentives to private investors and enterprises outside their jurisdictions.[111] The resulting boom puts upward pressure on prices and may also result in shortages of key inputs such as coal and electricity (as was the case in 2003).[112] Once inflation has risen to a level at which it begins to threaten social stability, the central government will intervene by tightening enforcement of industrial and credit policy. Projects that went ahead without required approvals will be halted. Bank lending to particular types of investors will be restricted. Credit then becomes tight and investment growth begins to decline.[113]
Eventually such centrally-imposed busts alleviate shortages and bring inflation down to acceptable levels. At that point, the central government yields to local-government demands for looser policy and the cycle begins again.
Financial and banking system
Most of China's financial institutions are state owned and governed.[114] The chief instruments of financial and fiscal control are the People's Bank of China (PBC) and the Ministry of Finance, both under the authority of the State Council. The People's Bank of China replaced the Central Bank of China in 1950 and gradually took over private banks. It fulfills many of the functions of other central and commercial banks. It issues the currency, controls circulation, and plays an important role in disbursing budgetary expenditures. Additionally, it administers the accounts, payments, and receipts of government organizations and other bodies, which enables it to exert thorough supervision over their financial and general performances in consideration to the government's economic plans. The PBC is also responsible for international trade and other overseas transactions. Remittances by overseas Chinese are managed by the Bank of China (BOC), which has a number of branch offices in several countries.
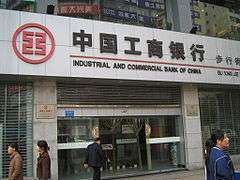
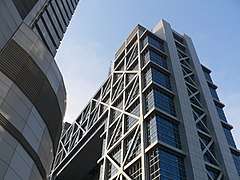
Other financial institutions that are crucial, include the China Development Bank (CDB), which funds economic development and directs foreign investment; the Agricultural Bank of China (ABC), which provides for the agricultural sector; the China Construction Bank (CCB), which is responsible for capitalizing a portion of overall investment and for providing capital funds for certain industrial and construction enterprises; and the Industrial and Commercial Bank of China (ICBC), which conducts ordinary commercial transactions and acts as a savings bank for the public.
China's economic reforms greatly increased the economic role of the banking system. In theory any enterprises or individuals can go to the banks to obtain loans outside the state plan, in practice 75% of state bank loans go to State Owned Enterprises. (SOEs)[115] Even though nearly all investment capital was previously provided on a grant basis according to the state plan, policy has since the start of the reform shifted to a loan basis through the various state-directed financial institutions. It is estimated that, as of 2011, 14 trillion Yuan in loans were outstanding to local governments. Much of that total is believed by outside observers to be nonperforming.[116] Increasing amounts of funds are made available through the banks for economic and commercial purposes. Foreign sources of capital have also increased. China has received loans from the World Bank and several United Nations programs, as well as from countries (particularly Japan) and, to a lesser extent, commercial banks. Hong Kong has been a major conduit of this investment, as well as a source itself. On 23 February 2012, the PBC evinced its inclination to liberalise its capital markets when it circulated a telling ten-year timetable.[117] Following on the heels of this development, Shenzhen banks were able to launch cross-border yuan remittances for individuals, a significant shift in the PBC's capital control strictures since Chinese nationals had been previously barred from transferring their yuan to overseas account.[118]
With two stock exchanges (Shanghai Stock Exchange and Shenzhen Stock Exchange), mainland China's stock market had a market value of $4.48 trillion as of November 2014, which makes it the second largest stock market in the world.[119]
In August 2013, creation of an as yet unnamed high-level body to gather and analyze financial information and trends was announced by the central government. The central bank would participate as would people from other organizations engaged in financial matters. It would not have direct regulatory authority, but would attempt to function at the highest professional level in order to provide appropriate guidance to regulators with respect to matters such as shadow banking that are potential sources of instability.[120] An article published in International Review of Economics & Finance in 2010 by Mete Feridun (University of Greenwich Business School) and his colleagues provide empirical evidence that financial development fosters economic growth in China.[121]
Stock markets
- See 2015 Chinese stock market crash for current events
As of 2014 and the first quarter of 2015 the financial industry had been providing about 1.5% of China's 7% annual growth rate.[123]
Despite slowing of the economy, as of June 2015 the Chinese stock index, the CSI 300 Index, which is based on 300 stocks traded in the Shanghai and Shenzhen stock exchanges, had risen nearly 150% over the past 12 months. In an effort to forestall damage from collapse of a possible economic bubble fueled by margin trading the central government raised requirements for margin lending. Economic damage from a crash in 2007-2008 was limited due to margin lending being highly restricted.[124] In early July, after a fall in the markets of nearly 30% from their 12 June highs, there were efforts by blue-chip, often state-owned, firms, the Chinese securities industry, and the central government to stabilize the market by buying back stock and increasing purchases of the stock of established firms; however, much of the volatility has been in smaller, less-established firms that had been heavily invested in by unsophisticated, often working class, investors who had purchased stock based solely on its rapid increase in valuation.[125] 80% of Chinese stocks are owned by individual investors, many novices.[126] As of 10 July 2015 efforts by the China Securities Finance Corporation, CFS, a firm created by China's commodities and stock exchanges to finance trades,[127] had apparently stabilized the market.[128][129] Major Chinese securities firms were required by the China Securities Regulatory Commission to buy, and hold, a substantial amount of securities affected by the downturn. Using funds supplied by the central bank and commercial banks the China Securities Finance Corporation purchased enough stocks to halt the slide acquiring as much as 5% of the stock in some firms. Lines of credit were extended by CFS to 21 securities firms, some of which also purchased up to 5% of some companies stocks. Some of the small cap stocks acquired may be overvalued.[127][130]
Chinese stocks fell about 10% during the last week of July 2015 with record breaking losses on Monday.[131]
Currency system
The renminbi ("people's currency") is the currency of China, denominated as the yuan, subdivided into 10 jiao or 100 fen. The renminbi is issued by the People's Bank of China, the monetary authority of China. The ISO 4217 abbreviation is CNY, although also commonly abbreviated as "RMB". As of 2005 the yuan was generally considered by outside observers to be undervalued by about 30-40%.[132][133] However the IMF stated that the yuan is now correctly valued.[134]
The renminbi is held in a floating exchange-rate system managed primarily against the US dollar. On 21 July 2005, China revalued its currency by 2.1% against the US dollar and, since then has moved to an exchange rate system that references a basket of currencies and has allowed the renminbi to fluctuate at a daily rate of up to half a percent.
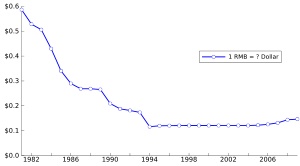
The rate of exchange (Chinese yuan per US$1) on 31 July 2008, was RMB 6.846, in mid-2007 was RMB 7.45, while in early 2006 was RMB 8.07:US $1=8.2793 yuan (January 2000), 8.2783 (1999), 8.2790 (1998), 8.2898 (1997), 8.3142 (1996), 8.3514 (1995).
There is a complex relationship between China's balance of trade, inflation, measured by the consumer price index and the value of its currency. Despite allowing the value of the yuan to "float", China's central bank has decisive ability to control its value with relationship to other currencies. Inflation in 2007, reflecting sharply rising prices for meat and fuel, is probably related to the worldwide rise in commodities used as animal feed or as fuel. Thus rapid rises in the value of the yuan permitted in December 2007 are possibly related to efforts to mitigate inflation by permitting the renminbi to be worth more.[135] An article published in International Review of Economics & Finance in 2010 by Mete Feridun (University of Greenwich Business School) and his colleagues provide empirical evidence that financial development fosters economic growth in China.[121]
During the week of 10 August 2015, against the background of a slowing Chinese economy and appreciation of the U.S. dollar, the People's Bank of China devalued the renminbi by about 5%.[136] The devaluation was accomplished by pegging the official rate to closing market rates. A market-based "representative" exchange rate against the U.S. dollar is one of the requirements for designation of a currency as one with Special Drawing Rights (SDR) by the International Monetary Fund (IMF), one of China's goals.[137] Since the late-2000s, China has sought to internationalize the renminbi. As of 2013, the RMB is the 8th most widely traded currency in the world.[138] In November 2015 in advance of G-20 and IMF meetings, IMF director Christine Lagarde announced her support for adding the yuan to the SDR currency basket. The announcement gave 'green-light' to official approval at the 30 November IMF meeting.[139]
Sectors
Agriculture

China is the world's largest producer and consumer of agricultural products – and some 300 million Chinese farm workers are in the industry, mostly laboring on pieces of land about the size of U.S farms. Virtually all arable land is used for food crops. China is the world's largest producer of rice and is among the principal sources of wheat, corn (maize), tobacco, soybeans, potatoes, sorghum, peanuts, tea, millet, barley, oilseed, pork, and fish. Major non-food crops, including cotton, other fibers, and oilseeds, furnish China with a small proportion of its foreign trade revenue. Agricultural exports, such as vegetables and fruits, fish and shellfish, grain and meat products, are exported to Hong Kong. Yields are high because of intensive cultivation, for example, China's cropland area is only 75% of the U.S. total, but China still produces about 30% more crops and livestock than the United States. China hopes to further increase agricultural production through improved plant stocks, fertilizers, and technology.
According to the government statistics issued in 2005,[140] after a drop in the yield of farm crops in 2000, output has been increasing annually.
According to the United Nations World Food Program, in 2003, China fed 20 percent of the world's population with only 7 percent of the world's arable land.[141] China ranks first worldwide in farm output, and, as a result of topographic and climatic factors, only about 10–15 percent of the total land area is suitable for cultivation. Of this, slightly more than half is unirrigated, and the remainder is divided roughly equally between paddy fields and irrigated areas. Nevertheless, about 60 percent of the population lives in the rural areas, and until the 1980s a high percentage of them made their living directly from farming. Since then, many have been encouraged to leave the fields and pursue other activities, such as light manufacturing, commerce, and transportation; and by the mid-1980s farming accounted for less than half of the value of rural output. Today, agriculture contributes only 13% of China's GDP.
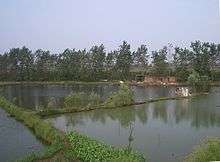
Animal husbandry constitutes the second most important component of agricultural production. China is the world's leading producer of pigs, chickens, and eggs, and it also has sizable herds of sheep and cattle. Since the mid-1970s, greater emphasis has been placed on increasing the livestock output. China has a long tradition of ocean and freshwater fishing and of aquaculture. Pond raising has always been important and has been increasingly emphasized to supplement coastal and inland fisheries threatened by overfishing and to provide such valuable export commodities as prawns.

Environmental problems such as floods, drought, and erosion pose serious threats to farming in many parts of the country. The wholesale destruction of forests gave way to an energetic reforestation program that proved inadequate, and forest resources are still fairly meagre.[142] The principal forests are found in the Qin Mountains and the central mountains and on the Sichuan–Yunnan plateau. Because they are inaccessible, the Qinling forests are not worked extensively, and much of the country's timber comes from Heilongjiang, Jilin, Sichuan, and Yunnan.
Western China, comprising Tibet, Xinjiang, and Qinghai, has little agricultural significance except for areas of floriculture and cattle raising. Rice, China's most important crop, is dominant in the southern provinces and many of the farms here yield two harvests a year. In the north, wheat is of the greatest importance, while in central China wheat and rice vie with each other for the top place. Millet and kaoliang (a variety of grain sorghum) are grown mainly in the northeast and some central provinces, which, together with some northern areas, also provide considerable quantities of barley. Most of the soybean crop is derived from the north and the northeast; corn (maize) is grown in the center and the north, while tea comes mainly from the warm and humid hilly areas of the south. Cotton is grown extensively in the central provinces, but it is also found to a lesser extent in the southeast and in the north. Tobacco comes from the center and parts of the south. Other important crops are potatoes, sugar beets, and oilseeds.
In the past decade, the government has been encouraging agricultural mechanization and land consolidation to raise yields and compensate for the loss of rural workers who have migrated to the cities.[143] According to the most recent statistics by the UN Food and Agriculture Organization, the annual growth rate of agricultural mechanization in China is 6.38 percent. By 2014, the integrated mechanization rate had risen to nearly 60 percent, with the rate for wheat surpassing 90 percent and that for maize approaching 80 percent.[144] In addition to standard agricultural equipment like tractors, China's agriculture cooperatives have begun using high-tech equipment, including unmanned aerial vehicles, which are used to spay crops with pesticides.[145] Good progress has been made in increasing water conservancy, and about half the cultivated land is under irrigation.
In the late 1970s and early 1980s, economic reforms were introduced. First of all this began with the shift of farming work to a system of household responsibility and a phasing out of collectivized agriculture. Later this expanded to include a gradual liberalization of price controls; fiscal decentralization; massive privatization of state enterprises, thereby allowing a wide variety of private enterprises in the services and light manufacturing; the foundation of a diversified banking system (but with large amounts of state control); the development of a stock market; and the opening of the economy to increased foreign trade and foreign investment.
Housing and construction
The real estate industry is about 20% of the Chinese economy.[146]
Energy and mineral resources
- Production: 6.5 trillion kWh (2017)[147]
- Consumption: 2.8248 trillion kWh (2006)
- Exports: 18.7 billion kwh (2015)[148]
- Imports: 6.2 billion kwh (2015)[148]
Electricity – production by source:
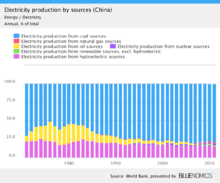
- Thermal: 70.4 (67.1% from coal) (2017)[147]
- Hydro: 17.8% (2017)
- Renewables: 7.3% (2017)
- Nuclear: 3.8% (2017)
- Other: 0.7% (2017)
Oil:
- Production: 3,631,000 bbl/d (577,300 m3/d) (2005)
- Consumption: 6,534,000 bbl/d (1,038,800 m3/d) (2005) and expected 9,300,000 bbl/d (1,480,000 m3/d) in 2030
- Exports: 443,300 bbl/d (70,480 m3/d) (2005)
- Imports: 3,181,000 bbl/d (505,700 m3/d) (2005)
- Net imports: 2,740,000 barrels per day (436,000 m3/d) (2005)
- Proved reserves: 16.3 Gbbl (2.59×10⁹ m3) (1 January 2006)
Natural gas:
- Production: 47.88 km3 (2005 est.)
- Consumption: 44.93 km3 (2005 est.)
- Exports: 2.944 km3 (2005)
- Imports: 0 m3 (2005)
- Proved reserves: 1,448 km3 (1 January 2006 est.)
Since 1980, China's energy production has grown dramatically, as has the proportion allocated to domestic consumption. Some 80 percent of all power is generated from fossil fuel at thermal plants, with about 17 percent at hydroelectric installations; only about two percent is from nuclear energy, mainly from plants located in Guangdong and Zhejiang.[149] Though China has rich overall energy potential, most have yet to be developed. In addition, the geographical distribution of energy puts most of these resources relatively far from their major industrial users. Basically the northeast is rich in coal and oil, the central part of north China has abundant coal, and the southwest has immense hydroelectric potential. But the industrialized regions around Guangzhou and the Lower Yangtze region around Shanghai have too little energy, while there is relatively little heavy industry located near major energy resource areas other than in the southern part of the northeast.
Due in large part to environmental concerns, China has wanted to shift China's current energy mix from a heavy reliance on coal, which accounts for 70–75% of China's energy, toward greater reliance on oil, natural gas, renewable energy, and nuclear power. China has closed thousands of coal mines over the past five to ten years to cut overproduction. According to Chinese statistics, this has reduced coal production by over 25%.
Since 1993, China has been a net importer of oil, a large portion of which comes from the Middle East. Imported oil accounts for 20% of the processed crude in China. Net imports are expected to rise to 3.5 million barrels (560,000 m3) per day by 2010. China is interested in diversifying the sources of its oil imports and has invested in oil fields around the world. China is developing oil imports from Central Asia and has invested in Kazakhstani oil fields. Beijing also plans to increase China's natural gas production, which currently accounts for only 3% of China's total energy consumption and incorporated a natural gas strategy in its 10th Five-Year Plan (2001–2005), with the goal of expanding gas use from a 2% share of total energy production to 4% by 2005 (gas accounts for 25% of U.S. energy production). Analysts expect China's consumption of natural gas to more than double by 2010.
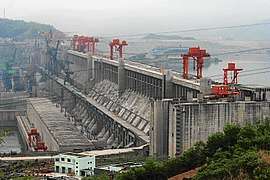
The 11th Five-Year Program (2006–10), announced in 2005 and approved by the National People's Congress in March 2006, called for greater energy conservation measures, including development of renewable energy sources and increased attention to environmental protection. Guidelines called for a 20% reduction in energy consumption per unit of GDP by 2010. Moving away from coal towards cleaner energy sources including oil, natural gas, renewable energy, and nuclear power is an important component of China's development program. Beijing also intends to continue to improve energy efficiency and promote the use of clean coal technology. China has abundant hydroelectric resources; the Three Gorges Dam, for example, will have a total capacity of 18 gigawatts when fully on-line (projected for 2009). In addition, the share of electricity generated by nuclear power is projected to grow from 1% in 2000 to 5% in 2030. China's renewable energy law, which went into effect in 2006, calls for 10% of its energy to come from renewable energy sources by 2020.
Mining
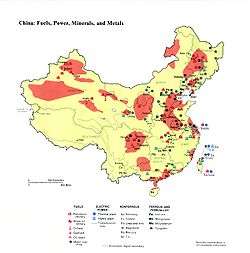
Outdated mining and ore-processing technologies are being replaced with modern techniques, but China's rapid industrialization requires imports of minerals from abroad. In particular, iron ore imports from Australia and the United States have soared in the early 2000s as steel production rapidly outstripped domestic iron ore production. Also China has become increasingly active in several African countries to mine the reserves it requires for economic growth, particularly in countries such as the Democratic Republic of the Congo and Gabon.
The major areas of production in 2004 were coal (nearly 2 billion tons), iron ore (310 million tons), crude petroleum (175 million tons), natural gas (41 million cubic meters), antimony ore (110,000 tons), tin concentrates (110,000 tons), nickel ore (64,000 tons), tungsten concentrates (67,000 tons), unrefined salt (37 million tons), vanadium (40,000 tons), and molybdenum ore (29,000 tons). In order of magnitude, produced minerals were bauxite, gypsum, barite, magnesite, talc and related minerals, manganese ore, fluorspar, and zinc. In addition, China produced 2,450 tons of silver and 215 tons of gold in 2004. The mining sector accounted for less than 0.9% of total employment in 2002 but produced about 5.3% of total industrial production.
Hydroelectric resources
China has an abundant potential for hydroelectric power production due to its considerable river network and mountainous terrain. Most of the total hydroelectric capacity is situated in the southwest of the country, where coal supplies are poor but demand for energy is rising swiftly. The potential in the northeast is fairly small, but it was there that the first hydroelectric stations were built—by the Japanese during its occupation of Manchuria.[150] Due to considerable seasonal fluctuations in rainfall, the flow of rivers tends to drop during the winter, forcing many power stations to operate at less than normal capacity, while in the summer, on the other hand, floods often interfere with generation.
Thirteen years in construction at a cost of $24 billion, the immense Three Gorges Dam across the Yangtze River was essentially completed in 2006 and will revolutionize electrification and flood control in the area.
Coal
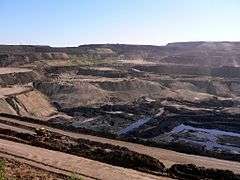
China is well endowed with mineral resources,[151] the most important of which is coal. China's mineral resources include large reserves of coal and iron ore, plus adequate to abundant supplies of nearly all other industrial minerals. Although coal deposits are widely scattered (some coal is found in every province), most of the total is located in the northern part of the country. The province of Shanxi, in fact, is thought to contain about half of the total; other important coal-bearing provinces include Heilongjiang, Liaoning, Jilin, Hebei, and Shandong.[152] Apart from these northern provinces, significant quantities of coal are present in Sichuan, and there are some deposits of importance in Guangdong, Guangxi, Yunnan, and Guizhou.[152] A large part of the country's reserves consists of good bituminous coal, but there are also large deposits of lignite. Anthracite is present in several places (especially Liaoning, Guizhou, and Henan), but overall it is not very significant.[153]
To ensure a more even distribution of coal supplies and to reduce the strain on the less than adequate transportation network, the authorities pressed for the development of a large number of small, locally run mines throughout the country. This campaign was energetically pursued after the 1960s, with the result that thousands of small pits have been established, and they produce more than half the country's coal. This output, however, is typically expensive and is used for local consumption. It has also led to a less than stringent implementation of safety measures in these unregulated mines, which cause several thousands of deaths each year.[154]
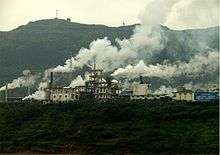
Coal makes up the bulk of China's energy consumption (70% in 2005), and China is the largest producer and consumer of coal in the world. As China's economy continues to grow, China's coal demand is projected to rise significantly. Although coal's share of China's overall energy consumption will decrease, coal consumption will continue to rise in absolute terms. China's continued and increasing reliance on coal as a power source has contributed significantly to putting China on the path to becoming the world's largest emitter of acid rain-causing sulfur dioxide and greenhouse gases, including carbon dioxide.
As of 2015 falling coal prices resulted in layoffs at coal mines in the northeast.[155]
Oil and natural gas
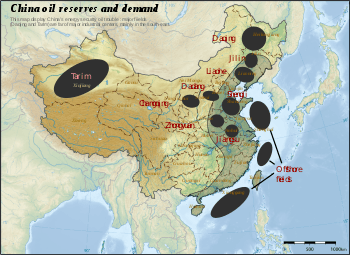
China's onshore oil resources are mostly located in the Northeast and in Xinjiang, Gansu, Qinghai, Sichuan, Shandong, and Henan provinces. Oil shale is found in a number of places, especially at Fushun in Liaoning, where the deposits overlie the coal reserves, as well as in Guangdong. High quality light oil has been found in the Pearl River estuary of the South China Sea, the Qaidam Basin in Qinghai, and the Tarim Basin in Xinjiang. The country consumes most of its oil output but does export some crude oil and oil products. China has explored and developed oil deposits in the South China Sea and East China Sea, the Yellow Sea, the Gulf of Tonkin, and the Bohai Sea.
In 2013, the pace of China's economic growth exceeded the domestic oil capacity and floods damaged the nation's oil fields in the middle of the year. Consequently, China imported oil to compensate for the supply reduction and surpassed the US in September 2013 to become the world's largest importer of oil.[156]
The total extent of China's natural gas reserves is unknown, as relatively little exploration for natural gas has been done.[157] Sichuan accounts for almost half of the known natural gas reserves and production.[158] Most of the rest of China's natural gas is associated gas produced in the Northeast's major oil fields, especially Daqing oilfield. Other gas deposits have been found in the Qaidam Basin, Hebei, Jiangsu, Shanghai, and Zhejiang, and offshore to the southwest of Hainan Island.[159] According to an article published in Energy Economics in 2011 by economists Mete Feridun (University of Greenwich) and Abdul Jalil (Wuhan University in China), financial development in China has not taken place at the expense of environmental pollution and financial development has led to a decrease in environmental pollution. Authors conclude that carbon emissions are mainly determined by income, energy consumption and trade openness and their findings confirm the existence of an Environmental Kuznets Curve in the case of China.[160]
Metals and nonmetals
Iron ore reserves are found in most provinces, including Hainan. Gansu, Guizhou, southern Sichuan, and Guangdong provinces have rich deposits. The largest mined reserves are located north of the Yangtze River and supply neighboring iron and steel enterprises. With the exception of nickel, chromium, and cobalt, China is well supplied with ferroalloys and manganese. Reserves of tungsten are also known to be fairly large. Copper resources are moderate, and high-quality ore is present only in a few deposits. Discoveries have been reported from Ningxia. Lead and zinc are available, and bauxite resources are thought to be plentiful. China's antimony reserves are the largest in the world. Tin resources are plentiful, and there are fairly rich deposits of gold. China is the world's fifth largest producer of gold and in the early 21st century became an important producer and exporter of rare metals needed in high-technology industries.
China also produces a fairly wide range of nonmetallic minerals. One of the most important of these is salt, which is derived from coastal evaporation sites in Jiangsu, Hebei, Shandong, and Liaoning, as well as from extensive salt fields in Sichuan, Ningxia, and the Qaidam Basin. There are important deposits of phosphate rock in a number of areas; Jiangxi, Guangxi, Yunnan and Hubei. Production has been accelerating every year. As of 2013 China is producing 97,000,000 metric tons of phosphate rock a year.[161] Pyrites occur in several places; Liaoning, Hebei, Shandong, and Shanxi have the most important deposits. China also has large resources of fluorite (fluorspar), gypsum, asbestos, and has the world's largest reserves and production of cement, clinker and limestone.
Industry and manufacturing

Industry and construction account for 46.8[162]% of China's GDP. Between the years 2011 and 2013, China used more cement than the United States consumed during the entire 20th century.[163] In 2009 around 8% of the total manufacturing output in the world came from China itself and China ranked third worldwide in industrial output that year (first was EU and second United States). Research by IHS Global Insight states that in 2010 China contributed to 19.8% of world's manufacturing output and became the largest manufacturer in the world that year, after the US had held that position for about 110 years.[164][165]
In November 2012 the State Council of the People's Republic of China mandated a "social risk assessment" for all major industrial projects. This requirement followed mass public protests in some locations for planned projects or expansions.[166]
Major industries include mining and ore processing; iron and steel; aluminium; coal; machinery; armaments; textiles and apparel; petroleum; cement; chemical; fertilizers; food processing; automobiles and other transportation equipment including rail cars and locomotives, ships, and aircraft; consumer products including footwear, toys, and electronics; telecommunications and information technology. China has become a preferred destination for the relocation of global manufacturing facilities. Its strength as an export platform has contributed to incomes and employment in China.
Since the founding of the People's Republic, industrial development has been given considerable attention; as of 2011 46% of China's national output continued to be devoted to investment; a percentage far higher than any other nation.[167] Among the various industrial branches the machine-building and metallurgical industries have received the highest priority. These two areas alone now account for about 20–30 percent of the total gross value of industrial output.[168] In these, as in most other areas of industry, however, innovation has generally suffered at the hands of a system that has rewarded increases in gross output rather than improvements in variety, sophistication and quality. China, therefore, still imports significant quantities of specialized steels. Overall industrial output has grown at an average rate of more than 10 percent per year, having surpassed all other sectors in economic growth and degree of modernization.[169] Some heavy industries and products deemed to be of national strategic importance remain state-owned, but an increasing proportion of lighter and consumer-oriented manufacturing firms are privately held or are private-state joint ventures.
The predominant focus of development in the chemical industry is to expand the output of chemical fertilizers, plastics, and synthetic fibers. The growth of this industry has placed China among the world's leading producers of nitrogenous fertilizers. In the consumer goods sector the main emphasis is on textiles and clothing, which also form an important part of China's exports. Textile manufacturing, a rapidly growing proportion of which consists of synthetics, account for about 10 percent of the gross industrial output and continues to be important, but less so than before. The industry tends to be scattered throughout the country, but there are a number of important textile centers, including Shanghai, Guangzhou, and Harbin.[170][171]
Steel industry
In 2011, China was the largest producer of steel in the world producing 45% of the world's steel, 683 million tons, an increase of 9% from 2010. 6 of 10 of largest steel producers in the world are in China. Profits are low despite continued high demand due to high debt and overproduction of high end products produced with the equipment financed by the high debt. The central government is aware of this problem but there is no easy way to resolve it as local governments strongly support local steel production. Meanwhile, each firm aggressively increases production.[172] Iron ore production kept pace with steel production in the early 1990s but was soon outpaced by imported iron ore and other metals in the early 2000s. Steel production, an estimated 140 million tons in 2000 increased to 419 million tons in 2006. Much of the country's steel output comes from a large number of small-scale producing centers, one of the largest being Anshan in Liaoning.
China was the top exporter of steel in the world in 2008. Export volumes in 2008 were 59.23 million tons, a 5.5% fall over the previous year.[173] The decline ended China's decade-old steel export growth. As of 2012 steel exports faced widespread anti-dumping taxes and had not returned to pre-2008 levels. Domestic demand remained strong, particularly in the developing west where steel production in Xinjiang was expanding.[172]
On 26 April 2012, a warning was issued by China's bank regulator to use caution with respect to lending money to steel companies who, as profits from the manufacture and sale of steel have fallen, have sometimes used borrowed money for speculative purposes. According to the China Iron and Steel Association the Chinese steel industry lost 1 billion Rmb in the first quarter of 2012, its first loss since 2000.[174]
Automotive industry

By 2006 China had become the world's third largest automotive vehicle manufacturer (after US and Japan) and the second largest consumer (only after the US). Automobile manufacturing has soared during the reform period. In 1975 only 139,800 automobiles were produced annually, but by 1985 production had reached 443,377, then jumped to nearly 1.1 million by 1992 and increased fairly evenly each year up until 2001, when it reached 2.3 million. In 2002 production rose to nearly 3.25 million and then jumped to 4.44 million in 2003, 5.07 million in 2004, 5.71 million in 2005, 7.28 million in 2006, 8.88 million in 2007, 9.35 million in 2008 and 13.83 million in 2009. China has become the number-one automaker in the world in 2009. Domestic sales have kept pace with production. After respectable annual increases in the mid- and late 1990s, passenger car sales soared in the early 2000s. In 2006, a total of 7.22 million automobiles were sold, including 5.18 million units of passenger cars and 2.04 million units of commercial vehicles.
In 2010, China became the world's largest automotive vehicle manufacturer as well as the largest consumer ahead of the United States with an estimated 18 million new cars sold.[175] However, new car sales grew only by an estimated 1% between 2011 and 2012 due to the escalation in the Spratly Islands dispute, which involved Japan, the world's third largest producer of vehicles.[176]
China's automotive industry has been so successful that it began exporting car parts in 1999. China began to plan major moves into the automobile and components export business starting in 2005. A new Honda factory in Guangzhou was built in 2004 solely for the export market and was expected to ship 30,000 passenger vehicles to Europe in 2005. By 2004, 12 major foreign automotive manufacturers had joint-venture plants in China. They produced a wide range of automobiles, minivans, sport utility vehicles, buses, and trucks. In 2003 China exported US$4.7 billion worth of vehicles and components. The vehicle export was 78,000 units in 2004, 173,000 units in 2005, and 340,000 units in 2006. The vehicle and component export is targeted to reach US$70 billion by 2010.
The market for domestically produced cars, under a local name, is likely to continue to grow both inside China and outside. Companies such as Geely, Qiantu and Chery are constantly evaluating new international locations, both in developing and developed countries.[177]
Other industries
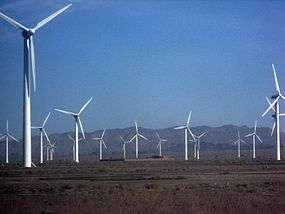
Substantial investments were made in the manufacture of solar panels and wind generators by a number of companies, supported by liberal loans by banks and local governments. However, by 2012 manufacturing capacity had far outstripped domestic and global demand for both products, particularly solar panels, which were subjected to anti-dumping penalties by both the United States and Europe. The global oversupply has resulted in bankruptcies and production cutbacks both inside and outside China. China has budgeted $50 billion to subsidize production of solar power over the two decades following 2015 but, even at the sharply reduced price resulting from oversupply, as of 2012 cost of solar power in China remained three times that of power produced by conventional coal-fired power plants.[178]
China is the world's biggest sex toy producer and accounts for 70% of the worldwide sex toys production.[179] In the country, 1,000 manufacturers are active in this industry, which generates about two billion dollars a year.[179]
As of 2011, China was the world's largest market for personal computers[180]
Services
The output of China's services in 2010 ranks third worldwide—after the United States and Japan—and high power and telecom density has ensured that the country has remained on a high-growth trajectory over the long term. In 2010 the services sector produced 43% of China's annual GDP, second only to manufacturing. However, its proportion of GDP is still low compared to the ratio in more developed countries, and the agricultural sector still employs a larger workforce.
Prior to the onset of economic reforms in 1978, China's services sector was characterized by state-operated shops, rationing, and regulated prices—with reform came private markets, individual entrepreneurs, and a commercial sector. The wholesale and retail trade has expanded quickly, with numerous shopping malls, retail shops, restaurant chains and hotels constructed in urban areas. Public administration remains a main component of the service sector, while tourism has become a significant factor in employment and a source of foreign exchange.[181]
Chengdu, China, is home to the world's largest building—the New Century Global Center, which, at 100 m (328 ft) high, 500 m (1,640 ft) long, and 400 m (1,312 ft) wide, houses retail outlets, a 14-theater cinema, offices, hotels, the Paradise Island waterpark, an artificial beach, a 150 m (164 yd)-long LED screen, skating rink, pirate ship, fake Mediterranean village, 24-hour artificial sun, and 15,000-spot parking lot.[182]
Telecommunications
China possesses a diversified communications system that links all parts of the country by Internet, telephone, telegraph, radio, and television.
China's number of Internet users or netizens topped 137 million by the end of 2006,[183] an increase of 23.4% from a year before and 162 million by June 2007, making China the second-largest Internet user after the United States, according to China's Ministry of Information Industry (MII). China's mobile phone penetration rate was 34% in 2007. In 2006, mobile phone users sent 429 billion text messages (on average 967 text messages per user). For 2006, the number of fixed-lines grew by 79%, mainly in the rural areas.[184]
Tourism
China's tourism industry is one of the fastest-growing industries in the national economy and is also one of the industries with a very distinct global competitive edge. According to the World Travel and Tourism Council, travel and tourism directly contributed CNY 1,362 billion (US$216 billion) to the Chinese economy (about 2.6% of GDP).[185] In 2011, total international tourist arrivals was 58 million, and international tourism receipts were US$48 billion.[186]
Domestic tourism market makes up more than 90% of the country's tourism traffic, and contributes more than 70% of total tourism revenue. In 2002, domestic tourists reached 878 million and tourism revenue was $46.9 billion. A large middle class with strong consumption power is emerging in China, especially in major cities. China's outbound tourists reached 20.22 million in 2003, overtaking Japan for the first time.
It is forecast by the World Tourism Organisation that China's tourism industry will take up to 8.6% of world market share to become the world's top tourism industry by 2020.
Chinese business-travel spending is also forecast to be the highest in the world by 2014, overtaking the United States. According to a Global Business Travel Association study, total business-travel spending is expected to reach US$195 billion in 2012.[187]
Luxury goods
Luxury spending in China has skyrocketed, an indicator of the country's newfound wealth. For example, the Chinese bottled water industry is forecast to more than double in size in 2008, becoming a $10.5 billion industry. Meanwhile, as those who once had no recourse but low-quality tap water take advantage of its availability in supermarkets, those who had little or no running water are now capitalising on its availability. Tap water production and supply is expected to grow by 29.3% in 2008, to $11.9 billion. China's automotive industry is expected to expand by 29.5% to nearly $200 billion. Also, consumption of chocolate and other confectionery is to increase by 24.3%, as the industry expands to $4.6 billion. Additionally China's fast food industry has been growing at a 20.8% annual rate as major players such as McDonald's enter the market. The LVMH Group, who own major luxury brands including Louis Vuitton apparel, Moët & Chandon wines and champagne and Hennessy cognacs, reported earnings growth of over 25% in 2007 in China, with the country accounting for around 16% of LVMH's global business.[188]
After an October 2012 ban on government agencies purchasing luxury goods, often used as "gifts", sales of luxury goods in China remained strong but slowed, even falling slightly for some luxury retailers in the 4th quarter of 2012,[189] with sales of shark fins and edible swallow nests (once staples of lavish government banquets) down sharply.[190]
Retail sales in China account for only 7% of global retail sales of luxury consumer goods; however, Chinese buyers account for 25% of global retail sales of luxury consumer goods. Many shops in international travel destinations have specialized staff devoted to Chinese customers.[189]
Cybercrime
As of 2016, computer crime is a lucrative illicit practice in China. An academic study released in August 2012 by the University of California (UC) Institute on Global Conflict and Cooperation, claimed that China's "cyber black market" involved over 90,000 participants, cost the local economy 5.36 billion yuan (£536m), negatively impacted upon 110 million internet users (22%), and affected 1.1 million websites (20%) in 2011.[191] In July 2012, China's State Council released a set of information security guidelines as a measure to combat cyber crime that included increased auditing, security reporting, and monitoring, and a commitment to "reduce the number of internet connection points".[192]
Labour and welfare

One of the hallmarks of China's socialist economy was its promise of employment to all able and willing to work and job-security with virtually lifelong tenure. This socialist policy is known as the iron rice bowl.
In 1979–1980, the state reformed factories by giving wage increases to workers, which was immediately offset by sharply rising inflation rates of 6–7%. The reforms also dismantled the iron rice bowl, which meant it witnessed a rise in unemployment in the economy. In 1979 there were 20 million unemployed people.[193]
China's estimated employed labor force in 2005 totaled 791.4 million persons, about 60% of the total population. During 2003, 49% of the labor force worked in agriculture, forestry, and fishing; 22% in mining, manufacturing, energy, and construction industries; and 29% in the services sector and other categories. In 2004 some 25 million persons were employed by 743,000 private enterprises. Urban wages rose rapidly from 2004 to 2007, at a rate of 13 to 19% per year with average wages near $200/month in 2007.[194] By 2016 the average monthly wage for workers engaged in manufacturing goods for export was $424. This wage, combined with other costs of doing business in China, had, more or less, equalized any Chinese cost advantage with respect to developed economies.[195]
The All-China Federation of Trade Unions (ACFTU) was established in 1925 to represent the interests of national and local trade unions and trade union councils. The ACFTU reported a membership of 130 million, out of an estimated 248 million urban workers, at the end of 2002. Chinese trade unions are organized on a broad industrial basis. Membership is open to those who rely on wages for the whole or a large part of their income, a qualification that excludes most agricultural workers.
In 2010, the issues of manufacturing wages caused a strike at a Honda parts plant. This resulted in wage increases both at the struck plant and other industrial plants.[196][197][198][199][200]
The 2010 census found that China was now half urban and rapidly aging due to the one child policy. This is expected to lead to increased demand for labor to take care of an elderly population and a reduced supply of migrant labor from the countryside.[201]
Due to worsening pollution, the corruption and political uncertainties of the one-party state and the limited economic freedom in an economy dominated by large state-owned enterprises, many skilled professionals are either leaving the country or preparing safety nets for themselves abroad.[202][203][204] In the decade up to 2014, 10 million Chinese emigrated to other countries, taking assets and their technical skills.[205] Perceived corruption continued to grow worse in China as it dropped from 75th to 80th place in Transparency International's index of state corruption.[206]
A law approved February 2013 will mandate a nationwide minimum wage at 40% average urban salaries to be phased in fully by 2015.[207]
External trade
International trade makes up a sizeable portion of China's overall economy. Being a Second World country at the time, a meaningful segment of China's trade with the Third World was financed through grants, credits, and other forms of assistance. The principal efforts were made in Asia, especially to Indonesia, Burma, Pakistan, and Ceylon, but large loans were also granted in Africa (Ghana, Algeria, Tanzania) and in the Middle East (Egypt). However, after Mao Zedong's death in 1976, these efforts were scaled back. After which, trade with developing countries became negligible, though during that time, Hong Kong and Taiwan both began to emerge as major trading partners.
Since economic reforms began in the late 1970s, China sought to decentralize its foreign trade system to integrate itself into the international trading system. In November 1991, China joined the Asia-Pacific Economic Cooperation (APEC) group, which promotes free trade and cooperation in the economic, trade, investment, and technology spheres. China served as APEC chair in 2001, and Shanghai hosted the annual APEC leaders meeting in October of that year.
After reaching a bilateral WTO agreement with the EU and other trading partners in summer 2000, China worked on a multilateral WTO accession package. China concluded multilateral negotiations on its accession to the WTO in September 2001. The completion of its accession protocol and Working Party Report paved the way for its entry into the WTO on 11 December 2001, after 16 years of negotiations, the longest in the history of the General Agreement on Tariffs and Trade. However, U.S. exporters continue to have concerns about fair market access due to China's restrictive trade policies and U.S. export restrictions.
China's global trade exceeded $4.16 trillion at the end of 2013. It first broke the $100 billion mark in 1988, $200 billion in 1994, $500 billion in 2001, $1 trillion mark ($1.15 trillion) in 2004,$2 trillion mark ($2.17 trillion) in 2007,$3 trillion mark ($3.64 trillion) in 2011, and $4 trillion mark ($4.16 trillion) in 2013. The table below shows the average annual growth (in nominal US dollar terms) of China's foreign trade during the reform era.
| Period | Two-way trade | Exports | Imports |
|---|---|---|---|
| 1981–1985 | +12.8% | +8.6% | +16.1% |
| 1986–1990 | +10.6% | +17.8% | +4.8% |
| 1991–1995 | +19.5% | +19.1% | +19.9% |
| 1996–2000 | +11.0% | +10.9% | +11.3% |
| 2001–2005 | +24.6% | +25.0% | +24.0% |
| 2006–2010 | +15.9% | +15.7% | +16.1% |
| 2015 | −8.0% | −2.8% | −14.1% |
The vast majority of China's imports consists of industrial supplies and capital goods, notably machinery and high-technology equipment, the majority of which comes from the developed countries, primarily Japan and the United States. Regionally, almost half of China's imports come from East and Southeast Asia, and about one-fourth of China's exports go to the same destinations. About 80 percent of China's exports consist of manufactured goods, most of which are textiles and electronic equipment, with agricultural products and chemicals constituting the remainder. Out of the five busiest ports in the world, three are in China. The U.S. trade deficit with China reached $232.5 billion in 2006, as imports grew 18%. China's share of total U.S. imports has grown from 7% to 15% since 1996.
Trade volume between China and Russia reached $29.1 billion in 2005, an increase of 37.1% compared with 2004. A spokesman for the Ministry of Commerce, Van Jingsun, said that the volume of trade between China and Russia could exceed 40 billion dollars in 2007.[209] China's export of machinery and electronic goods to Russia grew 70%, which is 24% of China's total export to Russia in the first 11 months of 2005. During the same time, China's export of high-tech products to Russia increased by 58%, and that is 7% of China's total exports to Russia. Also at that time period, border trade between the two countries reached $5.13 billion, growing 35% and accounting for nearly 20% of the total trade. Most of China's exports to Russia remain apparel and footwear. Russia is China's eighth largest trade partner and China is now Russia's fourth largest trade partner, and China now has over 750 investment projects in Russia, involving $1.05 billion. China's contracted investment in Russia totaled $368 million during January–September 2005, twice that in 2004.
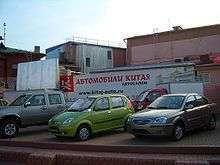
Chinese imports from Russia are mainly those of energy sources, such as crude oil, which is mostly transported by rail, and electricity exports from neighboring Siberian and Far Eastern regions. In the near future, exports of both of these commodities are set to increase, as Russia is building the Eastern Siberia-Pacific Ocean oil pipeline with a branch going to the Chinese border, and Russian power grid monopoly UES is building some of its hydropower stations with a view of future exports to China.
Export growth has continued to be a major component supporting China's rapid economic growth. To increase exports, China pursued policies such as fostering the rapid development of foreign-invested factories, which assembled imported components into consumer goods for export and liberalizing trading rights. In its 11th Five-Year Program, adopted in 2005, China placed greater emphasis on developing a consumer demand-driven economy to sustain economic growth and address imbalances.
Foreign investment
China's investment climate has changed dramatically with more than two decades of reform. In the early 1980s, China restricted foreign investments to export-oriented operations and required foreign investors to form joint-venture partnerships with Chinese firms. The Encouraged Industry Catalogue sets out the degree of foreign involvement allowed in various industry sectors. From the beginning of the reforms legalizing foreign investment, capital inflows expanded every year until 1999.[210] Foreign-invested enterprises account for 58–60% of China's imports and exports.[211]
Since the early 1990s, the government has allowed foreign investors to manufacture and sell a wide range of goods on the domestic market, eliminated time restrictions on the establishment of joint ventures, provided some assurances against nationalization, allowed foreign partners to become chairs of joint venture boards, and authorized the establishment of wholly foreign-owned enterprises, now the preferred form of FDI. In 1991, China granted more preferential tax treatment for Wholly Foreign Owned Enterprises and contractual ventures and for foreign companies, which invested in selected economic zones or in projects encouraged by the state, such as energy, communications and transportation.
China also authorized some foreign banks to open branches in Shanghai and allowed foreign investors to purchase special "B" shares of stock in selected companies listed on the Shanghai and Shenzhen Securities Exchanges. These "B" shares sold to foreigners carried no ownership rights in a company. In 1997, China approved 21,046 foreign investment projects and received over $45 billion in foreign direct investment. China revised significantly its laws on Wholly Foreign-Owned Enterprises and China Foreign Equity Joint Ventures in 2000 and 2001, easing export performance and domestic content requirements. The Vice Minister of Finance Zhu Guangyao announced, foreign investors will be allowed to own up to 51% on domestic financial service companies. Formerly foreign ownership was limited to a 49% stake in these firms.[212]
Foreign investment remains a strong element in China's rapid expansion in world trade and has been an important factor in the growth of urban jobs. In 1998, foreign-invested enterprises produced about 40% of China's exports, and foreign exchange reserves totalled about $145 billion. Foreign-invested enterprises today produce about half of China's exports (the majority of China's foreign investment come from Hong Kong, Macau and Taiwan), and China continues to attract large investment inflows. However, the Chinese government's emphasis on guiding FDI into manufacturing has led to market saturation in some industries, while leaving China's services sectors underdeveloped. From 1993 to 2001, China was the world's second-largest recipient of foreign direct investment after the United States. China received $39 billion FDI in 1999 and $41 billion FDI in 2000. China is now one of the leading FDI recipients in the world, receiving almost $80 billion in 2005 according to World Bank statistics. In 2006, China received $69.47 billion in foreign direct investment.[213] By 2011, with the U.S. seeing a decline in foreign investment following the 2008 financial crisis, China overtook it as the top destination for FDI, receiving over $280 billion that year.[214]
Amid slowing economic conditions and a weakening yuan in 2015, December of that year saw a 5.8% drop in FDI to China.[215] While China's rank as the top receiver of FDI continued through 2014, the slowing of inbound investment in 2015 combined with a massive rebound in foreign investment to the United States resulted in the U.S. reclaiming its position as the top investment destination.[216] Data from the American Chamber of Commerce in China's 2016 China Business Climate Survey confirms this trend, although it also demonstrates that China remains a top investment destination. This survey of over 500 members found that "China remains a top three investment priority for six out of ten member companies," though this is a decline from the 2012 high of eight out of ten respondents considering China a top priority.[217]
Foreign exchange reserves totaled $155 billion in 1999 and $165 billion in 2000. Foreign exchange reserves exceeded $800 billion in 2005, more than doubling from 2003. Foreign exchange reserves were $819 billion at the end of 2005, $1.066 trillion at the end of 2006, $1.9 trillion by June 2008. In addition, by the end of September 2008 China replaced Japan for the first time as the largest foreign holder of US treasury securities with a total of $585 billion, vs Japan $573 billion. China has now surpassed those of Japan, making China's foreign exchange reserves the largest in the world.
As part of its WTO accession, China undertook to eliminate certain trade-related investment measures and to open up specified sectors that had previously been closed to foreign investment. New laws, regulations, and administrative measures to implement these commitments are being issued. Major remaining barriers to foreign investment include opaque and inconsistently enforced laws and regulations and the lack of a rules-based legal infrastructure. Warner Bros., for instance, withdrew its cinema business in China as a result of a regulation that requires Chinese investors to own at least a 51 percent stake or play a leading role in a foreign joint venture.[218]
Another major development in the history of foreign investment in China was the establishment of the Shanghai Free Trade Zone in September 2013.[219] The Zone is considered a testing ground for a number of economic and social reforms.[220][221] Critically, foreign investment is controlled via a "negative list" approach, where FDI is permitted in all sectors unless explicitly prohibited by the inclusion of a given sector on the Negative List published by the Shanghai Municipal Government.[222]
Chinese investment abroad
Outward foreign direct investment is a new feature of Chinese globalization, where local Chinese firms seek to make investments in both developing and developed countries.[223] It was reported in 2011 that there was increasing investment by capital rich Chinese firms in promising firms in the United States. Such investments offer access to expertise in marketing and distribution potentially useful in exploiting the developing Chinese domestic market.[224]
Since 2005 when Levono acquired IBM's ThinkPad, Chinese companies have been actively expanding outside of China, in both developed and developing countries. In 2013, Chinese companies invested US$90 billion globally in non-financial sectors, 16% more than 2012.[225]
Between January 2009 and December 2013, China contributed a total of $161.03bn in outward FDI, creating almost 300,000 jobs. Western Europe was the largest regional recipient of Chinese outward FDI, with Germany receiving the highest number of FDI projects for any country globally.[226]
There are two ways Chinese companies choose to enter a foreign market: organic growth and Merge & Acquisition (M&A). Many Chinese companies would prefer M&A for the following reasons:
- Fast. M&A is the fastest way for a company to expand into another country by acquiring brand, distribution, talents, and technology. Chinese CEOs has been used to growing at 50%+ speed and do not want to spend capital.
- China market. China has become the world's largest economy. Many Chinese acquire foreign companies and then bring their products/services to China, anything from premium cars to fashion clothing to meat to Hollywood movies.
- Cheap capital access. The huge Chinese domestic market help many Chinese companies accumulated financial capital to do M&A. Chinese government also provides long-term, low-interest capital for companies to expand abroad.
- Low risk. M&A helped Chinese companies avoid risk of failure of organic growth as they got an established company with everything in place.
- Cheap labor. Some companies may move part of the manufacturing in high labor cost countries to China to reduce the cost and make the product more attractive in price.
- Trade and policy barrier. Chinese companies in many sectors face quota limitation and high tax, which prevent them from being competitive in foreign markets.
- Depressed assets. 2008-2010 global economic crisis created liquidity problems for a lot of western companies and reduced their market value. Chinese companies believe it is a great opportunity for them to buy these depressed assets at discount. China's direct foreign investment in non-financial sector growth from US $25 billion in 2007 to US$90 billion in 2013, more than three times.[227]
- China is growing in investments and influencing power over Europe, and the EU has begun to take notice. [228]
At the beginning, state-owned enterprises dominate the foreign acquisition and most of the money goes to oil and minerals. Since 2005, more and more private companies start to acquire non raw material foreign companies. Below is a list of the top 15 outbound deals from Chinese companies:[229]
| Date | Acquirer | Acquirer industry | Target | Target industry | Target country | Deal value in USD |
| 3 February 2016 | CNAC Saturn (NL) BV | Chemicals | Syngenta AG | Chemicals | Switzerland | 41,840.11 |
| 23 July 2012 | CNOOC Canada Holding Ltd | Other financials | Nexen Inc | Oil and gas | Canada | 19,119.31 |
| 1 February 2008 | Shining Prospect Pte Ltd | Other financials | Rio Tinto PLC | Metals and mining | United Kingdom | 14,284.17 |
| 2 June 2017 | China Investment Corp | Alternative financial investments | Logicor Ltd | Non residential | United Kingdom | 13,742.43 |
| 14 July 2017 | Nesta Investment Holdings Ltd | Other financials | Global Logistic Properties Ltd | Non residential | Singapore | 11,553.58 |
| 22 August 2017 | China Unicom (BVI) Ltd | Telecommunications services | China Unicom Hong Kong Ltd | Telecommunications services | Hong Kong | 11,255.81 |
| 6 October 2016 | Park Aerospace Holdings Ltd | Transportation and infrastructure | C2 Aviation Capital LLC | Transportation and infrastructure | United States | 10,380.00 |
| 14 October 2015 | China Tower Corp Ltd | Telecommunications services | China-Telecommun tower asts | Wireless | China | 9,948.41 |
| 21 June 2016 | Halti SA | Other financials | Supercell Oy | Software | Finland | 8,600.00 |
| 24 June 2009 | Mirror Lake Oil & Gas Co Ltd | Oil and gas | Addax Petroleum Corp | Oil and gas | Switzerland | 7,157.40 |
| 1 October 2010 | China Petrochemical Corp | Oil and gas | Repsol YPF Brasil SA | Oil and gas | Brazil | 7,111.00 |
| 16 March 2016 | Anbang Insurance Group Co Ltd | Insurance | Strategic Hotels & Resorts Inc | REITs | United States | 6,500.00 |
| 24 October 2016 | Hna Tourism Grp Co Ltd | Travel services | Hilton Worldwide Holdings Inc | Hotels and lodging | United States | 6,496.88 |
| 17 February 2016 | Tianjin Tianhai Invest Co Ltd | Transportation and infrastructure | Ingram Micro Inc | Computers and peripherals | United States | 6,067.41 |
| 22 March 2015 | Marco Polo Industrial Hldg SpA | Other financials | Pirelli & C SpA | Automobiles and components | Italy |
However, the fast growth and M&A deals did not change consumers' low quality and low price perception of Chinese goods and brands. According to market consecutive researches by the Monogram Group, a Chicago-based advertising agency, in 2007, 2009, 2011 and 2012, American consumers' willingness to purchase Chinese products across all categories except PC remained the same or became worse during 2007-2012. The only sector in which Americans were more likely to purchase was personal computers, maybe due to the brand building of Lenovo.[230]
Moreover, many M&A deals have failed because companies underestimated the challenges and failed to restructure the company.
Case 1: Shanghai Auto acquired 48.9% of Korean Ssangyong at US$500 million in 2004, making it the most ambitious acquisition in Chinese auto industry at the time. Shanghai Auto wanted the brand and technology to expand its footprint in China. However, the cultural difference, the objection to transfer the technology and the failed sales of new SUV model put Shanghai Auto's ambition of expansion in jeopardy. It caused huge conflict between Ssangyong employees and Shanghai Auto as things didn't go well as planned. And the 2008 global economic crisis put Ssangyong on a survival mode, let alone expansion. After the negotiation with the labor union to reduce wages failed, Shanghai Auto decided to exit from Ssangyong and didn't get a penny back for their US$500 million investment.[231][232]
Case 2: In 2004, TCL, the largest TV manufacturer and one of the fastest growing companies in China, acquired TV business including Thomson and RCA brand from Thomson Electronics of France to form a joint vendure called TCL-Thomson Electronics (TTE). For the coming two years, the company recorded huge loss, especially in Europe. Several factors contributed to the failure:
- Failure of Due Diligence. Right after TCL acquired Thomson's TV business, the TV market shifted to LCD technology, put Thomson out of date. As CEO of TCL, Dongsheng Li, said in 2012 "They betted on the wrong thing where the market would go. They thought Thomson's DLP could be the best choice."
- Lack of understanding of rules and regulations. According to the book Resumption of Trading by Chong Chen, soon after acquisition, Thomson found it in a situation that they couldn’t recruit the talents they wanted and can't fire ones they didn't want.
- Underestimate of the challenges in cultural difference. Xuesong Tong, vice president of TTE, said in an interview with "China Operation" newspaper in 2005: "The French look down upon their Chinese boss. For example, they wanted to share the design model with TTE, but French just dislike it even though it is a popular one in US market. Also, French feel superior in their language and don't want to speak English, which created huge problem in communication. It takes hours to discuss simple issues and can't reach agreement."
- According to Scott Markman, president of Monogram, Chinese companies often moved their business model to developed countries and it doesn't work. Thomson has the problem, they are very good and distribution and operation in China but France and Europe is a totally different world.
Mergers and acquisitions
From 1993 to 2010, Chinese companies have been involved as either an acquiror or acquired company in 25,284 mergers and acquisitions with a total known value of US$969 billion.[233] The number and value of deals hit a new record in 2010. The number of deals that happened in 2010 has been 3,640, which is an increase of 17% compared to 2009. The value of deals in 2010 was US$196 billion, which is an increase of 25% compared to the year before.
Demographics
Since the 1950s medical care, public hygiene and sanitation improved considerably, and epidemics were controlled. Consecutive generations continuously experienced better health. The population growth rate surged as the mortality rate dropped more rapidly than the birth rate. China's massive population has always been a major difficulty for the government as it has struggled to provide for it. In the 1950s, food supply was inadequate and the standard of living was generally low. This spurred the authorities to initiate a major birth control program. The Great Leap Forward industrial plan in 1958–60 was partially responsible for a huge famine that caused the death rate to surpass the birth rate, and by 1960, the overall population was declining. A second population control drive began in 1962 with major efforts focused on promoting late marriages and the use of contraceptives. By 1963 the country was in the beginning of recovery from the famine and the birth rate soared to its highest since 1949 with an annual population growth rate of 3%. In 1966, the Cultural Revolution suspended this second family planning program, but resumed four years later with the third attempt by making later marriage and family size limitation an obligation. Since 1970, the efforts have been much more effective. The third family planning program continued until 1979 when the one child per family policy was implemented. By the early 1980s, China's population reached around 1 billion and by the early 2000s, surpassed 1.3 billion. In the 1980s, the average overall population growth was around 1.5%. In the 1990s, this fell to about 1%. Today it is about 0.6%.[234] China's population growth rate is now among the lowest for a developing country, although, due to its large population, annual net population growth is still considerable. One demographic consequence of the one-child policy is that China is now one of the most rapidly ageing countries in the world.
From 100 million to 150 million surplus rural workers are adrift between the villages and the cities, many subsisting through part-time, low-paying jobs.
According to the latest Forbes China Rich List (2007), China had 66 billionaires, the second largest number after the United States, which had 415. In the 2006 Forbes Rich List it stated that there were 15 Chinese billionaires.[235] In the latest 2007 Hurun Report, it lists 106 billionaires in China.[236]
Labor force
In 2012, for the first time, according to statistics released by China's National Bureau of Statistics in January 2013, the size of the labor force, people aged 15 to 59, in China shrank slightly to 937.27 million people, a decrease of 3.45 million from 2011. This trend, resulting from China's one-child policy of population control, is anticipated to continue to at least 2030.
On 29 October 2015, Xinhua, China's state news agency, reported a change in the existing law to a two-child policy, citing a statement from the Communist Party of China, and the new law is effective from 1 January 2016 after it was passed in the standing committee of the National People's Congress on 27 December 2015.[237]
Transportation and infrastructure
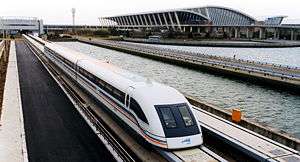
Development of the country's transportation infrastructure is given a high priority because it is so strategically tied to the national economy and national defense. Regardless, the transportation infrastructure is still not fully developed in many aspects and areas, and it constitutes a major hindrance on economic growth and the efficient logistical movement of goods and people. China's transportation policy, influenced by political, military, and economic concerns, have undergone major changes since 1949.[238]
Immediately after the People's Republic was founded, the primary goal was to repair existing transportation infrastructure in order to meet military transport and logistics needs as well as to strengthen territorial integrity. During most of the 1950s, new road and rail links were built, while at the same time old ones were improved. During the 1960s much of the improvement of regional transportation became the responsibility of the local governments, and many small railways were constructed. Emphasis was also placed on developing transportation in remote rural, mountainous, and forested areas, in order to integrate poorer regions of the country and to help promote economies of scale in the agricultural sector.
Before the reform era began in the late 1970s, China's transportation links were mostly concentrated in the coastal areas and access to the inner regions was generally poor. This situation has been improved considerably since then, as railways and highways have been built in the remote and frontier regions of the northwest and southwest. At the same time, the development of international transportation was also pursued, and the scope of ocean shipping was broadened considerably.
Freight haulage is mainly provided by rail transport. The rail sector is monopolized by China Railway, which is controlled by the Ministry of Railways and there is wide variation in services provided. In late 2007 China became one of the few countries in the world to launch its own indigenously developed high-speed train.[239] As rail capacity is struggling to meet demand for the transport of goods and raw materials such as coal, air routes, roads and waterways are rapidly being developed to provide an increasing proportion of China's overall transportation needs.[240]
Some economic experts have argued that the development gap between China and other emerging economies such as Brazil, Argentina and India can be attributed to a large extent to China's early focus on ambitious infrastructure projects: while China invested roughly 9% of its GDP on infrastructure in the 1990s and 2000s, most emerging economies invested only 2% to 5% of their GDP. This considerable spending gap allowed the Chinese economy to grow at near optimal conditions while many South American economies suffered from various development bottlenecks such as poor transportation networks, aging power grids and mediocre schools.[241]
Science and technology
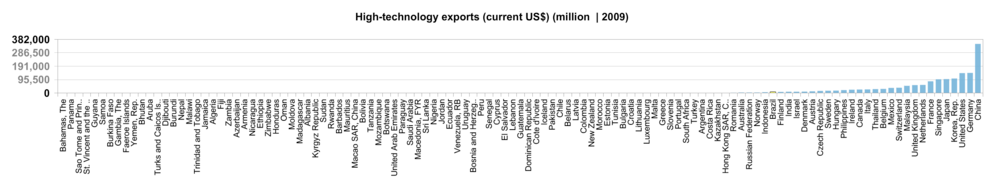
Science and technology in China has in recent decades developed rapidly. The Chinese government has placed emphasis through funding, reform, and societal status on science and technology as a fundamental part of the socio-economic development of the country as well as for national prestige. China has made rapid advances in areas such as education, infrastructure, high-tech manufacturing, academic publishing, patents and commercial applications and is now in some areas and by some measures a world leader. China is now increasingly targeting indigenous innovation and aims to reform remaining weaknesses. These initiatives are dependent on attracting highly educated overseas Chinese back to China to work in the innovation economy and to teach the next generation of Chinese students.
See also
- Center for China in the World Economy, Tsinghua University, Beijing
- Central Financial Work Commission
- China Beijing Equity Exchange
- China Circle
- China Economic Databases (CED) (China Studies Center, National Chengchi University, Taiwan)
- China Milan Equity Exchange
- Economy of the Han Dynasty
- Economy of the Ming Dynasty
- Economy of the Song Dynasty
- Elizabeth Economy (China economy and environment expert)
- Energy policy of China
- Grasping the large, letting go of the small (policy)
- Guo jin min tui
- Historical GDP
- Hukou system
- Imperial Bank of China
- Leading stocks
- List of companies of the People's Republic of China
- List of the largest companies of China
- Oil shale in China
- Panda bonds
- Rural credit cooperative
- Silk Road
- The Chinese Economy: Transitions and Growth (book)
- Township and Village Enterprises (TVEs)
- Three Rural Issues
- Tuangou
- Yangtze River Delta
References
- 1 2 3 4 5 6 "IMF report for China". International Monetary Fund. October 2018.
- ↑ "World Bank forecast for China, June 2018 (p. 151)" (PDF). World Bank. Retrieved 11 September 2018.
- ↑ "GDP - Composition, by Sector of Origin". CIA World Factbook. Retrieved 20 July 2017.
- ↑ "Inflation in China in March 2018". National Bureau of Statistics. Retrieved 31 March 2018.
- ↑ "World Development Indicators". World Bank. 4 December 2015. Retrieved 4 December 2015.
- ↑ "China's Gini coefficient exceeded 0.4 in 2017". People's Daily. 6 February 2018. Retrieved 2 April 2018.
- ↑ "Human Development Report 2016" (PDF). United Nations Development Program. Retrieved 21 March 2017.
- ↑ "Labor force, total". World Bank. Retrieved 2 September 2016.
- ↑ "National Data". data.stats.gov.cn.
- ↑ "Ease of Doing Business in China". doingbusiness.org. Retrieved 23 January 2017.
- 1 2 "National Data".
- 1 2 3 4 "China - WTO Statistics Database". World Trade Organization. Retrieved 1 March 2017.
- ↑ "Foreign investment in China - Santandertrade.com". en.portal.santandertrade.com. Retrieved 20 January 2018.
- ↑ "China's external debt expected to grow, risks controllable". China Daily. Retrieved 1 April 2017.
- ↑ "Public Debt". Central Intelligence Agency. Retrieved 14 June 2018.
- ↑ "Sovereigns rating list". Standard & Poor's. 26 January 2017. Retrieved 26 September 2017.
On Jan. 26, 2017, S&P Global Ratings affirmed the 'AA-' long-term and 'A-1+' short-term sovereign credit ratings on China. The outlook on the long-term rating remains negative
- ↑ "Moody's downgrades China's rating to A1 from Aa3 and changes outlook to stable from negative". moodys.com. 24 May 2017. Retrieved 23 September 2017.
- ↑ "Fitch - Complete Sovereign Rating History". fitchratings.com. Retrieved 25 February 2013.
- ↑ "China Foreign Reserves Post 12th Straight Gain as Yuan Rises". Bloomberg. 7 February 2018.
- ↑ "The Changing of the Guard: China's New Leadership". INSEAD Knowledge.
- ↑ "How is China shaping the global economic order?". CSIS China Power.
- ↑ "GDP ranking". World Bank.
- ↑ "Report for Selected Country Groups and Subjects (PPP valuation of country GDP)". IMF. Retrieved 24 October 2017.
- ↑ Nelson D. Schwartz; Rachel Abrams (24 August 2015). "Advisers Work to Calm Fearful Investors". The New York Times. Retrieved 25 August 2015.
Even the most pessimistic observers think China will still grow by 4 or 5 percent
- ↑ "Report for Selected Countries and Subjects". International Monetary Fund. 16 April 2013. Retrieved 16 April 2013.
- ↑ uscc.org.
- ↑ mansfieldfdn.org.
- ↑ Anthony, Craig (12 September 2016). "10 Countries With The Most Natural Resources". Investopedia.
- ↑ "China banking sector's total assets reach 252 trln yuan - Xinhua | English.news.cn". www.xinhuanet.com. Retrieved 2018-04-07.
- ↑ "China Total Deposits | Economic Indicators". www.ceicdata.com. Retrieved 2018-04-07.
- ↑ "China Widens Lead as World's Largest Manufacturer". thomasnet.com.
- ↑ "China: Fastest Growing Consumer Market in the World". IMF direct - The IMF Blog.
- ↑ intracen.org.
- ↑ "China's Economy Is Catching Up to the U.S."
- ↑ "Trade recovery expected in 2017 and 2018, amid policy uncertainty". Geneva, Switzerland: World Trade Organization. 12 April 2017. Retrieved 2017-06-22.
- ↑ "China - Member information". WTO.
- ↑ "China, Switzerland sign free trade agreement". eubusiness.com.
- ↑ As Zhejiang, Jiangsu, Fujian and mainly Guangdong
- ↑ 2011 presentations on the state of the Chinese economy. USC US-China Institute. Retrieved 28 February 2012 – via Youtube.
- ↑ "2011 USC US-China Institute conference on the State of the Chinese Economy, complete schedule and presentations". USC US-China Institute. Retrieved 28 February 2012.
- ↑ site resources.world bank.org.
- ↑ cfr.org.
- ↑ "Worst air pollution in China and the U.S." – via www.washingtonpost.com.
- ↑ http://www.lse.ac.uk/GranthamInstitute/wp-content/uploads/2014/05/Green-and-Stern-policy-paper-May-20141.pdf '...China is...planning to grow its high technology and high value-added industries. It is championing seven "strategic emerging industries": energy efficient and environmental technologies; new energy; new-energy vehicles; next generation information technology; biotechnology; advanced equipment manufacture; and new materials.'
- ↑ "Xi Jinping's Chinese Dream". The New York Times. 4 June 2013.
- ↑ "Currency Reform" (PDF). brookings.edu.
- ↑ "Shenzhen is a hothouse of innovation". The Economist.
- ↑ Chen, Xiangming; Ogan, Taylor (22 December 2016). "China's Emerging Silicon Valley: How and Why Has Shenzhen Become a Global Innovation Centre". The European Financial Review – via ResearchGate.
- ↑ Murphy, Flynn (17 May 2017). "China's Silicon Valley". doi:10.1038/545S29a.
- ↑ "The next Silicon Valley? It could be here". 11 July 2017.
- ↑ "China's Economic Numbers Have a Credibility Problem".
- ↑ "Can you still trust China’s economic data after province admits cooking books?".
- ↑ "Why Chinese officials are suddenly coming clean over cooking the books".
- ↑ "What is China's actual GDP? Experts weigh in".
- ↑ "WSJ Survey: China's Growth Statements Make U.S. Economists Skeptical".
- ↑ Clark, Hunter; Pinkovskiy, Maxim; Sala-i-Martin, Xavier (April 2017). "China's GDP Growth May be Understated". NBER Working Paper No. 23323. doi:10.3386/w23323.
- ↑ "Is China Cooking the Books on Economic Expansion?".
- 1 2 GDP 2017 is quarterly data (see China National Data), the official webnet: National Data - China NBS Data - Regional - quarterly by provinces - National Accounts)
- 1 2 Exchange rate in 2017 (nominal): the annual average exchange rate (nominal) is CNY 6.7518 per US dollar in 2017, publicated on "Statistical Communiqué of the People's Republic of China on the 2017 National Economic and Social Development"; PPP: the purchasing power parity is CNY 3.5063 per Intl. dollar, according to IMF-WEO (April 2018).
- ↑ "World Bank World Development Indicators". World Bank. Retrieved 8 December 2014.
- ↑ Jalil, Abdul and Feridun, Mete (2011) Long-run relationship between income inequality and financial development in China. Journal of the Asia Pacific Economy, 16 (2). pp. 202-214. ISSN 1354-7860 (print), 1469-9648 (online) (doi:10.1080/13547860.2011.564745)
- ↑ "New stimulus measures by China to boost economic growth". Beijing Bulletin. Retrieved 12 June 2014.
- ↑ https://www.reuters.com/article/us-china-economy-data/another-chinese-city-admits-fake-economic-data-idUSKBN1F60I1
- ↑ http://www.scmp.com/news/china/economy/article/2063906/can-you-still-trust-chinas-economic-data-after-province-admits
- ↑ http://www.scmp.com/news/china/economy/article/2128484/why-chinese-officials-are-suddenly-coming-clean-over-cooking
- ↑ https://www.bloomberg.com/businessweek
- ↑ https://www.wsj.com/articles/wsj-survey-chinas-growth-statements-make-u-s-economists-skeptical-1441980001
- ↑ https://blogs.wsj.com/economics/2015/09/11/what-do-u-s-economists-think-of-official-china-statistics-only-a-fool-would-believe-them/
- ↑ https://www.usnews.com/news/articles/2015/11/02/is-china-cooking-the-books-on-economic-expansion
- ↑ https://www.cnbc.com/2016/01/19/what-is-chinas-actual-gdp-experts-weigh-in.html
- ↑ "Edit/Review Countries". International Monetary Fund. 14 September 2006. Retrieved 27 December 2011.
- ↑ "China's gross domestic product (GDP) growth". Chinability.com. 5 November 2011. Archived from the original on 11 February 2012. Retrieved 28 February 2012.
- ↑ Chinese GDP and CPI. Measuring Worth. Retrieved on 6 August 2010.
- ↑ The annual data of China'GDP published on China NBS: National data - annual - national accounts - Cross Domestic Product; Figures for the current year 2015 are based on the "Statistical Communiqué of the People's Republic of China on the 2015 National Economic and Social Development".
- ↑ China NBS / Bulletin on Reforming China 's GDP Accounting and Data Release System: stats.gov.cn (12-Jan-17) or China NBS Announcement: GDP Revision according to SNA2008 (Chinese), China revises Historical GDP according to SNA2008; see finance.qq.com, sina.com.cn
- ↑ Purchasing power parity (PPP) for Chinese yuan is estimate according to IMF WEO (April 2018) data; Exchange rate of CN¥ to US$ is according to State Administration of Foreign Exchange, published on China Statistical Yearbook.
- ↑ "Report for Selected Countries and Subjects". www.imf.org. Retrieved 2018-09-17.
- ↑ Hiroshi Satō. Unemployment, Inequality and Poverty in Urban China. (2006) Routledge. ISBN 0-415-33872-7
- ↑ Keith Bradsher (5 July 2010), "China Fears Consumer Class Impact on Global Warming", The New York Times
- ↑ "General government gross debt for China". 13 December 2017.
- ↑ "People's Republic of China 2015 Article IV Consultation - Press Release; Staff Report; and Statement by the Executive Director for the PRC" IMF Country Report No. 15/234
- 1 2 World Economic Outlook Database, October 2015, IMF
- ↑ "china - World Bank Search". search.worldbank.org.
- ↑ "The great hole of China", The Economist, 18 October 2014
- ↑ Kenneth Rapoza (9 May 2015), "China's Total Debt Load Now Over 280% Of GDP", Forbes
- ↑ Ye Xie (15 July 2015), "China's Debt-to-GDP Ratio Just Climbed to a Record High", Bloomberg
- ↑ Adair Turner (3 December 2015), "How will China tackle its debt dilemma?", Institute for New Economic Thinking, World Economic Forum
- ↑ IMF Country Report No. 15/234, People's Republic of China: Staff Report for the 2015 Article IV Consultation (July 7, 2015).
- ↑ Noah Smith, Be Scared of China's Debt, Not Its Stocks, Bloomberg View (7 January 2016).
- ↑ Chinese Banks Look to Shadow Banking for Growth: Risks increase as third-quarter earnings show banks pushing deeper into gray markets, The Wall Street Journal (30 October 2015), p. 76.
- ↑ Xiaoyi Shao and Lisa Twaronite (7 March 2016), "China's fiscal income to slow but room for more government debt - Finance Minister", Reuters
- ↑ Joyce Ho (19 January 2016), "Bernanke downplays China impact on world economy" Nikkei Asian Review
- ↑ Bill Mitchell (20 January 2016), "The government really is instrumental in creating growth"
- ↑ An, Alex and An, David, "Media control and the Erosion of an Accountable Party-State in China". China Brief, 7 October 2008.
- ↑ "Consumer Price Index (CPI) Kept Growth in November" National Bureau of Statistics of China 11 December 2007 13:14:55
- ↑ Keith Bradsher (19 February 2008), "China's Inflation Rose to 7.1% in January", The New York Times
- ↑ Consumer Price Index (CPI) Expanded in February National Bureau of Statistics of China 11 March 2008 14:53:02
- ↑ Keith Bradsher (14 November 2007), "Chinese Prices Surge Again, Despite New Controls", The New York Times.
- ↑ Keith Bradsher (11 December 2007), "Inflation Picks Up in China; Trade Gap Grows", The New York Times.
- ↑ ""China vows to stabilize prices, prevent price hikes"] Published 9 January 2008, accessed 9 January 2008, on GOV.cn, Chinese Government's Official Web Portal". Xinhua.
- ↑ Jim Yardley (9 January 2008), "Fighting Inflation, China Freezes Energy Prices", The New York Times
- ↑ Keith Bradsher (8 June 2007). "Rise in China's Pork Prices Signals End to Cheap Output". The New York Times. p. C1.
- ↑ "China inflation hits 11-year high". BBC News. 19 February 2008. Retrieved 19 February 2008.
- ↑ "China's inflation at decade high". CNN. 10 March 2008. Archived from the original on 15 March 2008. Retrieved 11 March 2008.
- ↑ "Stocks surge after China stimulus". BBC News. 10 November 2008. Retrieved 1 May 2010.
- ↑ Cara Anna (12 December 2010). "China inflation rate at 5.1 percent". Associated Press. Retrieved 30 December 2010.
- ↑ Eckstein, Alexander (1976). China's Economic Development: The Interplay of Scarcity and Ideology. University of Michigan Press. ISBN 0-472-08310-4.
- ↑ DeWeaver, Mark (2012). Animal Spirits with Chinese Characteristics: Investment Booms and Busts in the World's Emerging Economic Giant. Palgrave Macmillan. ISBN 978-0230115699.
- ↑ Zhou, Li'an (2004), "Jinsheng Boyi Zhong Zhengfu Guanyuan de Jili yu Hezuo" [Cooperation and Government Officials’ Incentives in Promotion Competitions], Jingji Yanjiu [Economic Research], 6: 33-40.
- ↑ Zhou, Li’an (2007), "Zhongguo Difang Guanyuan de Jinsheng Jinbiaosai Moshi Yanjiu" [A Tournament Model of Local Government Official Promotions], Jingji Yanjiu [Economic Research], 7: 36-50.
- ↑ Jin, Sanlin (2004), "Chengben Ruanyueshu Shi Touzi Guore de Zhongyau Yuanyin" [Soft Budget Constraints Are an Important Cause of Investment Overheating], Zhongguo Touzi [China Investment], June: 37-39.
- ↑ Fan Gang; Zhang Xiaojing (2004). Zenme You Guo Re Le? Xin Yilun Jingji Bodong yu Hongguan Tiaokong Fenxi [Why Is There Overheating Yet Again? The New Round of Economic Fluctuation and an Analysis of Macroeconomic Adjustment]. Jiangxi People's Publishing House. ISBN 7-210-03077-8.
- ↑ DeWeaver, 2012
- ↑ p.205 Chui and Lewis Reforming China's State Owned Enterprises and Banks 2006
- ↑ p.11 Chui and Lewis Reforming China's State Owned Enterprises and Banks 2006
- ↑ Tatlow, Didi Kirsten (21 September 2011). "More Stimulus May Not Be an Option for China". The New York Times. Retrieved 22 September 2011.
- ↑ "The bees get busy". The Economist. 3 March 2012.
- ↑ Lingling Wei (29 February 2012). "Yuan Move Chips at Capital Controls". The Wall Street Journal.
- ↑ "Chinese stock market pushes above $4.48 trillion mark".
- ↑ Bettina Wassener; Chis Buckley (20 August 2013). "New Chinese Agency to Increase Financial Coordination". The New York Times. Retrieved 21 August 2013.
- 1 2 Jalil, Abdul, Feridun, Mete and Ma, Ying (2010) Finance-growth nexus in China revisited: New evidence from principal components and ARDL bounds tests. International Review of Economics & Finance, 19 (2). pp. 189-195. ISSN 1059-0560 (doi:10.1016/j.iref.2009.10.005)
- ↑ Evan Osnos (15 July 2015). "The Real Risk Behind China's Stock-Market Drama". The New Yorker. Retrieved 18 July 2015.
Wang mocked fears of a bubble—"What's a bubble? Tulips and Bitcoins are bubbles
- ↑ Neil Gough (15 July 2015). "Cooling of China's Stock Market Dents Major Driver of Economic Growth". The New York Times. Retrieved 16 July 2015.
In the first quarter of the year — the most recent comparison available — the output of the finance industry accounted for 1.3 percentage points of China's 7 percent growth rate.
- ↑ editorial (15 June 2015). "China's Unsettling Stock Market Boom". The New York Times. Retrieved 15 June 2015.
- ↑ Keith Bradsher; Chris Buckley (July 4, 2015). "China Moves to Stabilize Stock Markets; Initial Offerings Halted". Retrieved July 5, 2015.
the country's biggest brokerage firms unveiled a government-endorsed plan on Saturday to buy shares starting on Monday
- ↑ Keith Bradsher; Chris Buckley (July 5, 2015). "China's Market Rout Is a Double Threat". Retrieved July 5, 2015.
novices have rushed to join a national fever of speculation
- 1 2 Jiang Fei; Zhang Yuzhe; Yang Gang; Yue Yue; Zhang Yu; Wu Hongyuran (28 July 2015). "Villain or Hero for Stock Market Saga?". Caixin. Retrieved 1 August 2015.
People with knowledge of the agency's operations said it bought at least 1 trillion yuan worth of shares between July 6 and 10. Of this amount, about 300 billion yuan was spent on July 8.
- ↑ James B. Stewart (July 9, 2015). "Why China's Stock Market Bailout Just Might Work". The New York Times. Retrieved 11 July 2015.
- ↑ Keith Bradsher (10 July 2015). "Signs of a Growing Hush in China's Economy". Retrieved 11 July 2015.
...$3.1 trillion in market value, much of it financed with borrowed money, has been erased since mid-June.
- ↑ Jiang Fei; Liu Caiping; Yue Yue (16 July 2015). "How Beijing Intervened to Save China's Stocks". Caixin. Retrieved 18 July 2015.
- ↑ David Barboza (July 31, 2015). "Shares in Mainland China End Worst Month in 6 Years". The New York Times. Retrieved 1 August 2015.
- ↑ "China's Currency: Brief Overview of U.S. Options CRS Report for Congress by Jonathan E. Sanford Congressional Research Service The Library of Congress Order Code RS22338 29 November 2005
- ↑ Lipman, Joshua Klein (April 2011). "Law of Yuan Price: Estimating Equilibrium of the Renminbi" (PDF). Michigan Journal of Business. 4 (2). Retrieved 23 May 2011.
- ↑ Worstall, Tim. "Bad News For Allegations Of Currency Manipulation: IMF Says China's Yuan Correctly Valued".
- ↑ Keith Bradsher )29 December 2007), "China Lets Currency Appreciate a Bit Faster" The New York Times
- ↑ Neil Gough (13 August 2015). "China Seeks to Calm Markets as It Devalues Currency for 3rd Consecutive Day". The New York Times. Retrieved 13 August 2015.
...policy makers say they will give market forces greater sway over currency's value. The official exchange rate will be set based on the renminbi's trading performance....
- ↑ "Progress for Reform as Yuan Inches toward SDR". Caixin. 19 August 2015. Retrieved 19 August 2015.
- ↑ "RMB now 8th most widely traded currency in the world". Society for Worldwide Interbank Financial Telecommunication. Retrieved 10 October 2013.
- ↑ Talley, Ian,"Chinese Yuan Should Be an IMF Reserve Currency, Christine Lagarde Says", The Wall Street Journal, 13 November 2015, retrieved 2015-11-14.
- ↑ "Output of Farming, Animal Husbandry and Fishery". China Statistical Book. 2005.
- ↑ "WFP – Where we work – China". Archived from the original on 25 October 2005.
- ↑ Plantation Study in China: Research Outline Archived 16 February 2008 at the Wayback Machine. Forest Conservation Project, Institute for Global Environmental Strategies, Japan; February 2006.
- ↑ Stanway, David (14 November 2012). "Analysis: China turns to machines as farmers seek fresh fields". Reuters. Retrieved 26 November 2017.
- ↑ Cheng, Fang. "Development of Agricultural Mechanization in China" (PDF). Eurasian Food Economy Forum 2017. UN Food and Agriculture Organization. Retrieved 26 November 2017.
- ↑ Schaer, Lilian. "China powers up: The world's most populous country gets serious about farming machinery". Country Guide. Retrieved 26 November 2017.
- ↑ Neil Gough (11 June 2015). "Idle Home Builders Hold China's Economy Back". The New York Times.
By some economists' estimates, real estate and related industries account for more than 20 percent of China's gross domestic product
- 1 2 https://www.bp.com/en/global/corporate/energy-economics/statistical-review-of-world-energy/downloads.html
- 1 2 data.stats.gov.cn
- ↑ World Nuclear Association. Nuclear Power in China (November 2007)
- ↑ Case Study of Electrification: China – Worldwide Electrification from the 1950s to the 1970s. (Chapter 2; page 33).
- ↑ MSN Encarta. Asia: Mineral Resources. Archived 31 October 2009.
- 1 2 TED Case Studies. China and Coal
- ↑ Heping, Xie; Tad S. Golosinski (1999). Mining Science and Technology '99. Taylor & Francis. pp. 252–256. ISBN 90-5809-067-1.
- ↑ Creedy, David; Lijie, Wang; Xinquan, Zhou; Haibin, Liu; Campbell, Gary (February 2006). "Transforming China's coal mines: A case history of the Shuangliu Mine". Natural Resources Forum. Blackwell Publishing. 30 (1): 15–26. doi:10.1111/j.1477-8947.2006.00154.x.
- ↑ Jane Perlez; Yufan Huang (16 December 2015). "Mass Layoffs in China's Coal Country Threaten Unrest". The New York Times. Retrieved 17 December 2015.
The coal industry is hurting nationwide, as coal prices have fallen nearly 60 percent since 2011, said Deng Shun, an analyst at ICIS C1 Energy, a consultancy based in Shanghai.
- ↑ "China overtakes US as the biggest importer of oil". BBC News. 10 October 2013. Retrieved 11 October 2013.
- ↑ Xinhua. China to calculate oil and gas reserves 25 November 2004.
- ↑ "Puguang Named 2nd Largest Gas Field". Chinapage.com. Archived from the original on 8 May 2013. Retrieved 28 February 2012.
- ↑ Kaoru YAMAGUCHI, Keii CHO. Natural Gas in China IEEJ: August 2003.
- ↑ Jalil, Abdul and Feridun, Mete (2011) "The impact of growth, energy and financial development on the environment in China: a cointegration analysis". Energy Economics, 33 (2). pp. 284-291. ISSN 0140-9883 (doi:10.1016/j.eneco.2010.10.003)
- ↑ "Usgs annual phosphate review" (PDF).
- ↑ "CIA.gov". CIA. Retrieved 28 February 2012.
- ↑ Bill Gates (12 June 2014), Have You Hugged a Concrete Pillar Today?
- ↑ "China tops US in manufacturing: study". Google.com. 14 March 2011. Archived from the original on 20 March 2011. Retrieved 28 February 2012.
- ↑ Marsh, Peter (13 March 2011). "China noses ahead as top goods producer". Financial Times. Retrieved 27 December 2011.
- ↑ Keith Bradsher (12 November 2012). "'Social Risk' Test Ordered by China for Big Projects". The New York Times. Retrieved 13 November 2012.
- ↑ Keith Bradsher (6 November 2012). "Facing Protests, China's Business Investment Slows". The New York Times. Retrieved 7 November 2012.
- ↑ "Florida Forestry China Trade Mission Report" (PDF). Retrieved 28 February 2012.
- ↑ "Industrial output growth 1978–2006". Chinability.com. Archived from the original on 28 February 2012. Retrieved 28 February 2012.
- ↑ "14–19: Output of Major Industrial Products". Allcountries.org. 26 April 2006. Retrieved 28 February 2012.
- ↑ Shanghai's GDP Keeps Growing Xinhua News Agency 1 February 2003.
- 1 2 "In China's Floundering Steel Sector, the Burden of Politics". The New York Times. Reuters. 3 May 2012. Retrieved 4 May 2012.
- ↑ Steel exports fall in 2008 – People's Daily Online. English.people.com.cn (12 February 2009). Retrieved on 6 August 2010.
- ↑ Simon Rabinovitch; Leslie Hook (4 June 2012). "China warns on lending to steel plants". Financial Times. Retrieved 4 June 2012.
- ↑ "China 2010 Auto Sales Reach 18 Million, Extend Lead". Bloomberg. 10 January 2011. Retrieved 27 December 2011.
- ↑ Gasnier, Matt (16 February 2013). "World 2012 – The 20 biggest car markets: Thailand shoots up!". bestsellingcarsblog.com. Retrieved 16 February 2013.
- ↑ Alon, Ilan, Marc Fetscherin, Marc Sardy (2008), "Geely Motors: A Chinese Automaker Enters International Markets", International Journal of Chinese Culture and Management, 1 (4), 489–498.
- ↑ Keith Bradsher (4 October 2012). "Glut of Solar Panels Poses a New Threat to China". The New York Times. Retrieved 5 October 2012.
- 1 2 China Daily (10 July 2010). "Nation becomes world's biggest sex-toy producer". Archived from the original on 15 September 2010. Retrieved 11 July 2010.
- ↑ Fletcher, Owen (24 August 2011). "China Passes U.S. as World's Biggest PC Market". The Wall Street Journal.
- ↑ Alon, Ilan, ed. (2003). Chinese Economic Transition and International Marketing Strategy. Westport, Conn.: Praeger. ISBN 9781567205879.
- ↑ Roberto A. Ferdman (3 July 2013). "The world's new largest building is four times the size of Vatican City". Quartz. Retrieved 4 July 2013.
- ↑ "Internet users to log in at world No.1". China Daily. 24 January 2007. Retrieved 28 February 2012.
- ↑ "Emerging giants spur telecom boom", BBC News, 12 December 2007.
- ↑ "China Travel & Tourism Economic Impact Report" (2013), World Travel and Tourism Council.
- ↑ "UNWTO Tourism Highlights" Archived 18 July 2013 at the Wayback Machine., World Tourism Organisation, 2013.
- ↑ "Continued growth in Chinese business travel next year: GBTA study". TTGmice. October 2012. Retrieved 9 November 2012.
- ↑ "China – Let the Good Times Roll", IBISWorld Newsletter, March 2008
- 1 2 Qu Yunxu (26 February 2013). "China's Frills and Posh Market Springs a Leak: Wealthy Chinese consumers continue to drive global demand for luxury goods, but the engine is losing steam". Caixin. Retrieved 26 February 2013.
- ↑ Andrew Jacobs (27 March 2013). "Elite in China Face Austerity Under Xi's Rule". The New York Times. Retrieved 28 March 2013.
- ↑ Phil Muncaster (18 August 2012). "Exposing China's vast underground economy". The Register. Retrieved 25 September 2013.
- ↑ Phil Muncaster (19 July 2012). "China lays out glorious eight-point infosec masterplan". The Register. Retrieved 25 September 2013.
- ↑ Vice-Premier Li Xiannian's speech, published in the Hong Kong newspaper Ming Pao on 14 June 1979.
- ↑ "Average Wage of On-Duty Staff and Workers in Urban Areas Jumped in the First Three Quarters" Archived 17 July 2010 at the Wayback Machine.. National Bureau of Statistics of China. 2007-10-29, 15:35:2.
- ↑ Michael Schuman (22 July 2016). "Is China Stealing Jobs? It May Be Losing Them, Instead". The New York Times. Retrieved 23 July 2016.
- ↑ "Honda suspends production in China due to strike" Archived 29 May 2010 at the Wayback Machine. Associated Press article on Businessweek.com, 28 May 2010
- ↑ Keith Bradsher (28 May 2010), "Workers Squeezing Honda With Especially Costly Strike" The New York Times
- ↑ Keith Bradsher and David Barboza (28 May 2010), "Strike in China Highlights Gap in Workers' Pay", The New York Times
- ↑ "Honda's China plants halt production as workers strike for higher salaries" Archived 7 June 2011 at the Wayback Machine. Xinhua article in China Daily updated: 28 May 2010 09:42
- ↑ "Foxconn Raises Worker Pay 30%" article from Bloomberg News printed in The New York Times 1 June 2010
- ↑ "China is ageing and growing more slowly". Al Jazeera, 28 April 2011.
- ↑ Boren, Zachary (18 January 2014). "China's millionaire exodus as wealthy flee with America the preferred destination". The Independent. London. Retrieved 14 September 2014.
- ↑ "Pollution sees middle, upper class exodus from China's major cities". 12 February 2014. Retrieved 11 February 2014.
- ↑ Johnson, Ian. "Wary of Future, Professionals Leave China in Record Numbers". NYT, 31 October 2012.
- ↑ "Migration gap in China alarming: report". Want China Times. 23 January 2014. Retrieved 23 January 2014.
- ↑ Pike, John. "China Earns Poor Score on Corruption Index". globalsecurity.org.
- ↑ "China promises rise in minimum wage to close income gap" BBC News, 6 February 2013
- ↑ China emerges India's top trade partner. News.tootoo.com (25 March 2008). Retrieved on 6 August 2010.
- ↑ "Trade between China and Russia could exceed $40 bln in 2007". The Voice of Russia. 2 August 2007.
- ↑ China Statistical Yearbook 2007, Table 18-14: http://www.stats.gov.cn/tjsj/ndsj/2007/indexeh.htm
- ↑ China Statistical Yearbook 2007, Table 18-13: http://www.stats.gov.cn/tjsj/ndsj/2007/indexeh.htm
- ↑ http://www.faz.net/aktuell/wirtschaft/china-oeffnet-finanzmarkt-fuer-auslaender-nach-trump-besuch-15285864.html
- ↑ "Foreign investment in China rebounds –". International Herald Tribune. 15 January 2007. Retrieved 28 February 2012.
- ↑ "Foreign direct investment, net inflows (BoP, current US$) | Data | Table". World Bank. Retrieved 2016-01-29.
- ↑ Enda Curran; Jonathan Browning. "Foreign Investment Into China Falls as Weaker Yuan Dents Inflows". Bloomberg. Retrieved 2016-01-29.
- ↑ Hannon, Paul. "U.S. Overtakes China as Top Destination for Foreign Investment". The Wall Street Journal. Retrieved 2016-01-29.
- ↑ 2016 China Business Climate Survey. Beijing, China: American Chamber of Commerce in China. 2016. p. 4.
- ↑ Warner Bros to withdraw from Chinese mainland (Xinhuanet.com, with source from China Radio International)
- ↑ "Shanghai's New Free Trade Zone – General Plan and Regulations", China Briefing, Shanghai, 28 September 2013
- ↑ "China opens free trade zone in Shanghai". Deutsche Welle.
- ↑ "中国(上海)自由贸易试验区门户网站" [China (Shanghai) Free Trade Experimental Zone portal] (in Chinese). waigaoqiao.gov.cn. Archived from the original on 2001-03-02.
- ↑ "Shanghai Releases 'Negative List' for Foreign Investment in Shanghai Free Trade Zone", China Briefing, Shanghai, 9 September 2013.
- ↑ Alon, Ilan and John McIntyre, eds. (2008), The Globalization of Chinese Enterprises, New York: Palgrave McMillan.
- ↑ James Flanigan (6 July 2011). "A Wave of Chinese Money Gives a Lift to Companies Struggling in Tough Times". The New York Times. Retrieved 7 July 2011.
- ↑ "Ministry of Commerce of China".
- ↑ "Where is China investing?". FDi Magazine. 12 August 2014.
- ↑ "2007年度中国全行业对外直接投资统计数据" [China's total foreign direct investment statistics for the whole year 2007] (in Chinese). China Daily. 30 October 2008.
- ↑ "Chinese investment, and influence, in Europe is growing". The Economist. Retrieved 2018-10-08.
- ↑ "M&A in China - IMAA-Institute". IMAA-Institute. Retrieved 2018-02-22.
- ↑ The Monogram Group. "American Consumer's Attitude towards China and Chinese Brands(2007, 2009. 2011, 2012)". Missing or empty
|url=(help) - ↑ Andrew Salmon (29 October 2004). "Shanghai Automotive expands with Korea purchase". The New York Times.
- ↑ Choe Sang-Hun (24 February 2009). "In Carmaker's Collapse, a Microcosm of South Korea's Woes". The New York Times. p. A6.
- ↑ "Statistics on Mergers & Acquisitions (M&A) - M&A Courses | Company Valuation Courses | Mergers & Acquisitions Courses". Imaa-institute.org. Retrieved 27 December 2011.
- ↑ List of countries by population growth rate
- ↑ The newest billionaires: China's economy churns out dozens. International Herald Tribune. 6 November 2007.
- ↑ 2007 China Rich List series. Hurun Report.
- ↑ Jamil Anderliniin; Ed Crooks (19 January 2013). "Chinese Labor Pool Begins to Drain". CNBC. Financial Times. Retrieved 8 February 2013.
- ↑ Fengbo Zhang: Economic Analysis of Chinese Transportation
- ↑ "China produces first home-grown bullet train: report". Afp.google.com. 22 December 2007. Archived from the original on 26 December 2007. Retrieved 28 February 2012.
- ↑ "China: Logistics is key to inland shift". Financial Times. 10 December 2007. Retrieved 28 February 2012.
- ↑ Firzli and Bazi, M. Nicolas (2011). "Infrastructure Investments in an Age of Austerity : The Pension and Sovereign Funds Perspective". Revue Analyse Financière. 41 (Q4). pp. 19–22. Archived from the original on 17 September 2011.
Further reading
- Sit Tsui, Erebus Wong, Lau Kin Chi and Wen Tiejun. One Belt, One Road: China's Strategy for a New Global Financial Order (January 2017), Monthly Review, Volume 68, Issue 08
- Cheng Enfu and Ding Xiaoqin. A Theory of China's 'Miracle': Eight Principles of Contemporary Chinese Political Economy (January 2017), Monthly Review, Volume 68, Issue 08
- Cardenal, Juan Pablo; Araújo, Heriberto (2011). La silenciosa conquista china (in Spanish). Barcelona: Crítica.
- China: Country Studies – Federal Research Division, Library of Congress. Lcweb2.loc.gov (27 July 2010)
- Heilmann, Sebastian (2017). China's Political System. Lanham, Boulder, New York, London: Rowman & Littlefield. Archived from the original on 6 May 2017.
- Yin-Wong Cheung; Jakob de Haan (2013). The Evolving Role of China in the Global Economy. MIT Press. ISBN 978-0-262-01823-4.
- Journals
- China Economic Journal Taylor & Francis Journals: Welcome. Tandf.co.uk. Retrieved on 2010-08-06.
- China Economic Quarterly
- China & World Economy China & World Economy – Journal Information. Blackwellpublishing.com (2010-05-07). Retrieved on 2010-08-06.
- Journal of Chinese Economic and Business Studies (JCEBS) Taylor & Francis Journals: Welcome. Tandf.co.uk. Retrieved on 2010-08-06. is the official journal of the Chinese Economic Association (UK). CEA Publications – Journal of Chinese Economic and Business Studies. Ceauk.org.uk. Retrieved on 2010-08-06.
- Journal of Chinese Economic and Foreign Trade Studies Emerald, Journal of Chinese Economic and Foreign Trade Studies information. Emeraldinsight.com. Retrieved on 2010-08-06.
- The China Quarterly Journals.cambridge.org
- The Chinese Economy M. E. Sharpe, Inc. – Journal Information. Mesharpe.com. Retrieved on 2010-08-06.
- Journal of Chinese Economic Studies (ISSN 1348-2521)
- Journal of the Chinese Statistical Association (ISSN 0529-6528)
- China: An International Journal (ISSN 0219-7472)
- China Economic Review (ISSN 1043-951X)
- China Review (ISSN 1680-2012)
- Frontiers of Economics in China (ISSN 1673-3444)
- China 2030: Building a Modern, Harmonious, and Creative High-Income Society (pre-publication version)
- Citation: "World Bank; Development Research Center of the State Council, P.R.C. 2012. China 2030 : Building a Modern, Harmonious, and Creative High-Income Society [pre-publication version]. © Washington, DC: World Bank. http://openknowledge.worldbank.org/handle/10986/6057 License: Creative Commons license CC BY 3.0 Unported."
- URI: http://hdl.handle.net/10986/6057
- Date: 2012-02-27
- Author(s): World Bank; Development Research Center of the State Council, P.R.C.
- China 2030
- Citation: "World Bank; Development Research Center of the State Council, P.R.C. 2012. China 2030 : Building a Modern, Harmonious, and Creative High-Income Society [pre-publication version]. © Washington, DC: World Bank. http://openknowledge.worldbank.org/handle/10986/6057 License: Creative Commons license CC BY 3.0 Unported."
External links
| Wikimedia Commons has media related to Economy of China. |
- National Bureau of Statistics of China
- Ministry of Finance, China
- Minister of Commerce, China
- CIA – The World Factbook – China
- China's economy at a glance at the Financial Times
- China - OECD
| |||||||||||||||||||||||||||