Economy of Lithuania
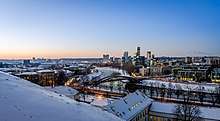 Vilnius downtown during winter | |
| Currency | €1 Euro (EUR) ~$1.17[2] |
|---|---|
| calendar year | |
Trade organisations | EU, WTO, OECD |
| Statistics | |
| GDP |
|
| GDP rank | 84th (nominal, 2014) |
GDP growth |
|
GDP per capita |
|
GDP by sector | services 72.9%, industry 23.6%, agriculture 3.5% (2014) |
| 1.7% (2016)[6] | |
Population below poverty line | 21.9% – income below €300/month (2018)[7] |
Labour force |
|
Labour force by occupation | services 73.6%, industry 17.2%, agriculture 9.2% (2014) |
| Unemployment |
|
Average gross salary |
|
|
| |
Main industries | Petroleum refining, food processing, energy supplies, chemicals, furniture, wood products, textile and clothing[11] |
| 16th (2018)[12] | |
| External | |
| Exports |
|
Export goods | mineral products, machinery and equipment, chemicals, textiles, foodstuffs, plastics |
Main export partners |
|
| Imports |
|
Import goods | mineral products, machinery and equipment, transport equipment, chemicals, textiles and clothing, metals |
Main import partners |
|
FDI stock |
|
| Public finances | |
|
| |
| Revenues |
|
| Expenses |
|
| Economic aid | EU structural assistance: ~€8.4(~$10) billion 2014-2020[18] |
Foreign reserves |
|
|
| |
.jpg)
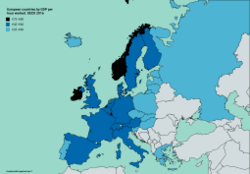
Lithuania is a member of the European Union and the largest economy among the three Baltic states. It also has the highest GDP per capita in PPP. Lithuania belongs to the group of very high human development countries.
Lithuania was the first country to declare independence from Soviet Union in 1990 and rapidly moved from centrally planned to a market economy, implementing numerous liberal reforms. It enjoyed high growth rates after joining the European Union along with the other Baltic states, leading to the notion of a Baltic Tiger.
GDP growth reached its peak in 2007, increasing by 11.1%, and still growing slightly in 2008. Similar to the other Baltic States, the Lithuanian economy suffered a deep recession in 2009, with GDP falling by almost 15%. GDP growth has resumed in 2010, albeit at a slower pace than before the crisis.[23][24]
GDP per capita in Lithuania is 70% above the world's average of $10,500. Lithuania is ranked 24th in the world in the Ease of Doing Business Index prepared by the World Bank Group[25] and 15th out of 178 countries in the Index of Economic Freedom, measured by The Heritage Foundation.[26]On average, more than 95% of all foreign direct investment in Lithuania comes from European Union countries. Sweden is historically the largest investor with 20% – 30% of all FDI in Lithuania.[27] FDI into Lithuania spiked in 2017, reaching its highest ever recorded number of greenfield investment projects. In 2017, Lithuania was third country, after Ireland and Singapore by the average job value of investment projects.[28]
History of economy
The history of Lithuania can be divided into seven major periods. All the periods have some interesting and important facts that affected the economic situation of the country in those times.
- Ancient times – Baltic tribes (until the 13th century)
- Grand Duchy of Lithuania (13th century−1569)
- Polish-Lithuanian Commonwealth (1569–1795)
- Pressure of the Russian Empire (1795–1914)
- Independent Lithuania during the interwar period (1918–1940)
- Lithuanian Soviet Socialist Republic (1944–1990)
- Republic of Lithuania (1990–)
History up to the 20th century
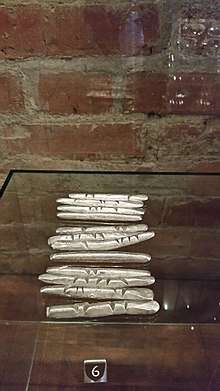
The first Lithuanians formed a branch of an ancient ethno-linguistic group known as the Balts. Lithuanian tribes maintained close trade contacts with the Roman Empire. Amber was the main good provided to the Roman Empire from Baltic Sea coast, via a long route called the Amber Road.
Consolidation of the Lithuanian lands began in the late 12th century. Andreas Stirland crowned Mindaugas, the first pan-Lithuanian ruler, as the Catholic King of Lithuania in 1253. The expansion of the Grand Duchy of Lithuania reached its height in the middle of the 14th century under the Grand Duke Gediminas (reigned 1316-1341), who established a strong central government which later came to dominate the territories from the Baltic Sea to the Black Sea. The Grand Duchy was open to everyone. Grand Duke Gediminas issued letters to the Hanseatic league, offering free access to his domains for men of every order and profession from nobles and knights to tillers of the soil. Economic immigrants and immigrants, seeking religious freedom improved the level of handicrafts.
In 1569 the Polish–Lithuanian Commonwealth formed through the union of the Kingdom of Poland and the Grand Duchy of Lithuania. The economy of the Commonwealth was dominated by feudal agriculture based on the exploitation of the agricultural workforce (serfs). Poland-Lithuania played a significant role in supplying 16th-century Western Europe with exports of three sorts of goods: grain (rye), cattle (oxen) and fur. There was even a Lithuanian trading vessel - vytinė, used for four hundred years to transport grain via Nemunas river. These three articles amounted to nearly 90% of the country's exports to western markets by overland and maritime trade. Statutes of Lithuania were the main collections of law statements and rules in Lithuania.
The Commonwealth was famous for Europe's first and the world's second modern codified national constitution, the so-called Constitution of 3 May, declared on 3 May 1791 (after the 1788 ratification of the United States Constitution). Economic and commercial reforms, previously shunned as unimportant by the Szlachta, were introduced, and the development of industries was encouraged.
Following the partitions of the Polish-Lithuanian Commonwealth in 1772, 1793 and 1795, the Russian Empire controlled the majority of Lithuania. During the administration of the Lithuanian lands by the Russian Empire from 1772 to 1917, one of the most important events that affected economic relations was the emancipation reform of 1861 in Russia. The reform amounted to the liquidation of serf dependence previously suffered by peasants; it boosted the development of capitalism.
Lithuania in the 20th century
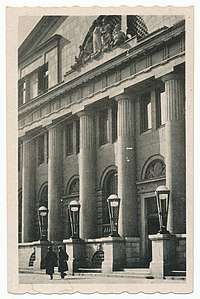
On 16 February 1918, the Council of Lithuania passed a resolution for the re-establishment of the Independent State of Lithuania.[29] Soon, many economic reforms for sustainable economic growth were implemented. A national currency, called the Lithuanian litas, was introduced in 1922. It proved to become one of the most stable currencies in Europe during the inter-war period.[29] During the time of its independence, 1918–1940, Lithuania made substantial progress. For example, Lithuania was the second in the world in exporting flax; Lithuanian farm products such as meat, dairy products, many kinds of grain, potatoes, etc. were of superior quality in the world market.[29]
Having taken advantage of favorable international developments, and driven by its foreign policy aims directed against Lithuanian statehood, the Union of Soviet Socialist Republics (USSR) occupied Lithuania in 1940.[30] Land and the most important objects for the economy were nationalized, and most of the farms collectivized.[29] Later, many inefficient factories and industry companies, highly dependent on other regions of USSR, were established in Lithuania. Despite that, in 1990, GDP per capita of the Lithuanian Soviet Socialist Republic was $8,591, which was above the average for the rest of the Soviet Union of $6,871 but lagging behind developed western countries.
The Soviet era brought Lithuania intensive industrialization and economic integration into the USSR, although the level of technology and state concern for environmental, health, and labor issues lagged far behind Western standards.[31] Urbanization increased from 39% in 1959 to 68% in 1989. From 1949 to 1952 the Soviets abolished private ownership in agriculture, establishing collective and state farms. Production declined and did not reach pre-war levels until the early 1960s. The intensification of agricultural production through intense chemical use and mechanization eventually doubled production but created additional ecological problems. This changed after independence, when farm production dropped due to difficulties in restructuring the agricultural sector.[31]
Development since the 1990s
Reforms since the mid-1990s led to an open and rapidly growing economy. Open to global trade and investment, Lithuania now enjoys high degrees of business, fiscal, and financial freedom. Lithuania is a member of the EU and the WTO, so regulation is relatively transparent and efficient, with foreign and domestic capital subject to the same rules. The financial sector is advanced, regionally integrated, and subject to few intrusive regulations.[26]
One of Lithuania's most important reforms was the privatization of state-owned assets. The first stage of privatization was being implemented between 1991 and 1995. Citizens were given investment vouchers worth €3.1 billion in nominal value, which let them participate in assets selling.[32] By October 1995, they were used as follows: 65% for acquisition of shares; 19% for residential dwellings; 5% for agricultural properties; and 7% remained unused.[32] More than 5,700 enterprises with €2.0 billion worth of state capital in book value were sold using four initial privatization methods: share offerings; auctions; best business plans competitions; and hard currency sales.[32]
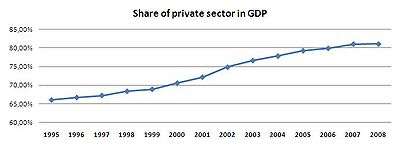
The second privatization step began in 1995 by approving a new law that ensured greater diversity of privatization methods and that enabled participation in the selling process without vouchers. Between 1996 and 1998, 526 entities were sold for more than €0.7 billion.[32] Before the reforms, the public sector totally dominated the economy, whereas the share of the private sector in GDP increased to over 70% by the 2000 and 80% in 2011.[33]
Monetary reform was undertaken in early nineties to improve the stability of the economy. Lithuania chose a currency board system controlled by the Bank of Lithuania independent of any government institution. On 25 June 1993, the Lithuanian litas was introduced as a freely convertible currency, but on 1 April 1994 it was pegged to the United States dollar at a rate of 4 to 1. The mechanism of the currency board system enabled Lithuania to stabilize inflation rates to single digits. The stable currency rate helped to establish foreign economic relations, therefore leading to a constant growth of foreign trade.[34]
By 1998, the economy had survived the early years of uncertainty and several setbacks, including a banking crisis. However, the collapse of the Russian ruble in August 1998 shocked the economy into negative growth and forced the reorientation of trade from Russia towards the West.[31]
Lithuania was invited to the Helsinki EU summit in December 1999 to begin EU accession talks in early 2000.[35]
After the Russian financial crisis, the focus of Lithuania's export markets shifted from East to West. In 1997, exports to the Soviet Union's successor entity (the Commonwealth of Independent States) made up 45% of total Lithuanian exports. This share of exports dropped to 21% of the total in 2006, while exports to EU members increased to 63% of the total.[31] Exports to the United States made up 4.3% of all Lithuania's exports in 2006, and imports from the United States comprised 2% of total imports. Foreign direct investment (FDI) in 2005 was €0.8 billion.
On 2 February 2002 the litas was pegged to the euro at a rate of 3.4528 to 1, which remained until Lithuania adopted the euro in 2015. Lithuania was very close to introducing the euro in 2007, but the inflation level exceeded the Maastricht requirements.[36] On January 1, 2015, Lithuania became the 19th country to use the euro.[37]
The Vilnius Stock Exchange, now renamed the NASDAQ OMX Vilnius, started its activity in 1993 and was the first stock exchange in the Baltic states. In 2003, the VSE was acquired by OMX. Since 27 February 2008 the Vilnius Stock Exchange has been a member of NASDAQ OMX Group, which is the world's largest exchange company across six continents, with over 3,800 listed companies.[38] The market cap of Vilnius Stock Exchange was €3.4 billion on 27 November 2009.[39]
During the last decade (1998–2008) the structure of Lithuania's economy has changed significantly. The biggest changes were recorded in the agricultural sector as the share of total employment decreased from 19.2% in 1998 to just 7.9% in 2008. The service sector plays an increasingly important role. The share of GDP in financial intermediation and real estate sectors was 17% in 2008 compared to 11% in 1998. The share of total employment in the financial sector in 2008 has doubled compared with 1998.[40][41]
| Economic activity | GDP, 1998 | Employment, 1998 | GDP, 2000 | Employment, 2000 | GDP, 2004 | Employment, 2004 | GDP, 2008 | Employment, 2008 |
|---|---|---|---|---|---|---|---|---|
| Trade; hotels and restaurants; transport, storage and communication | 27.3% | 22.6% | 30.2% | 22.8% | 31.7% | 24.7% | 30.1% | 27.5% |
| Industry | 22.8% | 22.1% | 23.8% | 20.8% | 25.8% | 20.1% | 21.5% | 19.6% |
| Public administration; services for social sphere | 21.7% | 25.5% | 21.2% | 27.6% | 18.2% | 26.3% | 17.5% | 26.1% |
| Financial intermediation; real estate | 11.2% | 4.0% | 12.5% | 4.1% | 12.4% | 4.9% | 16.6% | 8.0% |
| Construction | 8.3% | 6.7% | 6.0% | 6.0% | 7.2% | 8.1% | 10.0% | 10.9% |
| Agriculture | 8.7% | 19.2% | 6.3% | 18.7% | 4.7% | 15.8% | 4.4% | 7.9% |
Lithuania in the 21st century

Between 2000 and 2008, the Lithuanian GDP grew by 77%.[42]
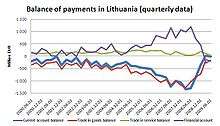
One of the most important factors contributing to Lithuania's economic growth was its accession to the WTO in 2001 and the EU in 2004, which allows free movement of labour, capital, and trade among EU member states. On the other hand, rapid growth caused some imbalances in inflation and balance of payments. The current account deficit to GDP ratio in 2006–2008 was in the double digits and reached its peak in the first quarter of 2008 at a threatening 18.8%.[43] This was mostly due to rapid loan portfolio growth as Scandinavian banks provided cheap credit in Lithuania. The loans directly related to acquisition and development of real estate constituted around half of outstanding bank loans to the private sector.[44] Consumption was affected by credit expansion as well. This led to high inflation of goods and services, as well as trade deficit.
The global credit crunch which started in 2008 affected the real estate and retail sectors. The construction sector shrank by 46.8% during the first three quarters of 2009 and the slump in retail trade was almost 30%.[23][45] GDP plunged by 15.7% in the first nine months of 2009.[23]
Lithuania was the last among the Baltic states to be hit by recession because its GDP growth rate in 2008 was still positive, followed by a slump of more than 15% in 2009. In the third quarter of 2009, compared to the previous quarter, GDP again grew by 6.1% after five-quarters with negative numbers.[23]
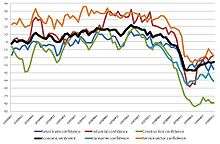
A heavy shock to consumers helped to balance the current account in 2009.[43] Net external assets of the Bank of Lithuania are at a record height of €5.5 billion.[46] Economic sentiment and confidence of all business activities have rebounded from a record low at the beginning of the year 2009.
Sectors related to domestic consumption and real estate still suffer from the economic crisis, but exporters have started making profits even with lower levels of revenue. The catalysts of growing profit margins are lower raw material prices and staff expense.
Euro adoption
On January 1, 2015, Lithuania became the 19th country to adopt the euro. Joining the euro would relieve the Bank of Lithuania of defending the value of the litas, and "it would give Lithuania a say in the decision-making of the European Central Bank (ECB), as well as access to the ECB single-resolution fund and cheaper borrowing costs".[37]
Lithuanians have a "marked preference for using cash as opposed to bank cards", which authorities hope will be diminished with the euro's adoption, which would negatively affect its rather large informal economy. According to ECB data, Lithuanians "take twice as much money out in cash as do Estonians or Latvians, and that this cash is mostly used as 'under the counter' money, as interest rates for time deposits in commercial banks are very low".[37]
Business climate
Cumulative foreign direct investment (FDI) in 2009 was €9.2 billion.[47] The manufacturing sector constituted 28% of total FDI, real estate and business activity sector received 20% of total FDI, and financial intermediation received 19%.[48] Four-fifths of FDI came from the EU countries, with Sweden (17% of total FDI) at the top followed by Germany (10%) and Denmark (9%).[49]
Lithuania seeks to become an innovation hub by 2020. To reach this goal, it is putting its efforts into attracting FDI to added-value sectors, especially IT services, software development, consulting, finance, and logistics.[50] Well-known international companies such as Microsoft, IBM, Transcom, Barclays, Siemens, SEB, TeliaSonera, Paroc, Philip Morris, Thermo Fisher Scientific established a presence in Lithuania.
Lithuanian FEZs (free economic zone) offer developed infrastructure, service support, and tax incentives. A company set up in an FEZ is exempt from corporate taxation for its first six years, as well as a tax on dividends and real estate tax.[51] There are nine industrial sites in Lithuania, which can also provide additional advantages by having a well-developed infrastructure, offering consultancy service and tax incentives.[52]
On the other hand, regulatory red tape and corruption have been cited as dampening the investment climate in Lithuania, particularly affecting small and medium enterprises.[53]
Workforce
The number of the population aged 15 years and over is 2.85 million, and 1.52 million of them were employed in 2008.[55]
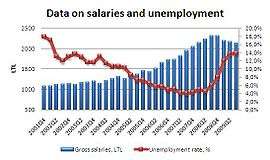
During the last decade (1998–2008) salaries have more than doubled in Lithuania. Despite this, labour costs in Lithuania are among the lowest in the EU. Average monthly net salary in the third quarter of 2009 was €482 and decreased by 6% compared to the same quarter in 2008.[56] The sharpest annual decrease in hourly labour costs in the EU of −10.9% was observed in Lithuania in the third quarter of 2009.[57] Although Lithuania's cheap labor helps to make its exports competitive, real wages have grown by 5% in 2014 (compared to 1% growth in the Eurozone), due in part to the 25% minimum wage increase.[37]
Unemployment in Lithuania has been volatile. Since the year 2001, the unemployment rate has decreased from almost 20% to less than 4% in 2007 thanks to two main reasons. Firstly, during the time of rapid economic expansion, numerous work places were established. This caused a decrease in the unemployment rate and a rise in staff expenses. Secondly, emigration has also reduced unemployment problems since accession to the EU. However, the current economic crisis has lowered the need for workers, so the unemployment rate increased to 13.8% and then stabilized in the third quarter of 2009.
Income and wealth distribution
As of 2016, Lithuania had average wealth per adult of $22,411(and the median of $10,915).[58]
Sectors of economy
Services
One of the most important sub-sectors is information and communication technologies (ICT). Around 37,000 employees work for more than 2,000 ICT companies. ICT received 9.5% of total FDI. 11 out of 20 biggest IT companies from Baltic countries are based in Lithuania. Lithuania exported 31% of its IT services in the first quarter of 2009.[59]
Development of shared services and business process outsourcing are some of the most promising fields. Research company Datamonitor forecasted a 60% personnel growth by 2009.[60] Companies that have outsourced their business operations to Lithuania include Barclays, CITCO Group, Western Union, Uber, Booking.com, MIRROR, PricewaterhouseCoopers, Anthill, and Ernst & Young.
Manufacturing
Manufacturing constitutes the biggest part of gross value added in Lithuania. More than 57,000 people were employed in food processing in 2008. The food processing sector constitutes 11% of total exports. Dairy products, especially cheese, are well known in neighbouring countries. Another important manufacturing activity is chemical products. 80% of production is exported so chemical products constitute 12.5% of total exports.
Furniture production employs more than 50,000 people and has seen double-digit growth over the last three years. The biggest companies in this field work in cooperation with IKEA, which owns one of the biggest wood processing companies in Lithuania.[50] Continental AG in 2018 started to build a factory for high precision car electronics - biggest greenfield investment project in Lithuania so far.[61] Another German manufacturer of lighting technology Hella opened a plant in 2018 in Kaunas FEZ, which will produce produce sensors, actuators and control modules for automotive industry.[62]
Companies in the automotive and engineering sector are relatively small but offer flexible services for small and non-standard orders at competitive prices. The sector employs about 3% of the working population and receives 5.6% of FDI.[50] Vilnius Gediminas Technical University prepares experts for the sector.
Lithuanian laser companies were among the first ones in the world to transfer fundamental research into manufacturing. Lithuania's laser producers export laser technologies and devices to nearly 100 countries.
Financial services
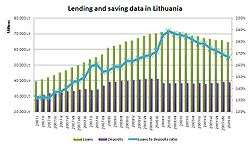
The financial sector concentrates mostly on the domestic market. There are nine commercial banks that hold a license from the Bank of Lithuania and eight foreign bank branches.[63] Most of the banks belong to international corporations, mainly Scandinavian. The financial sector has demonstrated incredible growth in the last decade (1998–2008). Bank assets were only €3.2 billion or 25.5% from GDP in 2000, half of which consisted of loan portfolio.[64]
By the beginning of the year 2009, bank assets grew to €26.0 billion or 80.8% to GDP, the loan portfolio reached €20.7 billion.[65] The loan-to-GDP ratio was 64%. The growth of deposits was not as fast as that of loans. At the end of 2008, the loan portfolio was almost twice as big as that of deposits. It demonstrated high dependence on external financing. Contraction in the loan portfolio has been recorded over the past year, so the loans to deposits ratio are slowly getting back to healthy levels.
The country has increasingly sought position itself as the EU's main fintech hub, hoping to attract international firms by promising to provide European operational licences within three months, compared to a waiting period of up to a year in countries like Germany or the UK.[66] In 2017 only, 35 [67] FinTech companies came to Lithuania – a result of Lithuanian government and Bank of Lithuania simplified procedures for obtaining licences for the activities of e-money and payment institutions.[68] Europe’s first international Blockchain Centre launched in Vilnius in 2018.[69]
Tourism
Tourism in Lithuania becoming increasingly important for local economy, constituting around 3% of GDP in 2008.[70] Lithuania has 22,000 rivers and rivulets, 3,000 lakes, a well-developed rural tourism network, a unique coastal area of almost 100 km and four UNESCO World Heritage sites. Lithuania receives more than 2.2 million foreign tourists a year.[71] Poland, Russia, Latvia, and Belarus supply the most tourists, and a significant number arrive from Germany, the UK, Finland, and Italy as well.
Agriculture
Despite a decreased share in GDP, the agricultural sector is still important for Lithuania as it employs almost 8% of the work force and supplies materials for the food processing sector. 44.8% of the land is arable.[72] Total crop area was 1.8 million hectares in 2008.[73] Cereals, wheat, and triticale are the most popular production of farms. The number of livestock and poultry has decreased twofold compared to the 1990s. The number of cattle in Lithuania at the beginning of the year 2009 was 770,000, the number of dairy cows was 395,000, and the number of poultry was 9.1 million.[74]
Lithuanian food consumption has evolved; between 1992 and 2008, consumption of vegetables increased by 30% to 86 kg per capita, and consumption of meat and its products increased by 23% during the same period to 81 kg per capita.[75] On the other hand, consumption of milk and dairy products has decreased to 268 kg per capita by 21%, and the consumption of bread and grain products decreased to 114 kg per capita by 19% as well.[75]
| Economic activity | 2008 |
|---|---|
| Manufacturing | 17.9% |
| Wholesale and retail trade; repair of goods | 16.6% |
| Real estate, renting and business activities | 13.1% |
| Transport, storage and communication | 12.1% |
| Construction | 10.0% |
| Public administration and defense; compulsory social security | 6.7% |
| Education | 4.9% |
| Agriculture, hunting and forestry | 4.3% |
| Financial intermediation | 3.5% |
| Health and social work | 3.3% |
| Electricity, gas and water supply | 3.1% |
| Other community, social and personal service activities | 2.5% |
| Hotels and restaurants | 1.3% |
| Mining and quarrying | 0.4% |
| Activities of households | 0.1% |
| Fishing | 0.1% |
Regional situation

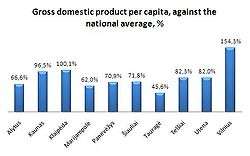
Lithuania is divided into ten counties. There are five cities with a population over 100,000 and twelve cities of over 30,000 people. The gross regional product is concentrated in the three largest counties – Vilnius, Kaunas, and Klaipėda. These three counties account for 70% of the GDP with just 59% of the population.[78] Service centers and industry are concentrated there. In five counties (those of Alytus, Marijampolė, Panevėžys, Šiauliai and Tauragė), GDP per capita is still below 80% of the national average.[78]
In order to achieve balanced regional distribution of GDP, nine public industrial parks (Akmene Industrial Park, Alytus Industrial Park, Kedainiai Industrial Park, Marijampolė Industrial Park, Pagegiai Industrial Park, Panevėžys Industrial Park, Radviliskis Industrial Park, Ramygala Industrial Park and Šiauliai Industrial Park) and three private industrial parks (Tauragė Private Industrial Park, Sitkunai Private Industrial Park, Ramučiai Private Logistic and Industrial Park) were established to provide some tax incentives and prepared physical infrastructure.[52]
Infrastructure
The transport, storage, and communication sector has increased its importance to the economy of Lithuania. In 2008, it accounted for 12.1% of GDP compared to 9.1% in 1996.[76]
Communications
Lithuania has a broadly developed radio, television, landline and mobile phone, as well as broadband internet networks.
Lithuanian National Radio and Television, the public broadcaster in Lithuania operates 3 television channels, including a satellite channel, as well as 3 radio stations. Privately owned commercial TV and Radio broadcasters operate a multitude national, regional and local channels.[79]
The fixed landline network connects 625 thousand households and businesses (down from the record 845 thousand in 2005).[80] The decline in subscription and utilization of the landline network has been driven by increased availability of mobile phone services. The mobile telephony penetration rate in Lithuania (of 151 per 100 population in 2013) has been one of the highest in the world.[81] In 2013, there were 13 providers of mobile phone services, with the three largest ones - BITĖ Lietuva, Omnitel, and Tele2 - operating their own cellular networks.
Lithuanian retail internet sector is competitive, with more than 100 service providers. Retail internet connectivity in Lithuania was among the cheapest in Europe; however, the internet penetration rate (64% of households using internet in 2013) was lower than in other EU countries in the region - Estonia (79%), Latvia (70%) and Poland (69%). Lithuanian internet connection speeds have been claimed to be among the fastest in the world[82] based on user-initiated tests at Speedtest.net.
Energy
The utilities sector accounts for more than 3% of gross value added in Lithuania. Electricity production exceeded 12 billion kWh in 2007, and consumption exceeded 9.6 billion kWh. Surplus electricity is exported.
Lithuania operated a nuclear power plant in Visaginas, which produced 72% of electricity in Lithuania.[83] The plant was shut down on 31 December 2009 in line with the commitments made when Lithuania joined EU in 2004. New nuclear power plant in Visaginas has been proposed but the status of the project is uncertain after it was rejected by the voters in a referendum in 2012.
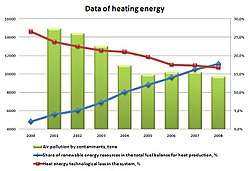
The supply of heating energy has been modernized during the last decade (1998–2008). Technological loss in the heat energy system has decreased significantly from 26.2% in the year 2000 to 16.7% in 2008. The amount of air pollution was reduced by one-third. The share of renewable energy resources in the total fuel balance for heat production increased to almost 20%.
Transport
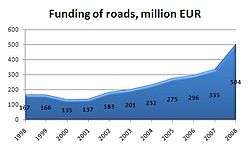
Lithuania forms part of the transport corridor between the East and the West. The volume of goods transported by road transport has increased fivefold since 1996. The total length of roadways is more than 80,000 km, and 90% of them are paved.[72] The government spending on road infrastructure exceeded €0.5 billion in 2008. Via Baltica highway passes through Kaunas, while membership in the Schengen Agreement allows for smooth border crossing to Poland and Latvia.
Railway transport in Lithuania provides long-distance passenger and cargo services. Railways carry approximately 50 million tons of cargo and 7 million passengers a year.[84] Direct rail routes link Lithuania with Russia, Belarus, Latvia, Poland, and Germany. Also, the main transit route between Russia and Russia's Kaliningrad Region passes through Lithuania. JSC Lithuanian Railways transports about 44% of the freight carried through Lithuania.[85] This is a very high indicator compared to other EU countries, where freight transportation by rail amounts to only 10% of the total.[86]
An ice-free seaport of Klaipeda is located in the western part of Lithuania. The port is an important regional transport hub connecting the sea, land and railway routes from east and west. It handles roughly 7,000 ships and 30 million tons of cargo every year, and accepts large-tonnage vessels (dry-cargo vessels up to 70,000 DWT, tankers up to 100,000 DWT and cruise ships up to 270 meters long). The seaport of Klaipėda is able to receive Panamax-type vessels.[84] One of the fastest growing segments of sea transport is passenger traffic, which has increased fourfold since 2002.
There are a few commercial airports; scheduled international services use the facilities at Vilnius, Kaunas, and Palanga.
Storage
There are more than 600,000 m2 of modern logistics and warehousing facilities in Lithuania.[87] The biggest supply of new, modern warehousing facilities is in the capital city Vilnius (after the completion of several new projects in the third quarter of 2009, the supply of modern warehousing premises has increased by nearly 12% in Vilnius and currently reaches 334,400 m2 of the rentable area). Kaunas is in the second place (around 200,000 m2), and Klaipėda in the third (122,500 m2).[84] Since the beginning of the year 2009, prices for warehousing premises have dropped by 20–25% in Vilnius, Kaunas, and Klaipėda, and the current level of rents has reached the level of 2003.[87] The costs for renting new warehouses in Vilnius, Kaunas, and Klaipėda are similar and reach 0.75 to 1.42 EUR/m2, while the rents of old warehouses are 0.35 to 0.67 EUR/m2.
International trade

Lithuanian economy is highly open and International trade is crucial. As a result, the ratio of foreign trade to GDP for Lithuania has often exceeded 100%.
The EU is the biggest trade partner of Lithuania with a 67% of total imports and 61.3% of total exports during 2015.[88] The Commonwealth of Independent States is the second economic union that Lithuania trades the most with, with a share of imports of 25% and a share of exports of 23.9% during the same period.[88] The vast majority of commodities, including oil, gas, and metals have to be imported, mainly from Russia, however in the recent years Lithuania's energy dependence has shifted towards other countries such as Norway and the US. Mineral products constitute 25% of imports and 18% of exports, mainly driven by the presence of ORLEN Lietuva oil refinery with a refining capacity of 9 million tons a year, owned by Polish concern PKN Orlen.[89] Orlen Lietuva sold over €3.5 billion worth of products outside Lithuania,[89] compared to the total Lithuanian exports of €24 billion in 2014.
Some sectors are directed mainly at export markets. Transport and logistics export ⅔ of their products and/or services; the biotechnology industry exports 80%; plastics export 52%; laser technologies export 86%; metal processing, machinery and electric equipment export 64%; furniture and wood processing export 55%; textile and clothing export 76%; and the food industry exports 36%.[90]
| Country | Import | Country | Export |
|---|---|---|---|
| 70.44% | 60.73% | ||
| 14.41% | 13.49% | ||
| 12.07% | 9.86% | ||
| 10.80% | 9.07% | ||
| 7.98% | 7.69% | ||
| 5.42% | 5.30% | ||
| 4.80% | 5.17% | ||
| 4.40% | 4.76% | ||
| 3.42% | 4.26% | ||
| 3.33% | 3.86% | ||
| 3.05% | 3.13% | ||
| 2.81% | 3.03% |
| Combined Nomenclature | Export | Combined Nomenclature | Import |
|---|---|---|---|
| Mineral products | 21.6% | Mineral products | 29.7% |
| Machinery and mechanical appliances; electrical equipment | 9.8% | Machinery and mechanical appliances; electrical equipment | 12.6% |
| Products of the chemical industries | 9.3% | Products of the chemical industries | 12.4% |
| Prepared foodstuffs; beverages and tobacco | 7.1% | Vehicles and transport equipment | 6.4% |
| Plastics; rubber and articles thereof | 6.9% | Prepared foodstuffs; beverages and tobacco | 5.9% |
| Textiles and textile articles | 6.7% | Textiles and textile articles | 5.2% |
| Vehicles and transport equipment | 6.6% | Base metals and articles of base metal | 5.0% |
| Miscellaneous manufactured articles | 6.4% | Plastics; rubber and articles thereof | 4.6% |
| Vegetable products | 6.3% | Vegetable products | 4.3% |
| Live animals; animal products | 5.7% | Live animals; animal products | 3.6% |
Natural Resources
The total value of natural resources in Lithuania reaches €17($25) billion or 50% of Lithuania's GDP in 2008. The most valuable natural resource in Lithuania is subterranean water, which constitutes more than a half of the total value of natural resources.
Macro-Economic
The following table shows the main economic indicators in 1995–2017.[93]
| Year | 1995 | 2000 | 2005 | 2006 | 2007 | 2008 | 2009 | 2010 | 2011 | 2012 | 2013 | 2014 | 2015 | 2016 | 2017 |
|---|---|---|---|---|---|---|---|---|---|---|---|---|---|---|---|
| GDP in $ (PPP) |
24.63 Bln. | 33.66 Bln. | 54.56 Bln. | 60.40 Bln. | 68.89 Bln. | 72.08 Bln. | 61.87 Bln. | 63.65 Bln. | 68.90 Bln. | 72.85 Bln. | 76.72 Bln. | 80.75 Bln. | 83.29 Bln. | 86.33 Bln. | 91.24 Bln. |
| GDP per capita in $ (PPP) |
6,786 | 9,618 | 16,422 | 18,472 | 21,319 | 22,539 | 19,562 | 20,552 | 22,752 | 24,382 | 25,904 | 27,537 | 28,671 | 30,097 | 32,298 |
| GDP growth (real) |
... | 3.8 % | 7.7 % | 7.4 % | 11.1 % | 2.6 % | −14.8 % | 1.6 % | 6.0 % | 3.8 % | 3.5 % | 3.5 % | 2.0 % | 2.3 % | 3.8 % |
| Inflation (in Percent) |
... | 1,0 % | 2,7 % | 3,8 % | 5,8 % | 11,2 % | 4,2 % | 1,2 % | 4,1 % | 3,2 % | 1,2 % | 0,2 % | −0,7 % | 0,7 % | 3,7 % |
| Unemployment rate (in Percent) |
... | 16.4 % | 8.3 % | 5.8 % | 4.2 % | 5.8 % | 13.8 % | 17.8 % | 15.4 % | 13.4 % | 11.8 % | 10.7 % | 9,1 % | 7.9 % | 7.1 % |
| Government debt (Percentage of GDP) |
... | 23 % | 18 % | 17 % | 16 % | 15 % | 29 % | 36 % | 37 % | 40 % | 39 % | 41 % | 3 % | 40 % | 37 % |
See also
References
- ↑ "Statistikos departamentas". Stat.gov.lt. Archived from the original on 17 March 2011. Retrieved 3 April 2010.
- ↑ "XE - The World's Trusted Currency Authority". Archived from the original on 2 February 2008.
- ↑ "Eurostat - Tables, Graphs and Maps Interface (TGM) table". ec.europa.eu. Archived from the original on 18 February 2018.
- 1 2 "Report for Selected Countries and Subjects". Archived from the original on 22 February 2017.
- ↑ Markevičienė, Eglė. "Lietuvos ekonomika skrieja aukštesne pavara". vz.lt. Archived from the original on 28 October 2017.
- ↑ "CPI-based consumer price changes". Statistics Lithuania. Archived from the original on 30 August 2017.
- ↑ http://www.compareyourincome.org
- ↑ "Rodiklių duomenų bazė - Oficialiosios statistikos portalas". osp.stat.gov.lt. Archived from the original on 3 April 2015.
- ↑ Media, Fresh. "Socialinė statistika - Lietuvos Respublikos Socialinės apsaugos ir darbo ministerija". Archived from the original on 24 January 2015.
- 1 2 "Pradžia - Oficialiosios statistikos portalas". osp.stat.gov.lt. Archived from the original on 11 October 2017.
- ↑ "Pramonės produkcija, be PVM ir akcizo". Statistics Lithuania. Archived from the original on 8 February 2017. Retrieved 7 February 2017.
- ↑ "Ease of Doing Business in Lithuania". Doingbusiness.org. Archived from the original on 4 November 2017. Retrieved 31 October 2017.
- ↑ "Export Partners of Lithuania". CIA World Factbook. 2013. Archived from the original on 12 February 2018. Retrieved 22 May 2015.
- ↑ "Import Partners of Lithuania". CIA World Factbook. 2013. Archived from the original on 6 August 2016. Retrieved 22 May 2015.
- ↑ https://m.delfi.lt/verslas/verslas/article.php?id=78444933
- ↑ "Centrinės valdžios sektoriaus skola pernai – 15,7 mlrd. eurų". Archived from the original on 8 February 2017.
- 1 2 Gudavičius, Stasys (22 December 2016). "Seimas priėmė 2017 m. biudžetą". Verslo Zinios. Archived from the original on 8 February 2017. Retrieved 7 February 2017.
- ↑ "Apie 2014-2020 m. ES fondų investicijas - Finansavimas - 2014-2020 Europos Sąjungos fondų investicijos Lietuvoje". Archived from the original on 27 April 2016.
- ↑ "Sovereigns rating list". Standard & Poor's. Archived from the original on 28 September 2011. Retrieved 15 May 2015.
- ↑ "Moody's upgrades Lithuania's government bond ratings to A3; stable outlook". Moody's Investors Service. 8 May 2015. Archived from the original on 24 July 2015. Retrieved 15 May 2015.
- ↑ "Fitch Ratings Upgraded Lithuania's Credit Rating Outlook To "Positive"". 10 August 2018. Retrieved 12 August 201. Check date values in:
|accessdate=(help) - ↑ "Archived copy". Archived from the original on 4 October 2017. Retrieved 6 October 2017.
- 1 2 3 4 "Statistics Lithuania". Stat.gov.lt. 28 December 2009. Archived from the original on 23 July 2011. Retrieved 3 April 2010.
- ↑ "Lietuvos makroekonomikos apzvalga" (PDF). SEB Bankas. April 2015. Archived (PDF) from the original on 1 July 2015. Retrieved 1 July 2015.
- ↑ "Rankings – Doing Business – The World Bank Group". Doing Business. Archived from the original on 15 September 2008. Retrieved 20 May 2015.
- 1 2 "Lithuania information on economic freedom | Facts, data, analysis, charts and more". Heritage Foundation. Archived from the original on 24 May 2015. Retrieved 20 May 2015.
- ↑ "Tiesioginės užsienio investicijos Lietuvoje pagal šalį - Lietuvos bankas". 9 January 2018. Archived from the original on 9 January 2018.
- ↑ Dencik, Jacob; Spee, Roel (July 2018). "Global Location Trends - 2018 Annual Report: Getting ready for Globalization 4.0" (PDF). IBM Institute for Business Value. p. 7.
Ireland continues to lead the world for attracting high-value investment, generating substantial inward investment with strengths in key high-value sectors such as ICT, financial and business services and life sciences. But Singapore is now a close second, with Lithuania and Switzerland right behind.
- 1 2 3 4 "Welcome to the Lithuanian Global Genealogical Society". Lithuaniangenealogy.org. Archived from the original on 1 June 2009. Retrieved 3 April 2010.
- ↑ "Lithuania – Official Gateway to Lithuania – History". Lietuva.lt. Archived from the original on 24 January 2009. Retrieved 3 April 2010.
- 1 2 3 4 "Background Note: Lithuania". U.S. Department of State. Archived from the original on 14 October 2009. Retrieved 19 October 2009.
- 1 2 3 4 Archived 22 September 2014 at the Wayback Machine.
- ↑ "Gross value added share by economic sector, year – Database of Indicators – data and statistics". Db1.stat.gov.lt. 4 March 2010. Archived from the original on 20 July 2011. Retrieved 3 April 2010.
- ↑ "Foreign trade | Statistics Lithuania". Stat.gov.lt. Archived from the original on 23 July 2011. Retrieved 3 April 2010.
- ↑ "The requested page does not exist - EUROPA". Archived from the original on 31 December 2007.
- ↑ "Pradžia". Infolex.Lt. Archived from the original on 22 July 2011. Retrieved 3 April 2010.
- 1 2 3 4 Giovanna Maria Dora Dore (28 January 2015). "Hopping on a Sinking Ship?". The American Interest. Archived from the original on 14 February 2015.
- ↑ "NASDAQ OMX Baltic". NASDAQ OMX Baltic. Retrieved 2010-04-03.
- ↑ "Turukapitalisatsioon". Aktsiad, Vabaturg, Vilniuse börs. 26 November 2009.
- 1 2 Structure of gross value added by kind of economic activity and year Archived 20 July 2011 at the Wayback Machine.
- ↑ "Rodiklių duomenų bazė". Db1.stat.gov.lt. Archived from the original on 2 April 2010. Retrieved 3 April 2010.
- ↑ Gross domestic product by statistical indicators and year Archived 20 July 2011 at the Wayback Machine.
- 1 2 "Bank of Lithuania : Statistics". Lb.lt. Archived from the original on 21 November 2008. Retrieved 3 April 2010.
- ↑ "Download Attachment" (PDF). Finansai123.googlepages.com. Retrieved 2010-04-03.
- ↑ "Statistics Lithuania". Stat.gov.lt. Archived from the original on 23 July 2011. Retrieved 3 April 2010.
- ↑ "Bank of Lithuania: Statistics". Bank of Lithuania. Archived from the original on 6 February 2011. Retrieved 3 April 2010.
- ↑ "Foreign direct investment at the beginning of the year by administrative territory, statistical indicator and year" Archived 20 July 2011 at the Wayback Machine., Statistics Lithuania
- ↑ "Foreign direct investment at the beginning of the year by kind of economic activity, statistical indicator and year", Statistics Lithuania
- ↑ "Foreign direct investment at the beginning of the year by country" Archived 20 July 2011 at the Wayback Machine., Statistics Lithuania
- 1 2 3 "lepa.lt - Domenai, domenų registravimas - UAB "Interneto vizija"" (PDF). www.lepa.lt. Archived (PDF) from the original on 13 May 2018.
- ↑ "Free Economic Zones With Tax Benefits And One-Stop-Shop Services". InvestLithuania.com. Archived from the original on 12 September 2010. Retrieved 3 April 2010.
- 1 2 "Industrial Parks". InvestLithuania.com. Archived from the original on 8 October 2010. Retrieved 3 April 2010.
- ↑ "Lithuania". Archived from the original on 24 June 2017.
- ↑ "Productivity - GDP per hour worked - OECD Data". theOECD. Archived from the original on 24 January 2018.
- ↑ "Population aged 15 years and over, employed and unempoyed by educational attainment, sex - Database of Indicators - data and statistics". Archived from the original on 20 July 2011.
- ↑ "Statistics Lithuania". Stat.gov.lt. Archived from the original on 23 July 2011. Retrieved 3 April 2010.
- ↑ "Sharpest Decrease in Hourly Labour Costs Recorded in Lithuania". Lda.lt. 21 December 2009. Retrieved 2010-04-03.
- ↑ Global Wealth Report 2016. Credit Suisse. 2016. Archived from the original on 6 August 2017.
- ↑ "BTT.lt". www.primeinvestment.lt. Archived from the original on 19 June 2010.
- ↑ "lepa.lt - Domenai, domenų registravimas - UAB "Interneto vizija"" (PDF). www.lepa.lt. Archived (PDF) from the original on 13 May 2018.
- ↑ "Continental Expands its Presence in Europe and Builds First Plant in Lithuania". Retrieved 2018-07-21.
- ↑ "Hella officially opens its electronics plant in Lithuania". Retrieved 2018-09-13.
- ↑ "Bank of Lithuania". Lb.lt. 18 March 2010. Archived from the original on 12 April 2009. Retrieved 3 April 2010.
- ↑ "Bank of Lithuania". Lb.lt. Archived from the original on 8 March 2008. Retrieved 3 April 2010.
- ↑ "Bank of Lithuania". Lb.lt. Retrieved 2010-04-03.
- ↑ "This Country Wants a Piece of London's Fintech". Bloomberg.com. 20 December 2017. Archived from the original on 21 December 2017. Retrieved 20 December 2017.
- ↑ "Lithuania Registered 35 New Fintech Companies in 2017". www.crowdfundinsider.com. Retrieved 18 March 2018.
- ↑ "Lithuanian Institutions Enhance Focus on New Financial Technologies and Fintech Sector Development in Lithuania". finmin.lrv.lt. Retrieved 18 March 2018.
- ↑ Kostaki, Irene. "Lithuania debuts as EU gateway for global blockchain industry". www.neweurope.eu. Retrieved 14 July 2018.
The Lithuanian capital Vilnius launched Europe’s first international Blockchain Centre on January 27, making it the EU’s only hub for the digital ledger. The new hub will help Europe connect with partner Blockchain Centres in Australia, China, Canada, the UK, Belgium, Denmark, Georgia, Gibraltar, Ukraine, Israel, and Latvia.
- ↑ "Tourism". Lepa.lt. Archived from the original on 19 December 2009. Retrieved 3 April 2010.
- ↑ "lepa.lt - Domenai, domenų registravimas - UAB "Interneto vizija"" (PDF). www.lepa.lt. Archived (PDF) from the original on 13 May 2018.
- 1 2 "The World Factbook — Central Intelligence Agency". Archived from the original on 4 January 2018.
- ↑ "Farm crops in the country by kind, type of farm – Database of Indicators – data and statistics". Db1.stat.gov.lt. Retrieved 2010-04-03.
- ↑ "Number of livestock and poultry by kind, period – Database of Indicators – data and statistics". Db1.stat.gov.lt. Archived from the original on 13 March 2012. Retrieved 3 April 2010.
- 1 2 "Consumption of main foodstuffs per capita by product – Database of Indicators – data and statistics". Db1.stat.gov.lt. Retrieved 2010-04-03.
- 1 2 "Structure of gross value added by kind of economic activity (31), year – Database of Indicators – data and statistics". Db1.stat.gov.lt. Retrieved 2010-04-03.
- ↑ "Indicators database - Oficialiosios statistikos portalas". osp.stat.gov.lt. Archived from the original on 21 August 2017.
- 1 2 "Statistics Lithuania". Stat.gov.lt. Archived from the original on 23 July 2011. Retrieved 3 April 2010.
- ↑ "Communications" Archived 4 January 2018 at the Wayback Machine., Lithuania, World Factbook, U.S. Central Intelligence Agency, 13 May 2015. Retrieved 20 May 2015.
- ↑ "Lithuanian Communications Sector 2013" (PDF). Communications Regulatory Authority of the Republic of Lithuania. Archived (PDF) from the original on 27 September 2015. Retrieved 20 May 2015.
- ↑ "Mobile cellular subscriptions (per 100 people)". World Bank. Archived from the original on 16 April 2015. Retrieved 20 May 2015.
- ↑ "ICT Infrastructure". Invest Lithuania. Archived from the original on 4 May 2015. Retrieved 20 May 2015.
- ↑ "Nuclear energy – Visaginas Nuclear Power Plant Project". Vae.lt. Archived from the original on 2 March 2010. Retrieved 3 April 2010.
- 1 2 3 "Excellent Infrastructure". Lepa.lt. 21 December 2007. Archived from the original on 13 April 2009. Retrieved 3 April 2010.
- ↑ "Lietuvos geležinkeliai". Litrail.lt. Archived from the original on 22 July 2011. Retrieved 3 April 2010.
- ↑ "Lietuvos geležinkeliai". Litrail.lt. Archived from the original on 22 July 2011. Retrieved 3 April 2010.
- 1 2 "Archived copy" (PDF). Archived (PDF) from the original on 22 July 2011. Retrieved 26 January 2010.
- 1 2 "Eksportas, importas pagal valstybes" (PDF). Statistics Lithuania. Archived (PDF) from the original on 29 May 2015. Retrieved 29 May 2015.
- 1 2 "Archived copy" (PDF). Archived (PDF) from the original on 29 May 2015. Retrieved 29 May 2015.
- ↑ "Šiaurės kalbos" (PDF).
- ↑ "Export and import by country" (PDF). Statistics departament. Archived (PDF) from the original on 16 June 2016. Retrieved 17 January 2017.
- ↑ "Exports and imports by CN section | Statistics Lithuania". Stat.gov.lt. Archived from the original on 23 July 2011. Retrieved 3 April 2010.
- ↑ "Report for Selected Countries and Subjects". Retrieved 2018-09-10.
| History |
|  | ||||||||
|---|---|---|---|---|---|---|---|---|---|---|
| Geography | ||||||||||
| Politics |
| |||||||||
| Economy | ||||||||||
| Society |
| |||||||||
Member states of the European Union | ||
|---|---|---|
| ||
![]()