Economy of Japan
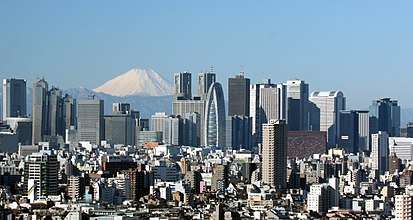 Tokyo, the financial center of Japan | |
| Currency | Japanese yen (JPY) = 0.009 USD |
|---|---|
| 1 April – 31 March | |
Trade organizations | APEC, WTO, OECD, G-20, G8 and others |
| Statistics | |
| GDP |
$5.070 trillion (nominal; 2018)[1] $5.632 trillion (PPP; 2018)[1] |
| GDP rank | |
GDP growth | 1.7% (2017)[2] |
GDP per capita |
$40,105 (nominal; 2018)[1] $44,549 (PPP; 2018)[1] |
GDP per capita rank | |
GDP by sector | agriculture: 1.2%, industry: 27.7%, services: 71.1% (2016 est.) |
| 0.7% (August 2017)[3] | |
Population below poverty line | 15.7% (2010)[4] |
| 37.9 (2011)[5] | |
Labor force | 65 million (2017)[6] |
Labor force by occupation | agriculture: 2.9%, industry: 26.2%, services: 70.9% (February 2015 est) |
| Unemployment | 2.8% (August 2017)[3] |
Main industries | |
| 34th (2018)[7] | |
| External | |
| Exports | $697.2 billion (2017)[8] |
Export goods | motor vehicles 14.9%; iron and steel products 5.4%; semiconductors 5%; auto parts 4.8%; power generating machinery 3.5%; plastic materials 3.3% |
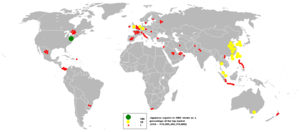
Main export partners |
|
| Imports | $670.97 billion (2017)[10] |
Import goods | petroleum 16.1%; liquid natural gas 9.1%; clothing 3.8%; semiconductors 3.3%; coal 2.4%; audio and visual apparatus 1.4% |
Main import partners |
|
FDI stock | $204.3 billion (31 December 2016)[11] |
Gross external debt | $3.408 trillion (31 March 2017)[12] |
| Public finances | |
| 234.7% of GDP (2016 est.)[13] | |
| Revenues | $1.696 trillion (2016 est.) |
| Expenses | $1.931 trillion (2016 est.) |
| Economic aid | donor: ODA, $10.37 billion (2016)[14] |
Foreign reserves | $1.249 trillion (June 2017)[17] |
The economy of Japan is a highly developed and market-oriented economy. It is the third-largest in the world by nominal GDP and the fourth-largest by purchasing power parity (PPP).[18][19] and is the world's second largest developed economy.[20] Japan is a member of the G7. According to the International Monetary Fund, the country's per capita GDP (PPP) was at $38,937(2016)[21]. Due to a volatile currency exchange rate, Japan's GDP as measured in dollars fluctuates widely. Accounting for these fluctuations through use of the Atlas method, Japan is estimated to have a GDP per capita of around $38,490. The Japanese economy is forecasted by the Quarterly Tankan survey of business sentiment conducted by the Bank of Japan.[22] The Nikkei 225 presents the monthly report of top Blue chip (stock market) equities on Japan Exchange Group.[23]
Japan is the world's third largest automobile manufacturing country,[24] has the largest electronics goods industry, and is often ranked among the world's most innovative countries leading several measures of global patent filings.[25] Facing increasing competition from China and South Korea,[26] manufacturing in Japan today now focuses primarily on high-tech and precision goods, such as optical instruments, hybrid vehicles, and robotics. Besides the Kantō region,[27][28][29][30] the Kansai region is one of the leading industrial clusters and manufacturing centers for the Japanese economy.[31] The size and industrial structure of cities in Japan have maintained tight regularities despite substantial churning of population and industries across cities overtime.[32] Japan is the world's largest creditor nation.[33][34] Japan generally runs an annual trade surplus and has a considerable net international investment surplus. As of 2010, Japan possesses 13.7% of the world's private financial assets (the third largest in the world) at an estimated $13.5 trillion.[35] As of 2015, 54 of the Fortune Global 500 companies are based in Japan,[36] down from 62 in 2013.[37]
Japan has the highest ratio of public debt to GDP of any developed nation.[38][39] However, the national debt is predominantly owned by Japanese nationals.[40] The Japanese economy faces considerable challenges posed by a declining population.[41] Statistics showed an official decline for the first time in 2015, while projections suggest that it will continue to fall from 127 million down to below 100 million by the middle of the 21st century.[42]
Overview of economy
In the three decades of economic development following 1960, rapid economic growth referred to as the Japanese post-war economic miracle occurred. By the guidance of Ministry of Economy, Trade and Industry,[43] with average growth rates of 10% in the 1960s, 5% in the 1970s, and 4% in the 1980s, Japan was able to establish and maintain itself as the world's second largest economy from 1978 until 2010, when it was surpassed by the People's Republic of China. By 1990, income per capita in Japan equalled or surpassed that in most countries in the West.[44]
During the second half of the 1980s, rising stock and real estate prices created an economic bubble. The economic bubble came to an abrupt end as the Tokyo Stock Exchange crashed in 1990–92 and real estate prices peaked in 1991. Growth in Japan throughout the 1990s at 1.5% was slower than global growth, giving rise to the term Lost Decade. After another decade of low growth rate, the term became the Lost 20 Years. Nonetheless, GDP per capita growth from 2001 to 2010 has still managed to outpace Europe and the United States.[45]
With this low growth rate, the national debt of Japan has expanded due to its considerable social welfare spending in an aging society with a shrinking tax-base.[38][39][46] The scenario of "Abandoned homes" continues to spread from rural areas to urban areas in Japan.[47][48][49][50][51]
A mountainous, volcanic island country, Japan has inadequate natural resources to support its growing economy and large population, and therefore exports goods in which it has a comparative advantage such as engineering-oriented, research and development-led industrial products in exchange for the import of raw materials and petroleum. Japan is among the top-three importers for agricultural products in the world next to the European Union and United States in total volume for covering of its own domestic agricultural consumption.[52] Japan is the world's largest single national importer of fish and fishery products.[53][54][55][56][57] Tokyo Metropolitan Central Wholesale Market[58][59] is the largest wholesale market for primary products in Japan, including the renowned Tsukiji fish market.[60][61] Japanese whaling, ostensibly for research purposes, has been sued as illegal under international law.
Although many kinds of minerals were extracted throughout the country, most mineral resources had to be imported in the postwar era. Local deposits of metal-bearing ores were difficult to process because they were low grade. The nation's large and varied forest resources, which covered 70 percent of the country in the late 1980s, were not utilized extensively. Because of political decisions on local, prefectural, and national levels, Japan decided not to exploit its forest resources for economic gain. Domestic sources only supplied between 25 and 30 percent of the nation's timber needs. Agriculture and fishing were the best developed resources, but only through years of painstaking investment and toil. The nation therefore built up the manufacturing and processing industries to convert raw materials imported from abroad. This strategy of economic development necessitated the establishment of a strong economic infrastructure to provide the needed energy, transportation, communications, and technological know-how.
Deposits of gold, magnesium, and silver meet current industrial demands, but Japan is dependent on foreign sources for many of the minerals essential to modern industry. Iron ore, copper, bauxite, and alumina must be imported, as well as many forest products.
Economic history
The economic history of Japan is one of the most studied economies for its spectacular growth in three different periods. First was the foundation of Edo (in 1603) to whole inland economical developments, second was the Meiji Restoration (in 1868) to be the first non-European power, third was after the defeat of World War II (in 1945) when the island nation rose to become the world's second largest economy.
First contacts with Europe (16th century)
Japan was considered as a country rich in precious metals, mainly owing to Marco Polo's accounts of gilded temples and palaces, but also due to the relative abundance of surface ores characteristic of a massive huge volcanic country, before large-scale deep-mining became possible in Industrial times.[62] Japan was to become a major exporter of silver, copper, and gold during the period until exports for those minerals were banned.[63]
Renaissance Japan was also perceived as a sophisticated feudal society with a high culture and a strong pre-industrial technology. It was densely populated and urbanized. Prominent European observers of the time seemed to agree that the Japanese "excel not only all the other Oriental peoples, they surpass the Europeans as well" (Alessandro Valignano, 1584, "Historia del Principo y Progresso de la Compania de Jesus en las Indias Orientales).
Early European visitors were amazed by the quality of Japanese craftsmanship and metalsmithing. This stems from the fact that Japan itself is rather rich in natural resources found commonly in Europe, especially iron.
The cargo of the first Portuguese ships (usually about 4 smaller-sized ships every year) arriving in Japan almost entirely consisted of Chinese goods (silk, porcelain). The Japanese were very much looking forward to acquiring such goods, but had been prohibited from any contacts with the Emperor of China, as a punishment for Wakō pirate raids. The Portuguese (who were called Nanban, lit. Southern Barbarians) therefore found the opportunity to act as intermediaries in Asian trade.
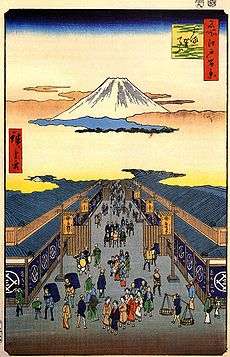
Edo period (1603–1868)
.jpg)
The beginning of the Edo period coincides with the last decades of the Nanban trade period, during which intense interaction with European powers, on the economic and religious plane, took place. It is at the beginning of the Edo period that Japan built her first ocean-going Western-style warships, such as the San Juan Bautista, a 500-ton galleon-type ship that transported a Japanese embassy headed by Hasekura Tsunenaga to the Americas, which then continued to Europe. Also during that period, the bakufu commissioned around 350 Red Seal Ships, three-masted and armed trade ships, for intra-Asian commerce. Japanese adventurers, such as Yamada Nagamasa, were active throughout Asia.
In order to eradicate the influence of Christianization, Japan entered in a period of isolation called sakoku, during which its economy enjoyed stability and mild progress.[64] But not long after, in the 1650s, the production of Japanese export porcelain increased greatly when civil war put the main Chinese center of porcelain production, in Jingdezhen, out of action for several decades. For the rest of the 17th century most Japanese porcelain production was for export, mostly in Kyushu. The trade dwindled under renewed Chinese competition by the 1740s, before resuming after the opening of Japan in the mid-19th century.[65]
Economic development during the Edo period included urbanization, increased shipping of commodities, a significant expansion of domestic and, initially, foreign commerce, and a diffusion of trade and handicraft industries. The construction trades flourished, along with banking facilities and merchant associations. Increasingly, han authorities oversaw the rising agricultural production and the spread of rural handicrafts.
By the mid-eighteenth century, Edo had a population of more than 1 million and Osaka and Kyoto each had more than 400,000 inhabitants. Many other castle towns grew as well. Osaka and Kyoto became busy trading and handicraft production centers, while Edo was the center for the supply of food and essential urban consumer goods.
Rice was the base of the economy, as the daimyo collected the taxes from the peasants in the form of rice. Taxes were high, about 40% of the harvest. The rice was sold at the fudasashi market in Edo. To raise money, the daimyo used forward contracts to sell rice that was not even harvested yet. These contracts were similar to modern futures trading.
During the period, Japan progressively studied Western sciences and techniques (called rangaku, literally "Dutch studies") through the information and books received through the Dutch traders in Dejima. The main areas that were studied included geography, medicine, natural sciences, astronomy, art, languages, physical sciences such as the study of electrical phenomena, and mechanical sciences as exemplified by the development of Japanese clockwatches, or wadokei, inspired from Western techniques.
Pre-war period (1868–1945)
Since the mid-19th century, after the Meiji Restoration, the country was opened up to Western commerce and influence and Japan has gone through two periods of economic development. The first began in earnest in 1868 and extended through to World War II; the second began in 1945 and continued into the mid-1980s.
Economic developments of the prewar period began with the "Rich State and Strong Army Policy" by the Meiji government. During the Meiji period (1868–1912), leaders inaugurated a new Western-based education system for all young people, sent thousands of students to the United States and Europe, and hired more than 3,000 Westerners to teach modern science, mathematics, technology, and foreign languages in Japan (Oyatoi gaikokujin). The government also built railroads, improved road, and inaugurated a land reform program to prepare the country for further development.
To promote industrialization, the government decided that, while it should help private business to allocate resources and to plan, the public sector was best equipped to stimulate economic growth. The greatest role of government was to help provide good economic conditions for business. In short, government was to be the guide and business the producer. In the early Meiji period, the government built factories and shipyards that were sold to entrepreneurs at a fraction of their value. Many of these businesses grew rapidly into the larger conglomerates. Government emerged as chief promoter of private enterprise, enacting a series of probusiness policies.
In the mid-1930s, the Japanese nominal wage rates were "10 times less" than the one of the U.S (based on mid-1930s exchange rates), while the price level is estimated to have been about 44% the one of the U.S.[66]
Postwar period (1945–present)
From the 1960s to the 1980s, overall real economic growth was extremely large: a 10% average in the 1960s, a 5% average in the 1970s and a 4% average in the 1980s.[67] By the end of said period, Japan had moved into being a high-wage economy.[68]
Growth slowed markedly in the late 1990s also termed the Lost Decade after the collapse of the Japanese asset price bubble. As a consequence Japan ran massive budget deficits (added trillions in Yen to Japanese financial system) to finance large public works programs.
By 1998, Japan's public works projects still could not stimulate demand enough to end the economy's stagnation. In desperation, the Japanese government undertook "structural reform" policies intended to wring speculative excesses from the stock and real estate markets. Unfortunately, these policies led Japan into deflation on numerous occasions between 1999 and 2004. In his 1998 paper, Japan's Trap, Princeton economics professor Paul Krugman argued that based on a number of models, Japan had a new option. Krugman's plan called for a rise in inflation expectations to, in effect, cut long-term interest rates and promote spending.[69]
Japan used another technique, somewhat based on Krugman's, called Quantitative easing. As opposed to flooding the money market with newly printed money, the Bank of Japan expanded the money supply internally to raise expectations of inflation. Initially, the policy failed to induce any growth, but it eventually began to affect inflationary expectations. By late 2005, the economy finally began what seems to be a sustained recovery. GDP growth for that year was 2.8%, with an annualized fourth quarter expansion of 5.5%, surpassing the growth rates of the US and European Union during the same period.[70] Unlike previous recovery trends, domestic consumption has been the dominant factor of growth.
Despite having interest rates down near zero for a long period of time, the Quantitative easing strategy did not succeed in stopping price deflation.[71] This led some economists, such as Paul Krugman, and some Japanese politicians, to advocate the generation of higher inflation expectations.[72] In July 2006, the zero-rate policy was ended. In 2008, the Japanese Central Bank still had the lowest interest rates in the developed world, but deflation had still not been eliminated[73] and the Nikkei 225 has fallen over approximately 50% (between June 2007 and December 2008). However, on 5 April 2013, the Bank of Japan announced that it would be purchasing 60–70 trillion yen in bonds and securities in an attempt to eliminate deflation by doubling the money supply in Japan over the course of two years. Markets around the world have responded positively to the government's current proactive policies, with the Nikkei 225 adding more than 42% since November 2012.[74] The Economist has suggested that improvements to bankruptcy law, land transfer law, and tax laws will aid Japan's economy. In recent years, Japan has been the top export market for almost 15 trading nations worldwide.
Infrastructure
In 2005, one half of Japan's energy was produced from petroleum, a fifth from coal, and 14% from natural gas.[75] Nuclear power in Japan made a quarter of electricity production but due to the Fukushima Daiichi nuclear disaster there has been a large desire to end Japan's nuclear power program.[76][77] In September 2013, Japan closed its last 50 nuclear power plants nationwide, causing the nation to be nuclear free.[78]
Japan's spendings on roads has been considered large.[79] The 1.2 million kilometers of paved road are one of the major means of transportation.[80] Japan has left-hand traffic.[81] A single network of speed, divided, limited-access toll roads connects major cities and are operated by toll-collecting enterprises.[82] New and used cars are inexpensive, and the Japanese government has encouraged people to buy hybrid vehicles.[83] Car ownership fees and fuel levies are used to promote energy-efficiency.[83]
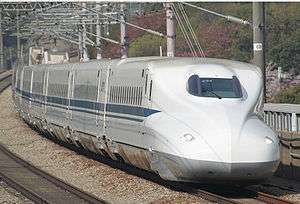
Rail transport is a major means of transport in Japan. Dozens of Japanese railway companies compete in regional and local passenger transportation markets; for instance, 6 passenger JR enterprises, Kintetsu Railway, Seibu Railway, and Keio Corporation.[84] Often, strategies of these enterprises contain real estate or department stores next to stations, and many major stations have major department stores near them.[85] The Japanese cities of Fukuoka, Kobe, Kyoto, Nagoya, Osaka, Sapporo, Sendai, Tokyo and Yokohama all have subway systems. Some 250 high-speed Shinkansen trains connect major cities.[86] All trains are known for punctuality, and a delay of 90 seconds can be considered late for some train services.[87]
There are 98 passenger and 175 total airports in Japan, and flying is a popular way to travel.[88][89] The largest domestic airport, Tokyo International Airport, is Asia's second busiest airport.[90] The largest international gateways are Narita International Airport (Tokyo area), Kansai International Airport (Osaka/Kobe/Kyoto area), and Chūbu Centrair International Airport (Nagoya area).[91] The largest ports in Japan include Nagoya Port, the Port of Yokohama, the Port of Tokyo and the Port of Kobe.[92]
About 84% of Japan's energy is imported from other countries.[93][94] Japan is the world's largest liquefied natural gas importer, second largest coal importer, and third largest net oil importer.[95] Given its heavy dependence on imported energy, Japan has aimed to diversify its sources.[96] Since the oil shocks of the 1970s, Japan has reduced dependence on petroleum as a source of energy from 77.4% in 1973 to about 43.7% in 2010 and increased dependence on natural gas and nuclear power.[97] Other important energy source includes coal, and hydroelectricity is Japan's biggest renewable energy source.[98][99] Japan's solar market is also currently booming.[100] Kerosene is also used extensively for home heating in portable heaters, especially farther north.[101] Many taxi companies run their fleets on liquefied natural gas.[102] A recent success towards greater fuel economy was the introduction of mass-produced Hybrid vehicles.[83] Prime Minister Shinzō Abe, who was working on Japan's economic revival, signed a treaty with Saudi Arabia and UAE about the rising prices of oil, ensuring Japan's stable deliveries from that region.[103][104]
Macro-economic trend
.png)

This is a chart of trend of gross domestic product of Japan at market prices estimated by the International Monetary Fund with figures in millions of Japanese Yen.[105] See also[106][107]
| Year | Gross domestic product | US dollar exchange | Price index (2000=100) | Nominal per-capita GDP (as % of US) | PPP capita GDP (as % of US) |
| 1955 | 8,369,500 | ¥360.00 | 10.31 | – | |
| 1960 | 16,009,700 | ¥360.00 | 16.22 | – | |
| 1965 | 32,866,000 | ¥360.00 | 24.95 | – | |
| 1970 | 73,344,900 | ¥360.00 | 38.56 | – | |
| 1975 | 148,327,100 | ¥297.26 | 59.00 | – | |
| 1980 | 240,707,315 | ¥225.82 | 100 | 105.85 | 71.87 |
| 2005 | 502,905,400 | ¥110.01 | 97 | 85.04 | 71.03 |
| 2010 | 477,327,134 | ¥88.54 | 98 | 89.8 | 71.49 |
For purchasing power parity comparisons, the US dollar was exchanged at ¥109 in 2010.[108]
GDP composition
Industries by GDP value-added 2012.[109] Values are converted using the exchange rate on 13 April 2013.[110]
| Industry | GDP value-added $ billions 2012 | % of total GDP |
|---|---|---|
| Other service activities | 1,238 | 23.5% |
| Manufacturing | 947 | 18.0% |
| Real estate | 697 | 13.2% |
| Wholesale and retail trade | 660 | 12.5% |
| Transport and communication | 358 | 6.8% |
| Public administration | 329 | 6.2% |
| Construction | 327 | 6.2% |
| Finance and insurance | 306 | 5.8% |
| Electricity, gas and water supply | 179 | 3.4% |
| Government service activities | 41 | 0.7% |
| Mining | 3 | 0.1% |
| Total | 5,268 | 100% |
Development of main indicators
The following table shows the main economic indicators in 1980–2017. Inflation under 2 % is in green.[111]
| Year | GDP (in Bil. US$ PPP) |
GDP per capita (in US$ PPP) |
GDP growth (real) |
Inflation rate (in Percent) |
Unemployment (in Percent) |
Government debt (in % of GDP) |
|---|---|---|---|---|---|---|
| 1980 | 1,041.7 | 8,921 | 2.0 % | 48.8 % | ||
| 1981 | ||||||
| 1982 | ||||||
| 1983 | ||||||
| 1984 | ||||||
| 1985 | ||||||
| 1986 | ||||||
| 1987 | ||||||
| 1988 | ||||||
| 1989 | ||||||
| 1990 | ||||||
| 1991 | ||||||
| 1992 | ||||||
| 1993 | ||||||
| 1994 | ||||||
| 1995 | ||||||
| 1996 | ||||||
| 1997 | ||||||
| 1998 | ||||||
| 1999 | ||||||
| 2000 | ||||||
| 2001 | ||||||
| 2002 | ||||||
| 2003 | ||||||
| 2004 | ||||||
| 2005 | ||||||
| 2006 | ||||||
| 2007 | ||||||
| 2008 | ||||||
| 2009 | ||||||
| 2010 | ||||||
| 2011 | ||||||
| 2012 | ||||||
| 2013 | ||||||
| 2014 | ||||||
| 2015 | ||||||
| 2016 | ||||||
| 2017 |
Sectors of the economy
Agriculture
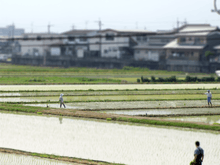
The Japanese agricultural sector accounts for about 1.4% of the total country's GDP.[112] Only 12% of Japan's land is suitable for cultivation.[113][114] Due to this lack of arable land, a system of terraces is used to farm in small areas.[115] This results in one of the world's highest levels of crop yields per unit area, with an overall agricultural self-sufficiency rate of about 50% on fewer than 56,000 km² (14 million acres) cultivated.
Japan's small agricultural sector, however, is also highly subsidized and protected, with government regulations that favor small-scale cultivation instead of large-scale agriculture as practiced in North America.[113] There has been a growing concern about farming as the current farmers are aging with a difficult time finding successors.[116]
Rice accounts for almost all of Japan's cereal production.[117] Japan is the second-largest agricultural product importer in the world.[117] Rice, the most protected crop, is subject to tariffs of 777.7%.[114][118]
Although Japan is usually self-sufficient in rice (except for its use in making rice crackers and processed foods) and wheat, the country must import about 50% of its requirements of other grain and fodder crops and relies on imports for half of its supply of meat.[119][120] Japan imports large quantities of wheat and soybeans.[117] Japan is the 5th largest market for EU agricultural exports.[121] Over 90% of mandarin oranges in Japan are grown in Japan.[120] Apples are also grown due to restrictions on apple imports.[122]
Fishery
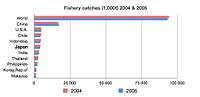
Japan ranked fourth in the world in 1996 in tonnage of fish caught.[123] Japan captured 4,074,580 metric tons of fish in 2005, down from 4,987,703 tons in 2000, 9,558,615 tons in 1990, 9,864,422 tons in 1980, 8,520,397 tons in 1970, 5,583,796 tons in 1960 and 2,881,855 tons in 1950.[124] In 2003, the total aquaculture production was predicted at 1,301,437 tonnes.[125] In 2010, Japan's total fisheries production was 4,762,469 fish.[126] Offshore fisheries accounted for an average of 50% of the nation's total fish catches in the late 1980s although they experienced repeated ups and downs during that period.
Coastal fishing by small boats, set nets, or breeding techniques accounts for about one third of the industry's total production, while offshore fishing by medium-sized boats makes up for more than half the total production. Deep-sea fishing from larger vessels makes up the rest. Among the many species of seafood caught are sardines, skipjack tuna, crab, shrimp, salmon, pollock, squid, clams, mackerel, sea bream, sauries, tuna and Japanese amberjack. Freshwater fishing, including salmon, trout and eel hatcheries and fish farms,[127] takes up about 30% of Japan's fishing industry. Among the nearly 300 fish species in the rivers of Japan are native varieties of catfish, chub, herring and goby, as well as such freshwater crustaceans as crabs and crayfish.[128] Marine and freshwater aquaculture is conducted in all 47 prefectures in Japan.[125]
Japan maintains one of the world's largest fishing fleets and accounts for nearly 15% of the global catch,[129] prompting some claims that Japan's fishing is leading to depletion in fish stocks such as tuna.[130] Japan has also sparked controversy by supporting quasi-commercial whaling.[131]
Industry
Japanese manufacturing and industry is very diversified, with a variety of advanced industries that are highly successful. Industry accounts for 24% of the nation's GDP.[112]
Industry is concentrated in several regions, with the Kantō region surrounding Tokyo, (the Keihin industrial region) as well as the Kansai region surrounding Osaka (the Hanshin industrial region) and the Tōkai region surrounding Nagoya (the Chūkyō–Tōkai industrial region) the main industrial centers.[27][28][29][30][31][132] Other industrial centers include the southwestern part of Honshū and northern Shikoku around the Seto Inland Sea (the Setouchi industrial region); and the northern part of Kyūshū (Kitakyūshū). In addition, a long narrow belt of industrial centers called the Taiheiyō Belt is found between Tokyo and Fukuoka, established by particular industries, that have developed as mill towns.
Japan enjoys high technological development in many fields, including consumer electronics, automobile manufacturing, semiconductor manufacturing, optical fibers, optoelectronics, optical media, facsimile and copy machines, and fermentation processes in food and biochemistry. However, many Japanese companies are facing emerging rivals from the United States, South Korea, and China.[133]
Automobile manufacturing
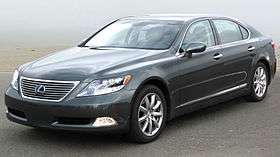
Japan is the third biggest producer of automobiles in the world.[24] Toyota is currently the world largest car maker, and the Japanese car makers Nissan, Honda, Suzuki, and Mazda also count for some of the largest car makers in the world.[134][135]
Mining and petroleum exploration
Japan's mining production has been minimal, and Japan has very little mining deposits.[136][137] However, massive deposits of rare earths have been found off the coast of Japan.[138] In the 2011 fiscal year, the domestic yield of crude oil was 820 thousand kiloliters, which was 0.4% of Japan's total crude processing volume.[139]
Services

Japan's service sector accounts for about three-quarters of its total economic output.[112] Banking, insurance, real estate, retailing, transportation, and telecommunications are all major industries such as Mitsubishi UFJ, Mizuho, NTT, TEPCO, Nomura, Mitsubishi Estate, ÆON, Mitsui Sumitomo, Softbank, JR East, Seven & I, KDDI and Japan Airlines counting as one of the largest companies in the world.[140][141] Four of the five most circulated newspapers in the world are Japanese newspapers.[142] The Koizumi government set Japan Post, one of the country's largest providers of savings and insurance services for privatization by 2015.[143] The six major keiretsus are the Mitsubishi, Sumitomo, Fuyo, Mitsui, Dai-Ichi Kangyo and Sanwa Groups.[144] Japan is home to 251 companies from the Forbes Global 2000 or 12.55% (as of 2013).[145]
Tourism
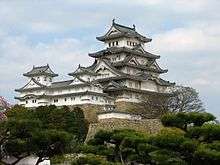
In 2012, Japan was the fifth most visited country in Asia and the Pacific, with over 8.3 million tourists.[146] In 2013, due to the weaker yen and easier visa requirements for southwest Asian countries, Japan received a record 11.25 million visitors, which was higher than the government's projected goal of 10 million visitors.[147][148][149] The government hopes to attract 40 million visitors a year by the 2020 Summer Olympics in Tokyo.[148] Some of the most popular visited places include the Shinjuku, Ginza, Shibuya and Asakusa areas in Tokyo, and the cities of Osaka, Kobe and Kyoto, as well as Himeji Castle.[150] Hokkaido is also a popular winter destination for visitors with several ski resorts and luxury hotels being built there.[148][151]
Finance
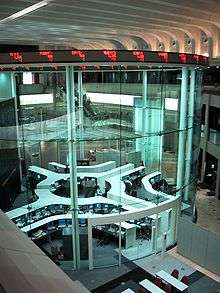
The Tokyo Stock Exchange is the third largest stock exchange in the world by market capitalization, as well as the 2nd largest stock market in Asia, with 2,292 listed companies.[152][153][154] The Nikkei 225 and the TOPIX are the two important stock market indexes of the Tokyo Stock Exchange.[155][156] The Tokyo Stock Exchange and the Osaka Stock Exchange, another major stock exchange in Japan, merged on 1 January 2013, creating one of the world's largest stock exchanges.[154] Other stock exchanges in Japan include the Nagoya Stock Exchange, Fukuoka Stock Exchange and Sapporo Securities Exchange.[157][158]
Labor force
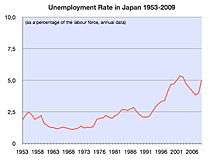
The unemployment rate in December 2013 was 3.7%, down 1.5 percentage points from the claimed unemployment rate of 5.2% in June 2009 due to the strong economic recovery.[159][160][161]
In 2008 Japan's labor force consisted of some 66 million workers—40% of whom were women—and was rapidly shrinking.[162] One major long-term concern for the Japanese labor force is its low birthrate.[163] In the first half of 2005, the number of deaths in Japan exceeded the number of births, indicating that the decline in population, initially predicted to start in 2007, had already started. While one countermeasure for a declining birthrate would be to remove barriers to immigration, despite taking new steps towards it, the Japanese government has been reluctant to do so, since foreign immigration to Japan has been unpopular among citizens.[164]
In 1989, the predominantly public sector union confederation, SOHYO (General Council of Trade Unions of Japan), merged with RENGO (Japanese Private Sector Trade Union Confederation) to form the Japanese Trade Union Confederation. Labor union membership is about 12 million.
Law and government
Japan ranks 27th of 185 countries in the ease of doing business index 2013.[165]
Japan has one of the smallest tax rates in the developed world.[166] After deductions, the majority of workers are free from personal income taxes. Consumption tax rate is only 8%, while corporate tax rates are high, second highest corporate tax rate in the world, at 36.8%.[166][167][168] However, the House of Representatives has passed a bill which will increase the consumption tax to 10% in October 2015.[169] The government has also decided to reduce corporate tax and to phase out automobile tax.[170][171]
In 2016, the IMF encouraged Japan to adopt an income policy that pushes firms to raise employee wages in combination with reforms to tackle the labor market dual tiered employment system to drive higher wages, on top of monetary and fiscal stimulus. Shinzo Abe has encouraged firms to raise wages by at least three percent annually (the inflation target plus average productivity growth).[172][173][174]
Shareholder activism is rare despite the fact that the corporate law gives shareholders strong powers over managers.[175] Under Prime Minister Shinzō Abe, corporate governance reform has been a key initiative to encourage economic growth. In 2012 around 40% of leading Japanese companies had any independent directors while in 2016 most all have begun to appoint independent directors.[172][176]
The government's liabilities include the second largest public debt of any nation with debt of over one quadrillion yen, or $8,535,340,000,000 in USD.[177][178][179] Former Prime Minister Naoto Kan has called the situation 'urgent'.[180]
Japan's central bank has the second largest foreign-exchange reserves after the People's Republic of China, with over one trillion US Dollars in foreign reserves.[181]
Culture
Overview
Nemawashi (根回し), or "consensus building", in Japanese culture is an informal process of quietly laying the foundation for some proposed change or project, by talking to the people concerned, gathering support and feedback, and so forth. It is considered an important element in any major change, before any formal steps are taken, and successful nemawashi enables changes to be carried out with the consent of all sides.
Japanese companies are known for management methods such as "The Toyota Way". Kaizen (改善, Japanese for "improvement") is a Japanese philosophy that focuses on continuous improvement throughout all aspects of life. When applied to the workplace, Kaizen activities continually improve all functions of a business, from manufacturing to management and from the CEO to the assembly line workers.[183] By improving standardized activities and processes, Kaizen aims to eliminate waste (see Lean manufacturing). Kaizen was first implemented in several Japanese businesses during the country's recovery after World War II, including Toyota, and has since spread to businesses throughout the world.[184] Within certain value systems, it is ironic that Japanese workers labor amongst the most hours per day, even though kaizen is supposed to improve all aspects of life.
Some companies have powerful enterprise unions and shuntō. The Nenko System or Nenko Joretsu, as it is called in Japan, is the Japanese system of promoting an employee based on his or her proximity to retirement. The advantage of the system is that it allows older employees to achieve a higher salary level before retirement and it usually brings more experience to the executive ranks. The disadvantage of the system is that it does not allow new talent to be combined with experience and those with specialized skills cannot be promoted to the already crowded executive ranks. It also does not guarantee or even attempt to bring the "right person for the right job".
Relationships between government bureaucrats and companies are often close. Amakudari (天下り amakudari, "descent from heaven") is the institutionalised practice where Japanese senior bureaucrats retire to high-profile positions in the private and public sectors. The practice is increasingly viewed as corrupt and a limitation on efforts to reduce ties between the private sector and the state that prevent economic and political reforms. Lifetime employment (shūshin koyō) and seniority-based career advancement have been common in the Japanese work environment.[166][185] Japan has begun to gradually move away from some of these norms.[186]
Salaryman (サラリーマン Sararīman, salaried man) refers to someone whose income is salary based; particularly those working for corporations. Its frequent use by Japanese corporations, and its prevalence in Japanese manga and anime has gradually led to its acceptance in English-speaking countries as a noun for a Japanese white-collar businessman. The word can be found in many books and articles pertaining to Japanese culture. Immediately following World War II, becoming a salaryman was viewed as a gateway to a stable, middle-class lifestyle. In modern use, the term carries associations of long working hours, low prestige in the corporate hierarchy, absence of significant sources of income other than salary, wage slavery, and karōshi. The term salaryman refers almost exclusively to males.
An office lady, often abbreviated OL (Japanese: オーエル Ōeru), is a female office worker in Japan who performs generally pink collar tasks such as serving tea and secretarial or clerical work. Like many unmarried Japanese, OLs often live with their parents well into early adulthood. Office ladies are usually full-time permanent staff, although the jobs they do usually have little opportunity for promotion, and there is usually the tacit expectation that they leave their jobs once they get married.
Freeter (フリーター furītā) (other spellings below) is a Japanese expression for people between the age of 15 and 34 who lack full-time employment or are unemployed, excluding homemakers and students. They may also be described as underemployed or freelance workers. These people do not start a career after high school or university but instead usually live as parasite singles with their parents and earn some money with low skilled and low paid jobs. The low income makes it difficult for freeters to start a family, and the lack of qualifications makes it difficult to start a career at a later point in life.
Karōshi (過労死 karōshi), which can be translated quite literally from Japanese as "death from overwork", is occupational sudden death. The major medical causes of karōshi deaths are heart attack and stroke due to stress.
Sōkaiya (総会屋 sōkaiya), (sometimes also translated as corporate bouncers, meeting-men, or corporate blackmailers) are a form of specialized racketeer unique to Japan, and often associated with the yakuza that extort money from or blackmail companies by threatening to publicly humiliate companies and their management, usually in their annual meeting (総会 sōkai). Sarakin (サラ金) is a Japanese term for moneylender, or loan shark. It is a contraction of the Japanese words for salaryman and cash. Around 14 million people, or 10% of the Japanese population, have borrowed from a sarakin. In total, there are about 10,000 firms (down from 30,000 a decade ago); however, the top seven firms make up 70% of the market. The value of outstanding loans totals $100 billion. The biggest sarakin are publicly traded and often allied with big banks.[187]
The first "Western-style" department store in Japan was Mitsukoshi, founded in 1904, which has its root as a kimono store called Echigoya from 1673. When the roots are considered, however, Matsuzakaya has an even longer history, dated from 1611. The kimono store changed to a department store in 1910. In 1924, Matsuzakaya store in Ginza allowed street shoes to be worn indoors, something innovative at the time.[188] These former kimono shop department stores dominated the market in its earlier history. They sold, or rather displayed, luxurious products, which contributed for their sophisticated atmospheres. Another origin of Japanese department store is that from railway company. There have been many private railway operators in the nation, and from the 1920s, they started to build department stores directly linked to their lines' termini. Seibu and Hankyu are the typical examples of this type. From the 1980s onwards, Japanese department stores face fierce competition from supermarkets and convenience stores, gradually losing their presences. Still, depāto are bastions of several aspects of cultural conservatism in the country. Gift certificates for prestigious department stores are frequently given as formal presents in Japan. Department stores in Japan generally offer a wide range of services and can include foreign exchange, travel reservations, ticket sales for local concerts and other events.
Keiretsu
A keiretsu (系列, "system" or "series") is a set of companies with interlocking business relationships and shareholdings. It is a type of business group. The prototypical keiretsu appeared in Japan during the "economic miracle" following World War II. Before Japan's surrender, Japanese industry was controlled by large family-controlled vertical monopolies called zaibatsu. The Allies dismantled the zaibatsu in the late 1940s, but the companies formed from the dismantling of the zaibatsu were reintegrated. The dispersed corporations were re-interlinked through share purchases to form horizontally integrated alliances across many industries. Where possible, keiretsu companies would also supply one another, making the alliances vertically integrated as well. In this period, official government policy promoted the creation of robust trade corporations that could withstand pressures from intensified world trade competition.[189]
The major keiretsu were each centered on one bank, which lent money to the keiretsu's member companies and held equity positions in the companies. Each central bank had great control over the companies in the keiretsu and acted as a monitoring entity and as an emergency bail-out entity. One effect of this structure was to minimize the presence of hostile takeovers in Japan, because no entities could challenge the power of the banks.
There are two types of keiretsu: vertical and horizontal. Vertical keiretsu illustrates the organization and relationships within a company (for example all factors of production of a certain product are connected), while a horizontal keiretsu shows relationships between entities and industries, normally centered on a bank and trading company. Both are complexly woven together and sustain each other.
The Japanese recession in the 1990s had profound effects on the keiretsu. Many of the largest banks were hit hard by bad loan portfolios and forced to merge or go out of business. This had the effect of blurring the lines between the keiretsu: Sumitomo Bank and Mitsui Bank, for instance, became Sumitomo Mitsui Banking Corporation in 2001, while Sanwa Bank (the banker for the Hankyu-Toho Group) became part of Bank of Tokyo-Mitsubishi UFJ. Additionally, many companies from outside the keiretsu system, such as Sony, began outperforming their counterparts within the system.
Generally, these causes gave rise to a strong notion in the business community that the old keiretsu system was not an effective business model, and led to an overall loosening of keiretsu alliances. While the keiretsu still exist, they are not as centralized or integrated as they were before the 1990s. This, in turn, has led to a growing corporate acquisition industry in Japan, as companies are no longer able to be easily "bailed out" by their banks, as well as rising derivative litigation by more independent shareholders.
Mergers and Acquisitions
Japanese companies have been involved in 50,759 deals between 1985 and 2018. This cumulates to a total value of 2,636 bil. USD which translates to 281,469.9 bil. YEN.[190] In the year 1999 there was an all-time high in terms of value of deals with almost 220 bil. USD. The most active year so far was 2017 with over 3,150 deals, but only a total value of 114 bil. USD (see graph "M&A in Japan by number and value").
Here is a list of the most important deals (ranked by value in bil. USD) in Japanese history:
| Date Announced | Acquiror Name | Acquiror Mid Industry | Acquiror Nation | Target Name | Target Mid Industry | Target Nation | Value of Transaction ($mil) |
| October 13, 1999 | Sumitomo Bank Ltd | Banks | Japan | Sakura Bank Ltd | Banks | Japan | 45,494.36 |
| February 18, 2005 | Mitsubishi Tokyo Financial Grp | Banks | Japan | UFJ Holdings Inc | Banks | Japan | 41,431.03 |
| August 20, 1999 | Fuji Bank Ltd | Banks | Japan | Dai-Ichi Kangyo Bank Ltd | Banks | Japan | 40,096.63 |
| March 27, 1995 | Mitsubishi Bank Ltd | Banks | Japan | Bank of Tokyo Ltd | Banks | Japan | 33,787.73 |
| July 18, 2016 | SoftBank Group Corp | Wireless | Japan | ARM Holdings PLC | Semiconductors | United Kingdom | 31,879.49 |
| August 20, 1999 | Fuji Bank Ltd | Banks | Japan | Industrial Bank of Japan Ltd | Banks | Japan | 30,759.61 |
| August 24, 2004 | Sumitomo Mitsui Finl Grp Inc | Banks | Japan | UFJ Holdings Inc | Banks | Japan | 29,261.48 |
| August 28, 1989 | Mitsui Taiyo Kobe Bank Ltd | Banks | Japan | Taiyo Kobe Bank Ltd | Banks | Japan | 23,016.80 |
| October 15, 2012 | SoftBank Corp | Wireless | Japan | Sprint Nextel Corp | Telecommunications Services | United States | 21,640.00 |
| September 20, 2017 | KK Pangea | Other Financials | Japan | Toshiba Memory Corp | Semiconductors | Japan | 17,930.00 |
Among the top 50 deals by value, 92% of the time the acquiring nation is Japan. Foreign direct investment is playing a much smaller role than national M&A in Japan.
Other economic indicators
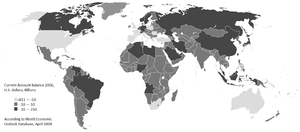
Net international investment position: 266,223 \ billion[192] (1st)[193]
Industrial Production Growth Rate: 7.5% (2010 est.)
Investment (gross fixed): 20.3% of GDP (2010 est.)
Household income or consumption by percentage share:
- Lowest 10%: 4.8%
- Highest 10%: 21.7% (1993)
Agriculture – Products: rice, sugar beets, vegetables, fruit, pork, poultry, dairy products, eggs, fish
Exports – Commodities: machinery and equipment, motor vehicles, semiconductors, chemicals
Imports – Commodities: machinery and equipment, fuels, foodstuffs, chemicals, textiles, raw materials (2001)
Exchange rates:
Japanese Yen per US$1 – 88.67 (2010), 93.57 (2009), 103.58 (2008), 117.99 (2007), 116.18 (2006), 109.69 (2005), 115.93 (2003), 125.39 (2002), 121.53 (2001), 105.16 (January 2000), 113.91 (1999), 130.91 (1998), 120.99 (1997), 108.78 (1996), 94.06 (1995)
Electricity:
- Electricity – consumption: 925.5 billion kWh (2008)
- Electricity – production: 957.9 billion kWh (2008 est.)
- Electricity – exports: 0 kWh (2008)
- Electricity – imports: 0 kWh (2008)
Electricity – Production by source:
- Fossil Fuel: 69.7%
- Hydro: 7.3%
- Nuclear: 22.5%
- Other: 0.5% (2008)
Electricity – Standards:
Oil:
- production: 132,700 bbl/d (21,100 m3/d) (2009) (46th)
- consumption: 4,363,000 bbl/d (693,700 m3/d) (2009) (3rd)
- exports: 380,900 barrels per day (60,560 m3/d) (2008) (64th)
- imports: 5,033,000 barrels per day (800,200 m3/d) (2008) (2nd)
- net imports: 4,620,000 barrels per day (735,000 m3/d) (2008 est.)
- proved reserves: 44,120,000 bbl (7,015,000 m3) (1 January 2010 est.)
See also

- Economic history of Japan
- Economic relations of Japan
- List of the largest trading partners of Japan
- Japan External Trade Organization
- Tokugawa coinage
- Tourism in Japan
- Japanese post-war economic miracle
- Japanese asset price bubble
- Machine orders, an economic indicator specific to the Japanese economy
- Quantitative easing
- Loans in Japan
Notes
- 1 2 3 4 "World Economic Outlook Database, October 2018 – Report for Selected Countries and Subjects". International Monetary Fund (IMF). Retrieved October 9, 2018.
- ↑ "World Bank forecast for Japan, June 2018 (p. 151)" (PDF). World Bank. Retrieved 11 September 2018.
- 1 2 "Latest indicators". Statistics Bureau, Ministry of Internal Affairs and Communications. Retrieved 9 June 2011.
- ↑ "CIA World Factbook: Japan". Central Intelligence Agency. 28 January 2014. Retrieved 7 February 2014.
- ↑ https://www.cia.gov/library/publications/the-world-factbook/fields/2172.html. Missing or empty
|title=(help) - ↑ "Labor force, total". World Bank. World Bank. Retrieved 2 September 2016.
- ↑ "Ease of Doing Business in Japan". Doingbusiness.org. Retrieved 24 November 2017.
- ↑ "Japanese Trade and Investment Statistics | Reports and Statistics - Japan External Trade Organization - JETRO". www.jetro.go.jp. Retrieved 2018-07-13.
- 1 2 "Japan – WTO Statistics Database". World Trade Organization. Retrieved 1 March 2017.
- ↑ "Japanese Trade and Investment Statistics | Reports and Statistics - Japan External Trade Organization - JETRO". www.jetro.go.jp. Retrieved 2018-07-13.
- ↑ "Stock of Foreign Direct Investment". CIA World Factbook.
- ↑ "Ministry of Finance Japan". Retrieved 2017-07-09.
- ↑ "Report for Selected Economic Indicators" (PDF). Imf.org. Retrieved 1 July 2015.
- ↑ "Development aid rises again in 2016 but flows to poorest countries dip". OECD. 2017-04-11. Retrieved 2017-09-25.
- ↑ "Sovereigns rating list". Standard & Poor's. Retrieved 26 May 2011.
- 1 2 3 Rogers, Simon; Sedghi, Ami (15 April 2011). "How Fitch, Moody's and S&P rate each country's credit rating". The Guardian. London. Retrieved 31 May 2011.
- ↑ "HOME > International Policy > Statistics > International Reserves/Foreign Currency Liquidity". Ministry of Finance Japan.
- ↑ "World Economic Outlook Database, April 2016 – Report for Selected Countries and Subjects". International Monetary Fund (IMF). Retrieved 6 October 2015.
- ↑ Kyung Lah (14 February 2011). "Japan: Economy slips to third in world". CNN.com. CNN.
- ↑ "Country statistical profile: Japan". OECD iLibrary. 28 February 2013. Retrieved 19 June 2013.
- ↑ Japan: 2017 Article IV Consultation : Press Release ; Staff Report ; and Statement by the Executive Director for Japan. International Monetary Fund. Asia and Pacific Department,. Washington, D.C.: International Monetary Fund. 2017. ISBN 9781484313497. OCLC 1009601181.
- ↑ "TANKAN :日本銀行 Bank of Japan". Bank of Japan. Boj.or.jp. Retrieved 1 February 2013.
- ↑ "Nikkei Indexes". indexes.nikkei.co.jp.
- 1 2 "2013 Production Statistics – First 6 Months". OICA. Retrieved 16 October 2013.
- ↑ "Statistics on Patents". World Intellectual Property Organization. 19 June 2013. Retrieved 16 February 2014.
- ↑ Morris, Ben (12 April 2012). "What does the future hold for Japan's electronics firms?". BBC News. Retrieved 16 October 2013.
- 1 2 Iwadare, Yoshihiko (1 April 2004). "Strengthening the Competitiveness of Local Industries: The Case of an Industrial Cluster Formed by Three Tokai Prefecters" (PDF). Nomura Research Institute. p. 16. Retrieved 16 February 2014.
- 1 2 Kodama, Toshihiro (1 July 2002). "Case study of regional university-industry partnership in practice". Institute for International Studies and Training. Retrieved 16 February 2014.
- 1 2 Mori, Junichiro; Kajikawa, Yuya; Sakata, Ichiro (2010). "Evaluating the Impacts of Regional Cluster Policies using Network Analysis" (PDF). International Association for Management of Technology. p. 9. Retrieved 16 February 2014.
- 1 2 Schlunze, Rolf D. "Location and Role of Foreign Firms in Regional Innovation Systems in Japan" (PDF). Ritsumeikan University. p. 25. Retrieved 16 February 2014.
- 1 2 "Profile of Osaka/Kansai" (PDF). Japan External Trade Organization Osaka. p. 10. Retrieved 16 February 2014.
- ↑ http://www.mitpressjournals.org/loi/adev#/doi/full/10.1162/adev_a_00096
- ↑ Chandler, Marc (19 August 2011). "The yen is a safe haven as Japan is the world's largest creditor". Credit Writedowns. Retrieved 19 June 2013.
- ↑ Obe, Mitsuru (28 May 2013). "Japan World's Largest Creditor Nation for 22nd Straight Year". The Wall Street Journal. Retrieved 14 October 2013.
- ↑ "Allianz Global Wealth Report 2015" (PDF). Allianz. 2015. Retrieved 24 March 2016.
- ↑ "Global 500 (updated)". Fortune.
- ↑ "Global 500 2013". Fortune.
- 1 2 Sanati, Cyrus. "Japan's latest economic stimulus exposes its dirty debt secret". Fortune.
- 1 2 Matthews, Chris. "Forget Greece, Japan is the world's real economic time bomb". Fortune.
- ↑ https://www.forbes.com/sites/peterpham/2017/12/11/when-will-japans-debt-crisis-implode/#130f861f4c6d
- ↑ "It's official: Japan's population is dramatically shrinking". Washington Post. 2016. Retrieved 2 January 2017.
- ↑ "World Population Prospects 2015" (PDF). United Nations Department of Economic and Social Affairs. 2015. Retrieved 2 January 2017.
- ↑ Nakamura, Toshihiro. "A Declining Technocratic Regime" (PDF). Democracy, Governance and Human Rights Programme Paper Number 9 December 2002. United Nations Research Institute for Social Development. Retrieved 20 June 2013.
- ↑ Marshall Cavendish Corporation (2007). World and Its Peoples: Eastern and Southern Asia. Marshall Cavendish. p. 1136. ISBN 978-0-7614-7631-3.
- ↑ "Whose lost decade?". The Economist. 19 November 2011.
- ↑ "Fitch Plans Japan Credit Downgrade". InvestAsian. Retrieved 12 March 2015.
- ↑ "Can Japan's countryside be saved from the edge of extinction?". The Japan Times.
- ↑ Otake, Tomoko (7 January 2014). "Abandoned homes a growing menace" – via Japan Times Online.
- ↑ "Perfect storm of factors conspires to empty Japan". The Japan Times.
- ↑ "Subscribe to read". www.ft.com.
- ↑ Austin (6 March 2015). "Why the Japanese Countryside Is Emptying". Tofugu.
- ↑ http://www.oecd.org/trade/agriculturaltrade/38893266.pdf
- ↑ http://www.fao.org/docrep/013/i1820e/i1820e01.pdf
- ↑ http://www.fao.org/docrep/016/i2727e/i2727e01.pdf
- ↑ "FAO National Aquaculture Sector Overview (NASO)". Fao.org. 1 February 2006. Retrieved 1 February 2013.
- ↑ "International trade in aquaculture products". Fao.org – FAO Fisheries & Aquaculture. 1 January 2002. Retrieved 1 February 2013.
- ↑ http://injapan.no/marine/files/2012/03/Miyahara-FA.pdf
- ↑ "東京都中央卸売市場 | 各市場のご紹介". Shijou.metro.tokyo.jp. Retrieved 1 February 2013.
- ↑ "Metropolitan Central Wholesale Market | Structure of The market". Shijou.metro.tokyo.jp. Retrieved 1 February 2013.
- ↑ Murray, Maryanne. "Tokyo: 10 Things to Do 1. Tsukiji Fish Market". TIME. Retrieved 1 February 2013.
- ↑ "Iconic Tsukiji fish market to close in 2013 for new redesign". The Japan Daily Press. Retrieved 1 February 2013.
- ↑ Masakatsu, Miyazaki (15 June 2008). "The Legend of "Zipangu," the Land of Gold". Nipponia. Retrieved 8 November 2013.
- ↑ Shimada, Ryūto (2006). The Intra-Asian Trade in Japanese Copper by the Dutch East India Company During the Eighteenth Century. p. 225. ISBN 9004150927.
- ↑ "The Bakuhan System". Encyclopaedia Britannica. February 15, 2018. Retrieved February 17, 2018.
- ↑ Battie, David, ed., Sotheby's Concise Encyclopedia of Porcelain, pp. 71-78, 1990, Conran Octopus. ISBN 1850292515
- ↑ Fukao, Kyoji (2007). Real GDP in Pre-War East Asia: A 1934–36 Benchmark Purchasing Power Parity Comparison with the US (PDF).
- ↑ "Japan: Patterns of Development". country-data.com. January 1994. Retrieved 28 December 2006.
- ↑ Business in context: an introduction to business and its environment by David Needle
- ↑ "Japan's Trap". MIT. 19 May 1999. Retrieved 6 June 2007.
- ↑ Masake, Hisane. A farewell to zero. Asia Times Online (2 March 2006). Retrieved on 2006-12-28.
- ↑ Spiegel, Mark (20 October 2006). "Did Quantitative Easing by the Bank of Japan "Work"?".
- ↑ Krugman, Paul. "Saving Japan". web.mit.edu.
- ↑ "Economic survey of Japan 2008: Bringing an end to deflation under the new monetary policy framework". 7 April 2008.
- ↑ Riley, Charles (4 April 2013). "Bank of Japan takes fight to deflation". CNN.
- ↑ Chapter 7 Energy Archived 5 January 2013 at the Wayback Machine., Statistical Handbook of Japan 2007
- ↑ Hiroko Tabuchi (13 July 2011). "Japan Premier Wants Shift Away From Nuclear Power". The New York Times.
- ↑ Kazuaki Nagata (3 January 2012). "Fukushima meltdowns set nuclear energy debate on its ear". The Japan Times.
- ↑ "Japan goes nuclear-free indefinitely". CBC News. 15 September 2013. Retrieved 9 November 2013.
- ↑ Pollack, Andrew (1 March 1997). "Japan's Road to Deep Deficit Is Paved With Public Works". The New York Times. Retrieved 15 November 2013.
- ↑ Chapter 9 Transport Archived 27 April 2011 at the Wayback Machine., Statistical Handbook of Japan
- ↑ "Why Does Japan Drive On The Left?". 2pass. Retrieved 11 November 2013.
- ↑ All-Japan Road Atlas.
- 1 2 3 "Prius No. 1 in Japan sales as green interest grows". USA Today. 8 January 2013. Retrieved 9 November 2013.
- ↑ The Association of Japanese Private Railways. 大手民鉄の現況(単体) (pdf) (in Japanese). Retrieved 27 November 2010.
- ↑ Nagata, Takeshi; Takahasi, Kentaro (5 November 2013). "Osaka dept stores locked in scrap for survival". The Japan News. Yomiuri Shimbun. Retrieved 12 November 2013.
- ↑ "What is Shinkansen (bullet train)? Most convenient and the fastest train service throughout Japan". JPRail.com. 8 January 2011. Retrieved 12 November 2013.
- ↑ Onishi, Norimitsu (28 April 2005). "An obsession with being on time". The New York Times. Retrieved 11 November 2013.
- ↑ Aoki, Mizuho (7 February 2013). "Bubble era's aviation legacy: Too many airports, all ailing". The Japan Times. Retrieved 11 November 2013.
- ↑ Mastny, Lisa (December 2001). "Traveling Light New Paths for International Tourism" (PDF). Worldwatch Paper. Retrieved 11 November 2013.
- ↑ "Year to date Passenger Traffic". Airports Council International. 8 November 2013. Retrieved 11 November 2013.
- ↑ "Narita airport prepares for battle with Asian hubs". The Japan Times. 25 October 2013. Retrieved 12 November 2013.
- ↑ "The JOC Top 50 World Container Ports" (PDF). JOC Group Inc. Retrieved 11 November 2013.
- ↑ "Nuclear Power in Japan". World Nuclear Association. November 2013. Retrieved 15 November 2013.
- ↑ "Japan's Energy Supply Situation and Basic Policy". FEPC. Retrieved 15 November 2013.
- ↑ "Japan". Energy Information Administration. Retrieved 15 November 2013.
- ↑ Iwata, Mari (12 November 2013). "Fukushima Watch: Some Power Companies in Black without Nuclear Restarts". The Wall Street Journal. Retrieved 15 November 2013.
- ↑ "A lesson in energy diversification". The Japan Times. 1 November 2013. Retrieved 15 November 2013.
- ↑ Tsukimori, Osamu; Kebede, Rebekah (15 October 2013). "Japan on gas, coal power building spree to fill nuclear void". Reuters. Retrieved 15 November 2013.
- ↑ "International Energy Statistics". Energy Information Administration. Retrieved 15 November 2013.
- ↑ Watanabe, Chisaki (31 October 2013). "Kyocera Boosts Solar Sales Goal on Higher Demand in Japan". Bloomberg. Retrieved 15 November 2013.
- ↑ Maeda, Risa (25 October 2013). "Japan kerosene heater sales surge on power worries". Reuters. Retrieved 15 November 2013.
- ↑ "Japan may soon get London-style taxis". The Asahi Shimbun. 11 July 2013. Retrieved 15 November 2013.
- ↑ Suzuki, Takuya (1 May 2013). "Japan, Saudi Arabia agree on security, energy cooperation". The Asahi Shimbun. Retrieved 15 November 2013.
- ↑ "Abe clinches nuclear technology deal with Abu Dhabi". The Japan Times. 3 May 2013. Retrieved 15 November 2013.
- ↑ "Report for Selected Countries and Subjects". Retrieved 16 November 2013.
- ↑ "Statistics Bureau Home Page/Chapter 3 National Accounts". Retrieved 3 March 2015.
- ↑ "Measuring Worth - Japan". Retrieved 3 March 2015.
- ↑ "Yearly Average Currency Exchange Rates Translating foreign currency into U.S. dollars". IRS. 2010. Retrieved 16 November 2013.
- ↑ Statistics Division of Gifu Prefecture Archived 14 October 2007 at the Wayback Machine.. (in Japanese) Gifu Prefecture. Accessed 2 November 2007.
- ↑ "USD/JPY – U. S. Dollar / Japanese Yen Conversion". Yahoo! Finance. Retrieved 19 June 2013.
- ↑ "Report for Selected Countries and Subjects". www.imf.org. Retrieved 2018-09-10.
- 1 2 3 "Japan Country Report". Global Finance. Retrieved 16 November 2013.
- 1 2 "As Farmers Age, Japan Rethinks Relationship With Food, Fields". PBS. 12 June 2012. Archived from the original on 21 November 2013. Retrieved 21 November 2013.
- 1 2 "Trip Report – Japan Agricultural Situation". United States Department of Agriculture. 17 August 2012. Retrieved 21 November 2013.
- ↑ Nagata, Akira; Chen, Bixia (22 May 2012). "Urbanites Help Sustain Japan's Historic Rice Paddy Terraces". Our World. Retrieved 21 November 2013.
- ↑ "How will Japan's farms survive?". The Japan Times. 28 June 2013. Retrieved 21 November 2013.
- 1 2 3 "Japan – Agriculture". Nations Encyclopedia. Retrieved 21 November 2013.
- ↑ "With fewer, bigger plots and fewer part-time farmers, agriculture could compete". The Economist. 13 April 2013. Retrieved 21 November 2013.
- ↑ "Japan Immigration Work Permits and Visas". Skill Clear. Retrieved 1 December 2013.
- 1 2 Nagata, Kazuaki (26 February 2008). "Japan needs imports to keep itself fed". The Japan Times. Retrieved 1 December 2013.
- ↑ "Agricultural trade in 2012: A good story to tell in a difficult year?" (PDF). European Union. January 2013. p. 14. Retrieved 1 December 2013.
- ↑ Wheat, Dan (14 October 2013). "Japan may warm to U.S. apples". Capital Press. Retrieved 1 December 2013.
- ↑ "World review of fisheries and aquaculture". Food and Agriculture Organization. Retrieved 18 January 2014.
- ↑ Brown, Felicity (2 September 2003). "Fish capture by country". The Guardian. Retrieved 18 January 2014.
- 1 2 "Japan". Food and Agriculture Organization. Retrieved 18 January 2014.
- ↑ "World fisheries production, by capture and aquaculture, by country (2010)" (PDF). Food and Agriculture Organization. Archived from the original (PDF) on 25 May 2017. Retrieved 18 January 2014.
- ↑ Willoughby, Harvey. "FRESHWATER FISH CULTURE IN JAPAN". National Oceanic and Atmospheric Administration. Retrieved 20 June 2013.
- ↑ Butler, Rhett Ayers (8 August 2007). "List of Freshwater Fishes for Japan". Mongabay. Retrieved 20 June 2013.
- ↑ "The World Factbook". Central Intelligence Agency. Retrieved 1 February 2014.
- ↑ "UN tribunal halts Japanese tuna over-fishing". Asia Times. 31 August 1999. Retrieved 1 February 2014.
- ↑ Black, Richard (22 June 2005). "Japanese whaling 'science' rapped". BBC News. Retrieved 1 February 2014.
- ↑ Karan, Pradyumna (2010). Japan in the 21st Century: Environment, Economy, and Society. University Press of Kentucky. p. 416. ISBN 0813127637.
- ↑ Cheng, Roger (9 November 2012). "The era of Japanese consumer electronics giants is dead". CNET. Retrieved 11 November 2013.
- ↑ Dawson, Chester (28 January 2013). "Toyota Again World's Largest Auto Maker". The Wall Street Journal. Retrieved 21 November 2013.
- ↑ "WORLD MOTOR VEHICLE PRODUCTION OICA correspondents survey" (PDF). OICA. 2012. Retrieved 21 November 2013.
- ↑ "Japan Mining". Library of Congress Country Studies. January 1994. Retrieved 8 December 2013.
- ↑ "Overview" (PDF). Ministry of Economy, Trade and Industry. 2005. Retrieved 8 December 2013.
- ↑ Jamasmie, Cecilia (25 March 2013). "Japan's massive rare earth discovery threatens China's supremacy". Mining.com. Retrieved 8 December 2013.
- ↑ "Petroleum Industry in Japan 2013" (PDF). Petroleum Association of Japan. September 2013. p. 71. Retrieved 8 December 2013.
- ↑ "Fortune Global 500". CNNMoney. Retrieved 16 November 2013.
- ↑ "The World's Biggest Public Companies". Forbes. Retrieved 16 November 2013.
- ↑ "National Newspapers Total Circulation 2011". International Federation of Audit Bureaux of Circulations. Retrieved 2 February 2014.
- ↑ Fujita, Junko (26 October 2013). "Japan govt aims to list Japan Post in three years". Reuters. Retrieved 16 November 2013.
- ↑ "The Keiretsu of Japan". San José State University.
- ↑ Rushe, Dominic. "Chinese banks top Forbes Global 2000 list of world's biggest companies". The Guardian. Retrieved 9 October 2013.
- ↑ "Tourism Highlights 2013 Edition" (PDF). World Tourism Organization. Archived from the original (PDF) on 30 October 2013. Retrieved 8 December 2013.
- ↑ "Japan marks new high in tourism". Bangkok Post. 9 January 2014. Retrieved 9 January 2014.
- 1 2 3 "Attracting more tourists to Japan". The Japan Times. 6 January 2014. Retrieved 9 January 2014.
- ↑ Williams, Carol (11 December 2013). "Record 2013 tourism in Japan despite islands spat, nuclear fallout". Los Angeles Times. Retrieved 9 January 2014.
- ↑ Schoenberger, Chana R., (3 July 2008). "Japan's 10 Most Popular Tourist Attractions". Forbes. Retrieved 8 December 2013.
- ↑ Takahara, Kanako (8 July 2008). "Boom time for Hokkaido ski resort area". The Japan Times. Retrieved 9 January 2014.
- ↑ "NYSE Calendar". New York Stock Exchange. 31 January 2007. Retrieved 7 February 2014.
- ↑ "China becomes world's third largest stock market". The Economic Times. 19 June 2010. Retrieved 7 February 2014.
- 1 2 "Japan approves merger of Tokyo and Osaka exchanges". BBC News. 5 July 2012. Retrieved 7 February 2014.
- ↑ "The Nikkei 225 Index Performance". Finfacts. Retrieved 7 February 2014.
- ↑ "Tokyo Stock Exchange Tokyo Price Index TOPIX". Bloomberg. Retrieved 7 February 2014.
- ↑ Smith, Simon (22 January 2014). "Horizons introduces leveraged and inverse MSCI Japan ETFs". eftstrategy.com. Retrieved 7 February 2014.
- ↑ "About JSCC History". Japan Securities Clearing Corporation. Retrieved 7 February 2014.
- ↑ "雇用情勢は一段と悪化、5月失業率は5年8カ月ぶり高水準(Update3)". Bloomberg. 30 June 2009. Retrieved 1 February 2013.
- ↑ Fujioka, Toru (29 June 2009). "Japan's Jobless Rate Rises to Five-Year High of 5.2% (Update2)". Bloomberg News. Bloomberg. Retrieved 1 February 2013.
- ↑ Rochan, M (31 January 2014). "Japan's Unemployment Rate Drops to Six-Year Low Amid Rising Inflation". International Business Times. Retrieved 29 April 2014.
- ↑ "Will Abenomics Ensure Japan's Revival?" (PDF). The New Global. Retrieved 19 June 2013.
- ↑ Traphagan, John (4 August 2014). "Japan's Biggest Challenge (and It's Not China): A Plummeting Population". The National Interest. Retrieved 7 August 2014.
- ↑ Dyloco, Peter (5 January 2012). "Why are Japanese averse to immigration?". Japan Today. Retrieved 7 August 2014.
- ↑ "Economy Rankings". Doing Business. Archived from the original on 6 February 2015. Retrieved 25 November 2013.
- 1 2 3 OECD: Economic survey of Japan 2008 Archived 9 November 2010 at the Wayback Machine.
- ↑ Temple-West, Patrick; Dixon, Kim (30 March 2012). "US displacing Japan as No 1 for highest corp taxes". Reuters. Retrieved 1 February 2014.
- ↑ Isidore, Chris (27 March 2012). "U.S. corporate tax rate: No. 1 in the world". CNNMoney. Retrieved 1 February 2014.
- ↑ "Update: Lower House passes bills to double consumption tax". The Asahi Shimbun. 26 June 2012. Archived from the original on 22 June 2013. Retrieved 25 November 2013.
- ↑ "Japan to Phase Out Automobile Tax". NASDAQ. 21 November 2013. Retrieved 25 November 2013.
- 1 2 "Overhyped, underappreciated". The Economist. ISSN 0013-0613. Retrieved 31 July 2016.
- ↑ "IMF urges Japan to 'reload' Abenomics". Retrieved 31 July 2016.
- ↑ "Japan: Staff Concluding Statement of the 2016 Article IV Mission". www.imf.org. Retrieved 31 July 2016.
- ↑ Nagata, Kazuaki (27 April 2015). "New rules are pushing Japanese corporations to tap more outside directors". The Japan Times Online. ISSN 0447-5763. Retrieved 31 July 2016.
- ↑ "5. Report for Selected Countries and Subjects". International Monetary Fund. Retrieved 25 November 2013.
- ↑ Keck, Zachary (10 August 2013). "Japan's Debt About 3 Times Larger Than ASEAN's GDP". The Diplomat. Retrieved 25 November 2013.
- ↑ Einhorn, Bruce (9 August 2013). "Japan Gets to Know a Quadrillion as Debt Hits New High". Bloomberg. Retrieved 25 November 2013.
- ↑ "Kan warns of Greece-like debt crisis " Japan Today: Japan News and Discussion". Japantoday.com. 11 June 2010. Retrieved 1 February 2013.
- ↑ "Japan's forex reserves up for second straight month". Kuwait News Agency. 6 June 2014. Retrieved 3 July 2014.
- ↑ https://asia.nikkei.com/Business/Companies/AirAsia-had-talks-with-cash-strapped-HNA-over-asset-purchases
- ↑ Imai, Masaaki (1986). Kaizen: The Key to Japan's Competitive Success. New York, NY: Random House.
- ↑ Europe Japan Centre, Kaizen Strategies for Improving Team Performance, Ed. Michael Colenso, London: Pearson Education Limited, 2000
- ↑ "Japan's Economy: Free at last". The Economist. 20 July 2006. Retrieved 29 March 2007.
- ↑ "Going hybrid". The Economist. Retrieved 3 March 2015.
- ↑ Lenders of first resort, The Economist, 22 May 2008
- ↑ "松坂屋「ひと・こと・もの」語り". Matsuzakaya.co.jp. Retrieved 1 February 2013.
- ↑ "Japan Again Plans Huge Corporations," New York Times. 17 July 1954.
- ↑ "M&A Statistics by Countries - Institute for Mergers, Acquisitions and Alliances (IMAA)". Institute for Mergers, Acquisitions and Alliances (IMAA). Retrieved 2018-02-26.
- ↑ Current account balance, U.S. dollars, Billions from IMF World Economic Outlook Database, April 2008
- ↑ "International Investment Position of Japan (End of 2009)". Ministry of Finance, Japan. Retrieved 8 May 2011.
- ↑ "「日本売り」なぜ起きない 円安阻むからくりに迫る". Nihon Keizai Shimbun. 8 May 2011. Retrieved 8 May 2011.
External links
| Wikimedia Commons has media related to Economy of Japan. |
- Bank of Japan
- Minister of Finance (Japan)
- Cabinet Office Monthly Economic Report and Main Economic Indicators
- Japan economy at a glance at the Financial Times
- Japan profile at The World Bank
- Japan - OECD
| ||||||||||||||||||||||||||||||||||||||||||||||