Economy of the Gambia
 Bird-watching tourists in the Gambia | |
| Currency | Dalasi |
|---|---|
| 1 July – 30 June | |
Trade organisations | AU and WTO |
| Statistics | |
| GDP | $1.040 billion (2010 est.) |
GDP growth |
4.3% (2015), 2.2% (2016), 3.5% (2017e), 5.4% (2018f) [1] |
GDP per capita | $1,700 (2016 est.) |
GDP by sector | agriculture: 33%, industry: 8.7%, services: 58.3% (2008 est.) |
| 6% (2008 est.) | |
Population below poverty line | 61.3 (2003 est.) |
| 50.2 (1998) | |
Labour force | 400,000 |
Labour force by occupation | agriculture 75%, industry, commerce, and services 19%, government 6% |
| Unemployment | 8.6% |
Average gross salary | $0.57 per man-hour (2009) |
Main industries | processing peanuts, fish, and hides; tourism; beverages; agricultural machinery assembly, woodworking, metalworking; clothing |
| 145th (2017)[2] | |
| External | |
| Exports | $132 million (f.o.b., 1998) |
Export goods | peanuts and peanut products, fish, cotton lint, palm kernels. |
Main export partners |
|
| Imports | $201 million (f.o.b., 1998) |
Import goods | foodstuffs, manufactures, fuel, machinery and transport equipment. |
Main import partners |
|
FDI stock | N/A (2011) |
Gross external debt | $430 million (1997 est.) |
| Public finances | |
| 120% of GDP (2017) | |
| Revenues | D3.8 billion (2009) |
| Expenses | $D733.6 million (2011) |
| Economic aid | $45.4 million (1995) |
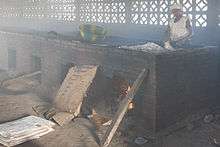
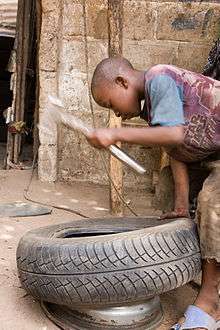
The Gambia has no important mineral or other natural resources, and has a limited agricultural base. About 75% of the population depends on crops and livestock for its livelihood. Small-scale manufacturing activity features the processing of peanuts, fish, and animal hides.
Short-run economic progress remains highly dependent on foreign aid, and on responsible government economic management as forwarded by International Monetary Fund technical help and advice.
Economic history
Current GDP per capita of the Gambia registered a peak growth of 23.3% in the 1970s. Economic growth slowed by 8.30% in the 1980s and a further 5.20% in the 1990s.
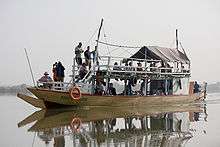
Re-export trade normally constitutes a major segment of economic activity, but the 50% devaluation of the CFA franc in January 1994 made Senegalese goods more competitive and hurt the re-export trade. The Gambia has benefited from a rebound in tourism after its decline in response to the military's takeover in July 1994.
Macro-economic trend
This is a chart of trend of gross domestic product of Gambia at market prices estimated[5] by the International Monetary Fund with figures in millions of Dalasi (currency used in Gambia).
| Year | Gross Domestic Product | US dollar exchange | Inflation index (2000=100) |
|---|---|---|---|
| 1980 | 435 | 1.71 Dalasi | 13 |
| 1985 | 782 | 4.09 Dalasi | 25 |
| 1990 | 2,367 | 8.13 Dalasi | 65 |
| 1995 | 3,617 | 9.49 Dalasi | 90 |
| 2000 | 5,382 | 12.78 Dalasi | 100 |
| 2005 | 13,174 | 28.70 Dalasi | 158 |
For purchasing power parity comparisons, the US dollar is exchanged at 4.35 Dalasi only.
The Gambia's economy is characterized by traditional subsistence agriculture, a historic reliance on peanuts or groundnuts for export earnings, a re-export trade built up around its ocean port, low import duties, minimal administrative procedures, a fluctuating exchange rate with no exchange controls, and a significant tourism industry. Average wages in 2007 hover around $1–2 per day.
Economic sectors
Agriculture
Agriculture accounts for 23% of gross domestic product (GDP) and employs 75% of the labor force. Within agriculture, peanut production accounts for 5.3% of GDP, other crops 8.3%, livestock 4.4%, fishing 1.8%, and forestry 0.5%.
Industry
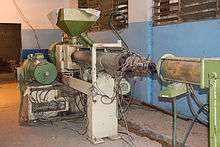
Industry accounts for 12% of GDP. Manufacturing accounts for 6% of GDP. The limited amount of manufacturing is primarily agriculturally based (e.g., peanut processing, bakeries, a brewery, and a tannery). Other manufacturing activities include soap, soft drinks, and clothing. Services account for 19% of GDP.
Tourism
Tourism in Gambia has three major strands. There is the traditional sun seeking holiday making use of the hot climate and wonderful beaches. The Gambia is also usually the first African destination for many European birders, in view of its easily accessed and spectacular avian fauna. There are also a significant number of African Americans tracing their roots in this country, from which so many Africans were taken during the slave trade.
The tourist season is the dry season, during the Northern Hemisphere winter.
Trade
In FY 1999, the UK and other EU countries were the Gambia's major domestic export markets, accounting for 86% of all exports. This was followed by Asia at 14% of exports, and the African at 8% of exports.
The U.K. and the other EU countries - namely, Germany, France, Netherlands, and Belgium - were the major source of imports, accounting for 60% of the total share of imports, followed by Asia at 23%, and African countries at 17%. The Gambia re-exports 11% of its exports going to and 14.6% of its imports coming from the United States.
Statistics
GDP:
- purchasing power parity $2.264 billion (2008 est.)
- real growth rate: 5.5% (2008 est.)
- per capita: purchasing power parity - $1,300 (2008 est.)
- composition by sector:
- agriculture: 33%
- industry: 8.7%
- services: 58.3% (2008 est.)
Inflation rate (consumer prices): 6% (2008 est.)
Labor force: 400,000
Labor force - by occupation: agriculture 75%, industry, commerce, and services 19%, government 6%
Budget:
- revenues: $88.6 million
- expenditures: $98.2 million, including capital expenditures of $ (Not Available) (FY96/97 est.)
Industries: processing peanuts, fish, and hides; tourism; beverages; agricultural machinery assembly, woodworking, metalworking; clothing
Electricity
- production: 75 GWh, entirely from fossil fuels (1998)
- consumption: 70 GWh (1998)
- Electricity is not imported or exported from the Gambia.
Agriculture - products: peanuts, pearl millet, sorghum, rice, maize, cassava (tapioca), palm kernels; cattle, sheep, goats; forest and fishery resources not fully exploited.
Exports: $132 million (f.o.b., 1998)
- commodities: peanuts and peanut products, fish, cotton lint, palm kernels.
- partners: Benelux 78%, Japan, United Kingdom, Hong Kong, France, Spain (1997)
Imports: $201 million (f.o.b., 1998)
- commodities: foodstuffs, manufactures, fuel, machinery and transport equipment.
- partners: Hong Kong, United Kingdom, Netherlands, Ivory Coast, France, Senegal, Belgium (1997)
Debt - external: $430 million (1997 est.)
Economic aid - recipient: $45.4 million (1995)
Currency: Dalasi (D)
Exchange rates: dalasi (D) per US$1 – 43.860 (January 2017), 11.626 (November 1999), 10.643 (1998), 10.200 (1997), 9.789 (1996), 9.546 (1995)
Fiscal year: 1 July - 30 June
See also
References
- ↑ "World Bank forecast for Gambia, The, June 2018 (p. 153)" (PDF). World Bank. Retrieved 11 September 2018.
- ↑ "Ease of Doing Business in Gambia, The". Doingbusiness.org. Retrieved 2017-01-25.
- ↑ "Export Partners of the Gambia". CIA World Factbook. 2013. Retrieved 2015-05-11.
- ↑ "Import Partners of the Gambia". CIA World Factbook. 2013. Retrieved 2015-05-11.
- ↑ International Monetary Fund
Further reading
- Sternfeldt, Ann-Britt. (2000). The Good Tourist in the Gambia: Travelguide for Conscious Tourists. Translated from Swedish by Rolli Fölsch. TheGoodTourist. Sexdrega, Sweden. ISBN 91-974010-4-8.
External links
- Economy of the Gambia at Curlie (based on DMOZ)
- The Gambia latest trade data on ITC Trade Map
- Company formation Gambia
| History |  | ||
|---|---|---|---|
| Geography | |||
| Politics |
| ||
| Economy | |||
| Culture |
| ||