Economy of the United Kingdom
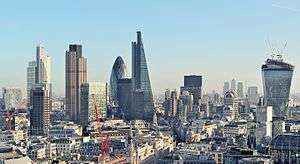 The City of London is the financial hub of the UK. | |
| Currency | Pound sterling (GBP) |
|---|---|
| 6 April – 5 April | |
Trade organisations | European Union,[lower-alpha 1] OECD, AIIB and World Trade Organization |
| Statistics | |
| GDP |
$2.808 trillion (nominal; 2018)[1] $3.033 trillion (PPP; 2018)[1] |
| GDP rank | |
GDP growth | |
GDP per capita | |
GDP per capita rank | |
GDP by sector |
|
| |
| 0.75% | |
Population below poverty line | 15% (2013 est.)[5] |
|
| |
Labour force | 32.4 million (June 2018) (employment rate 76%)[7] |
Labour force by occupation |
|
| Unemployment |
|
Average gross salary | £613 weekly (February 2018)[9] |
Main industries |
List
|
| 7th (2018)[10] | |
| External | |
| Exports |
|
Export goods |
|
Main export partners |
|
| Imports |
|
Import goods |
|
Main import partners |
|
FDI stock |
|
|
| |
Gross external debt |
|
|
| |
| Public finances | |
| (85.8% of GDP)(2018)[19] | |
| Revenues |
|
| Expenses |
|
| Economic aid | donor: ODA, $18.01 billion (2016)[21] |
Foreign reserves |
|
The economy of the United Kingdom is highly developed and market-oriented.[26][27] It is the fifth-largest national economy in the world measured by nominal gross domestic product (GDP), ninth-largest measured by purchasing power parity (PPP), and nineteenth-largest measured by GDP per capita, comprising 3.5% of world GDP.[28]
In 2016, the UK was the tenth-largest goods exporter in the world and the fifth-largest goods importer. It also had the second-largest inward foreign direct investment,[29] and the third-largest outward foreign direct investment.[30] The UK is one of the most globalised economies,[31] and it is composed of the economies of England, Scotland, Wales and Northern Ireland.[lower-alpha 2]
The service sector dominates the UK economy, contributing around 80% of GDP;[32] the financial services industry is particularly important, and London is the world's largest financial centre.[33] Britain's aerospace industry is the second-largest national aerospace industry.[34] Its pharmaceutical industry, the tenth-largest in the world,[35] plays an important role in the economy. Of the world's 500 largest companies, 26 are headquartered in the UK.[36] The economy is boosted by North Sea oil and gas production; its reserves were estimated at 2.8 billion barrels in 2016,[37] although it has been a net importer of oil since 2005.[38] There are significant regional variations in prosperity, with South East England and North East Scotland being the richest areas per capita. The size of London's economy makes it one of the largest cities by GDP in Europe.[39]
In the 18th century the UK was the first country to industrialise,[40][41][42] and during the 19th century it had a dominant role in the global economy,[43] accounting for 9.1% of the world's GDP in 1870.[44] From the late 19th century the Second Industrial Revolution was also taking place rapidly in the United States and the German Empire; this presented an increasing economic challenge for the UK. The costs of fighting World War I and World War II further weakened the UK's relative position. In the 21st century, however, it remains a global power and has an influential role in the world economy.[45][46][47][48][49][50]
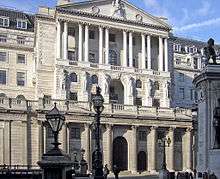
Government involvement in the British economy is primarily exercised by Her Majesty's Treasury, headed by the Chancellor of the Exchequer, and the Department for Business, Energy and Industrial Strategy. Since 1979 management of the economy has followed a broadly laissez-faire approach.[51][52][26][27][53][54] The Bank of England is the UK's central bank and since 1997 its Monetary Policy Committee has been responsible for setting interest rates, quantitative easing, and forward guidance.
The currency of the UK is the pound sterling, which is the world's fourth-largest reserve currency after the United States Dollar, the Euro and the Japanese Yen,[55] and is also one of the ten most-valued currencies in the world.
The UK is a member of the Commonwealth, the European Union (currently until 30 March 2019), the G7, the G20, the International Monetary Fund, the Organisation for Security and Co-operation in Europe, the World Bank, the World Trade Organisation, Asian Infrastructure Investment Bank and the United Nations.
History
1945 to 1979
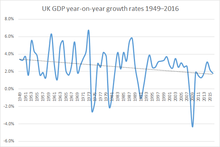
After the Second World War, a new Labour government fully nationalised the Bank of England, civil aviation, telephone networks, railways, gas, electricity, and the coal, iron and steel industries, affecting 2.3 million workers.[56] Post-war, the United Kingdom enjoyed a long period without a major recession; there was a rapid growth in prosperity in the 1950s and 1960s, with unemployment staying low and not exceeding 3.5% until the early 1970s.[57] The annual rate of growth between 1960 and 1973 averaged 2.9%, although this figure was far behind other European countries such as France, West Germany and Italy.[58]
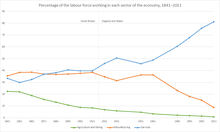
Deindustrialisation meant the closure of operations in mining, heavy industry, and manufacturing, resulting in the loss of highly paid working-class jobs.[59] The UK's share of manufacturing output had risen from 9.5% in 1830 during the Industrial Revolution to 22.9% in the 1870s. It fell to 13.6% by 1913, 10.7% by 1938, and 4.9% by 1973.[60] Overseas competition, lack of innovation, trade unionism, the welfare state, loss of the British Empire, and cultural attitudes have all been put forward as explanations.[61] It reached crisis point in the 1970s against the backdrop of a worldwide energy crisis, high inflation, and a dramatic influx of low-cost manufactured goods from Asia.[62]
During the 1973 oil crisis, the 1973–74 stock market crash, and the secondary banking crisis of 1973–75, the British economy fell into the 1973–75 recession and the government of Edward Heath was ousted by the Labour Party under Harold Wilson, which had previously governed from 1964 to 1970. Wilson formed a minority government in March 1974 after the general election on 28 February ended in a hung parliament. Wilson secured a three-seat overall majority in a second election in October that year.
The UK recorded weaker growth than many other European nations in the 1970s; even after the recession, the economy was blighted by rising unemployment and double-digit inflation, which exceeded 20% more than once and was rarely below 10% after 1973.
In 1976, the UK was forced to apply for a loan of £2.3 billion from the International Monetary Fund. Denis Healey, then Chancellor of the Exchequer, was required to implement public spending cuts and other economic reforms in order to secure the loan, and for a while the British economy improved, with growth of 4.3% in early 1979. However, following the Winter of Discontent, when the UK was hit by numerous public sector strikes, the government of James Callaghan lost a vote of no confidence in March 1979. This triggered the general election on 3 May 1979 which resulted in Margaret Thatcher's Conservative Party forming a new government.
1979 to 1997
A new period of neo-liberal economics began with this election. During the 1980s, many state-owned industries and utilities were privatised, taxes cut, trade union reforms passed and markets deregulated. GDP fell by 5.9% initially,[63] but growth subsequently returned and rose to an annual rate of 5% at its peak in 1988, one of the highest rates of any country in Europe.[64][65]
Thatcher's modernisation of the economy was far from trouble-free; her battle with inflation, which in 1980 had risen to 21.9%, resulted in a substantial increase in unemployment from 5.3% in 1979 to over 10.4% by the start of 1982, peaking at nearly 11.9% in 1984 – a level not seen in Britain since the Great Depression.[66] The rise in unemployment coincided with the early 1980s global recession, after which UK GDP did not reach its pre-recession rate until 1983. In spite of this, Thatcher was re-elected in June 1983 with a landslide majority. Inflation had fallen to 3.7%, while interest rates were relatively high at 9.56%.[66]
The increase in unemployment was largely due to the government's economic policy which resulted in the closure of outdated factories and coal pits. Manufacturing in England and Wales declined from around 38% of jobs in 1961 to around 22% in 1981.[67] This trend continued for most of the 1980s, with newer industries and the service sector enjoying significant growth. Many jobs were also lost as manufacturing became more efficient and fewer people were required to work in the sector. Unemployment had fallen below 3 million by the time of Thatcher's third successive election victory in June 1987; and by the end of 1989 it was down to 1.6 million.[68]
Britain's economy slid into another global recession in late 1990; it shrank by a total of 6% from peak to trough,[69] and unemployment increased from around 6.9% in spring 1990 to nearly 10.7% by the end of 1993. However, inflation dropped from 10.9% in 1990 to 1.3% three years later.[66] The subsequent economic recovery was extremely strong, and unlike after the early 1980s recession, the recovery saw a rapid and substantial fall in unemployment, which was down to 7.2% by 1997,[66] although the popularity of the Conservative government had failed to improve with the economic upturn. The government won a fourth successive election in 1992 under John Major, who had succeeded Thatcher in November 1990, but soon afterwards came Black Wednesday, which damaged the Conservative government's reputation for economic competence, and from that stage onwards, the Labour Party was ascendant in the opinion polls, particularly in the immediate aftermath of Tony Blair's election as party leader in July 1994 after the sudden death of his predecessor John Smith.
Despite two recessions, wages grew consistently by around 2% per year in real terms from 1980 until 1997, and continued to grow until 2008.[70]
1997 to 2008
In May 1997, Labour, led by Tony Blair, won the general election by a landslide after 18 years of Conservative government,[71] and inherited a strong economy with low inflation,[72] falling unemployment,[73] and a current account surplus.[74] Four days after the election, Gordon Brown, the new Chancellor of the Exchequer, gave the Bank of England the freedom to control monetary policy, which until then had been directed by the government.[75] During Blair's 10 years in office there were 40 successive quarters of economic growth, lasting until the second quarter of 2008. GDP growth, which had briefly reached 4% per year in the early 1990s, gently declining thereafter, was relatively anaemic compared to prior decades, such as the 6.5% per year peak in the early 1970s, although growth was smoother and more consistent.[65] Annual growth rates averaged 2.68% between 1992 and 2007,[64] with the finance sector accounting for a greater part than previously. The period saw one of the highest GDP growth rates of any developed economy and the strongest of any European nation.[76] At the same time, household debt rose from £420 billion in 1994 to £1 trillion in 2004 and £1.46 trillion in 2008 – more than the entire GDP of the UK.[77]
This extended period of growth ended in Q2 of 2008 when the United Kingdom suddenly entered a recession – its first for nearly two decades – brought about by the global financial crisis. The UK was particularly vulnerable to the crisis because its financial sector was the most highly leveraged of any major economy.[78] Beginning with the collapse of Northern Rock, which was taken into public ownership in February 2008, other banks had to be partly nationalised. The Royal Bank of Scotland Group, at its peak the fifth-largest bank in the world by market capitalisation, was effectively nationalised in October 2008. By mid-2009, HM Treasury had a 70.33% controlling shareholding in RBS, and a 43% shareholding, through UK Financial Investments Limited, in Lloyds Banking Group. The Great Recession, as it came to be known, saw unemployment rise from just over 1.6 million in January 2008 to nearly 2.5 million by October 2009.[79][80]
The UK had been one of the strongest economies in terms of inflation, interest rates and unemployment, all of which remained lower until the 2008–09 recession. In August 2008 the IMF warned that the country's outlook had worsened due to a twin shock: financial turmoil and rising commodity prices.[81] Both developments harmed the UK more than most developed countries, as it obtained revenue from exporting financial services while running deficits in goods and commodities, including food. In 2007, the UK had the world's third largest current account deficit, due mainly to a large deficit in manufactured goods. In May 2008, the IMF advised the UK government to broaden the scope of fiscal policy to promote external balance.[82] The UK's output per hour worked was on a par with the average for the "old" EU-15 countries.[83]
2009 to present
In March 2009, the Bank of England (BoE) cut interest rates to a historic low of 0.5% and began quantitative easing (QE) to boost lending and shore up the economy.[84] The UK exited the Great Recession in Q4 of 2009 having experienced six consecutive quarters of negative growth, shrinking by 6.03% from peak to trough, making it the longest recession since records began and the deepest recession since World War II.[69][85] Support for Labour slumped during the recession, and the general election of 2010 resulted in a coalition government being formed by the Conservatives and the Liberal Democrats, which made deep spending cuts to ease the budget deficit.
In 2011, household, financial, and business debts stood at 420% of GDP in the UK, compared to 279% in Japan, 253% in France, 209% in the United States, 206% in Canada, and 198% in Germany.[86] As the world's most indebted country, spending and investment in the UK were held back after the recession, creating economic malaise. However, it was recognised that government borrowing, which rose from 52% to 76% of GDP, helped to avoid a 1930s-style depression.[87] Within three years of the general election, government cuts had led to public sector job losses well into six figures, but the private sector enjoyed strong jobs growth.
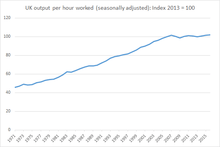
The 10 years following the Great Recession were characterised by extremes. In 2015, employment was at its highest since records began,[88] and GDP growth had become the fastest in the Group of Seven (G7) and Europe,[89] but workforce productivity was the worst since the 1820s, with any growth attributed to a fall in working hours.[90] Output per hour worked was 18% below the average for the rest of the G7.[91] Real wage growth was the worst since the 1860s, and the Governor of the Bank of England described it as a lost decade.[92] Wages fell by 10% in real terms in the eight years to 2016, whilst they grew across the OECD by an average of 6.7%.[93] For 2015 as a whole,[94] the current account deficit rose to a record high of 5.2% of GDP (£96.2bn),[95] the highest in the developed world.[96] In Q4 2015, it exceeded 7%, a level not witnessed during peacetime since records began in 1772.[97] The UK relied on foreign investors to plug the shortfall in its balance of payments.[98] Homes had become less affordable, a problem exacerbated by QE, which kept house prices 22% higher than they would otherwise have been, and equities 25% higher, according to the BoE's own analysis.[99]
A rise in unsecured household debt added to questions over the sustainability of the economic recovery in 2016.[100][101][102][103] The BoE insisted there was no cause for alarm,[104] despite having said two years earlier that the recovery was "neither balanced nor sustainable".[105] It was still very unbalanced,[106] with consumption accounting for 100% of growth in that year.[107] Households ran an unprecedented deficit of 3% of GDP.[97] Unemployment continued to fall, resulting in a 42-year low of 4.4% in June 2017, but real earnings also fell.[108] Following the UK's decision to leave the European Union, the BoE cut interest rates to a new historic low of 0.25% for just over a year to bolster confidence in the economy. It also bought government and corporate bonds, taking the amount of QE since the start of the Great Recession to £435bn.[109]
Government spending and economic management
Government involvement in the economy is primarily exercised by HM Treasury, headed by the Chancellor of the Exchequer. In recent years, the UK economy has been managed in accordance with principles of market liberalisation and low taxation and regulation. Since 1997, the Bank of England's Monetary Policy Committee, headed by the Governor of the Bank of England, has been responsible for setting interest rates at the level necessary to achieve the overall inflation target for the economy that is set by the Chancellor each year.[110] The Scottish Government, subject to the approval of the Scottish Parliament, has the power to vary the basic rate of income tax payable in Scotland by plus or minus 3 pence in the pound, though this power has not yet been exercised.
In the 20-year period from 1986/87 to 2006/07 government spending in the UK averaged around 40% of GDP.[111] In July 2007, the UK had government debt at 35.5% of GDP.[112] As a result of the 2007–2010 financial crisis and the late-2000s global recession, government spending increased to a historically high level of 48% of GDP in 2009–10, partly as a result of the cost of a series of bank bailouts.[111][112] In terms of net government debt as a percentage of GDP, at the end of June 2014 public sector net debt excluding financial sector interventions was £1304.6 billion, equivalent to 77.3% of GDP.[113] For the financial year of 2013–2014 public sector net borrowing was £93.7 billion.[113] This was £13.0 billion higher than in the financial year of 2012–2013.
Taxation
Taxation in the United Kingdom may involve payments to at least two different levels of government: local government and central government (HM Revenue & Customs). Local government is financed by grants from central government funds, business rates, council tax, and, increasingly, fees and charges such as those from on-street parking. Central government revenues are mainly from income tax, national insurance contributions, value added tax, corporation tax and fuel duty.
Sectors
Agriculture

Agriculture in the UK is intensive, highly mechanised, and efficient by European standards, producing about 60% of food needs,[114] with less than 1.6% of the labour force (535,000 workers).[114] It contributes around 0.6% of British national value added.[114] Around two-thirds of the production is devoted to livestock, one-third to arable crops.[114] Agriculture is subsidised by the European Union's Common Agricultural Policy.
The UK retains a significant, though reduced, fishing industry. Its fleets, based in towns such as Kingston upon Hull, Grimsby, Fleetwood, Newlyn, Great Yarmouth, Peterhead, Fraserburgh, and Lowestoft, bring home fish ranging from sole to herring.
The Blue Book 2013 reports that "Agriculture" added gross value of £9,438 million to the UK economy in 2011.[115]
Construction
The construction industry of the United Kingdom contributed gross value of £86 billion to the UK economy in 2011.[115] The industry employed around 2.2 million people in the fourth quarter of 2009.[116] There were around 194,000 construction firms in the United Kingdom in 2009, of which around 75,400 employed just one person and 62 employed over 1,200 people.[116] In 2009 the construction industry in the UK received total orders of around £18.7 billion from the private sector and £15.1 billion from the public sector.[116]
The largest construction project in the UK is Crossrail. Due to open in 2018, it will be a new railway line running east to west through London and into the surrounding countryside with a branch to Heathrow Airport.[117] The main feature of the project is construction of 42 km (26 mi) of new tunnels connecting stations in central London. It is also Europe's biggest construction project with a £15 billion projected cost.[118][119]
Prospective construction projects include the High Speed 2 line between London and the West Midlands and Crossrail 2.
Production industries
Electricity, gas and water supply
The Blue Book 2013 reports that this sector added gross value of £33,289 million to the UK economy in 2011.[115] The United Kingdom is expected to launch the building of new nuclear reactors to replace existing generators and to boost UK's energy reserves.[120]
Manufacturing
In the 1970s, manufacturing accounted for 25 percent of the economy. Total employment in manufacturing fell from 7.1 million in 1979 to 4.5 million in 1992 and only 2.7 million in 2016, when it accounted for 10% of the economy.[121][122][123]
In 2011 the UK manufacturing sector generated approximately £140,539 million in gross value added and employed around 2.6 million people.[115][124] Of the approximately £16 billion invested in R&D by UK businesses in 2008, approximately £12 billion was by manufacturing businesses.[124] In 2008, the UK was the sixth-largest manufacturer in the world measured by value of output.[125]
In 2008 around 180,000 people in the UK were directly employed in the UK automotive manufacturing sector.[126] In that year the sector had a turnover of £52.5 billion, generated £26.6 billion of exports and produced around 1.45 million passenger vehicles and 203,000 commercial vehicles.[126] The UK is a major centre for engine manufacturing, and in 2008 around 3.16 million engines were produced in the country.[126]
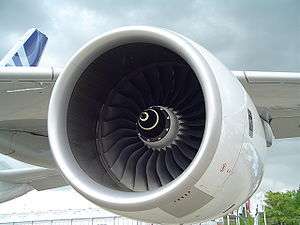
The aerospace industry of the UK is the second- or third-largest aerospace industry in the world, depending upon the method of measurement.[127][128] The industry employs around 113,000 people directly and around 276,000 indirectly and has an annual turnover of around £20 billion.[129][130] British companies with a major presence in the industry include BAE Systems (the world's second-largest defence contractor)[131] and Rolls-Royce (the world's second-largest aircraft engine maker).[132] Foreign aerospace companies active in the UK include EADS and its Airbus subsidiary, which employs over 13,000 people in the UK.[133]
The pharmaceutical industry employs around 67,000 people in the UK and in 2007 contributed £8.4 billion to the UK's GDP and invested a total of £3.9 billion in research and development.[134][135] In 2007 exports of pharmaceutical products from the UK totalled £14.6 billion, creating a trade surplus in pharmaceutical products of £4.3 billion.[136] The UK is home to GlaxoSmithKline and AstraZeneca, respectively the world's third- and seventh-largest pharmaceutical companies.[137][138]
Mining, quarrying and hydrocarbons
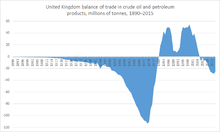
The Blue Book 2013 reports that this sector added gross value of £31,380 million to the UK economy in 2011.[115] In 2007 the UK had a total energy output of 9.5 quadrillion Btus (10 exajoules), of which the composition was oil (38%), natural gas (36%), coal (13%), nuclear (11%) and other renewables (2%).[139] In 2009, the UK produced 1.5 million barrels per day (bbl/d) of oil and consumed 1.7 million bbl/d.[140] Production is now in decline and the UK has been a net importer of oil since 2005.[140] As of 2010 the UK has around 3.1 billion barrels of proven crude oil reserves, the largest of any EU member state.[140]
In 2009 the UK was the 13th largest producer of natural gas in the world and the largest producer in the EU.[141] Production is now in decline and the UK has been a net importer of natural gas since 2004.[141] In 2009 the UK produced 19.7 million tons of coal and consumed 60.2 million tons.[139] In 2005 it had proven recoverable coal reserves of 171 million tons.[139] It has been estimated that identified onshore areas have the potential to produce between 7 billion tonnes and 16 billion tonnes of coal through underground coal gasification (UCG).[142] Based on current UK coal consumption, these volumes represent reserves that could last the UK between 200 and 400 years.[143]
The UK is home to a number of large energy companies, including two of the six oil and gas "supermajors" – BP and Royal Dutch Shell.[144][145]
The UK is also rich in a number of natural resources including coal, tin, limestone, iron ore, salt, clay, chalk, gypsum, lead and silica.
Service industries
The service sector is the dominant sector of the UK economy, and contributes around 80.2% of GDP as of 2016.
Creative industries
The creative industries accounted for 7% of gross value added (GVA) in 2005 and grew at an average of 6% per annum between 1997 and 2005.[146] Key areas include London and the North West of England, which are the two largest creative industry clusters in Europe.[147] According to the British Fashion Council, the fashion industry’s contribution to the UK economy in 2014 is ₤26 billion, up from ₤21 billion pounds in 2009.[148] The UK is home to the world's largest advertising company, WPP.
Education, health and social work

According to The Blue Book 2013 the education sector added gross value of £84,556 million in 2011 whilst human health and social work activities added £104,026 million in 2011.[115]
In the UK the majority of the healthcare sector consists of the state funded and operated National Health Service (NHS), which accounts for over 80% of all healthcare spending in the UK and has a workforce of around 1.7 million, making it the largest employer in Europe, and putting it amongst the largest employers in the world.[149][150][151] The NHS operates independently in each of the four constituent countries of the UK. The NHS in England is by far the largest of the four parts and had a turnover of £92.5 billion in 2008.[152]
In 2007/08 higher education institutions in the UK had a total income of £23 billion and employed a total of 169,995 staff.[153] In 2007/08 there were 2,306,000 higher education students in the UK (1,922,180 in England, 210,180 in Scotland, 125,540 in Wales and 48,200 in Northern Ireland).[153]
Financial and business services
The UK financial services industry added gross value of £116,363 million to the UK economy in 2011.[115] The UK's exports of financial and business services make a significant positive contribution towards the country's balance of payments.
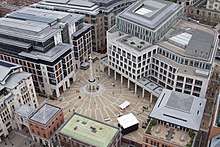
London is a major centre for international business and commerce and is one of the three "command centres" of the global economy (alongside New York City and Tokyo).[33][154] There are over 500 banks with offices in London, and it is the leading international centre for banking, insurance, Eurobonds, foreign exchange trading and energy futures. London's financial services industry is primarily based in the City of London and Canary Wharf. The City houses the London Stock Exchange, the London International Financial Futures and Options Exchange, the London Metal Exchange, Lloyds of London, and the Bank of England. Canary Wharf began development in the 1980s and is now home to major financial institutions such as Barclays Bank, Citigroup and HSBC, as well as the UK Financial Services Authority.[155][156] London is also a major centre for other business and professional services, and four of the six largest law firms in the world are headquartered there.[157]
Several other major UK cities have large financial sectors and related services. Edinburgh has one of the largest financial centres in Europe[158] and is home to the headquarters of the Royal Bank of Scotland Group and Standard Life. Leeds is now the UK's largest centre for business and financial services outside London,[159][160][161] and the largest centre for legal services in the UK after London.[162][163][164]
According to a series of research papers and reports published in the mid-2010s, Britain’s financial firms provide sophisticated methods to launder billions of pounds annually, including money from the proceeds of corruption around the world as well as the world’s drug trade, thus making the City a global hub for illicit finance.[165][166][167][168] According to a Deutsche Bank study published in March 2015, Britain was attracting circa one billion pounds of capital inflows a month not recorded by official statistics, up to 40 percent probably originating from Russia, which implies misreporting by financial institutions, sophisticated tax avoidance, and the UK's "safe-haven" reputation.[169]
Hotels and restaurants
The Blue Book 2013 reports that this industry added gross value of £36,554 million to the UK economy in 2011.[115] Intercontinental Hotels Group (IHG), headquartered in Denham, Buckinghamshire, is currently the world's largest hotelier, owning and operating hotel brands such as Intercontinental, Holiday Inn and Crowne Plaza. The international arm of Hilton Hotels, the world's fifth largest hotelier, used to be owned by Ladbrokes Plc, and was headquartered in Watford, Hertfordshire from 1987 to 2005. It was sold to Hilton Hotels Group of the USA in December 2005..
Informal
A study in 2014 found that prostitution and associated services added over £5 billion to the economy each year.[170]
Public administration and defence
The Blue Book 2013 reports that this sector added gross value of £70,400 million to the UK economy in 2011.[115]
Real estate and renting activities
The real estate and renting activities sector includes the letting of dwellings and other related business support activities. The Blue Book 2013 reports that real estate industry added gross value of £143,641 million in 2011.[115] Notable real estate companies in the United Kingdom include British Land, Land Securities, and The Peel Group.
The UK property market boomed for the seven years up to 2008, and in some areas property trebled in value over that period. The increase in property prices had a number of causes: low interest rates, credit growth, economic growth, rapid growth in buy-to-let property investment, foreign property investment in London and planning restrictions on the supply of new housing. In England and Wales between 1997 and 2016, average house prices increased by 259%, while earnings increased by 68%. An average home cost 3.6 times annual earnings in 1997 compared to 7.6 in 2016.[172]
Rent has nearly doubled as a share of GDP since 1985, and is now larger than the manufacturing sector. In 2014, rent and imputed rent – an estimate of how much home-owners would pay if they rented their home – accounted for 12.3% of GDP.[173]
Tourism
Tourism is very important to the British economy. With over 32.6 million tourists arriving in 2014, the United Kingdom is ranked as the eighth major tourist destination in the world.[174] London is the second most visited city in the world with 17.4 million visitors in 2014, behind first-placed Hong Kong (27.8 million visitors).[175]
Transport, storage and communication
The transport and storage industry added gross value of £59,179 million to the UK economy in 2011 and the telecommunication industry added a gross value of £25,098 million in the same year.[115]
The UK has a radial road network of 46,904 kilometres (29,145 mi) of main roads, with a motorway network of 3,497 kilometres (2,173 mi). There are a further 213,750 kilometres (132,818 mi) of paved roads. The railway infrastructure company Network Rail owns and operates the majority of the 16,116 km (10,014 mi) railway lines in Great Britain and a further 303 route km (189 route mi) in Northern Ireland is owned and operated by Northern Ireland Railways. Since privatisation, around 20 Train Operating Companies operate the passenger trains. Urban rail networks are well developed in major cities including Glasgow, Liverpool and London. The government is to spend £30 billion on a new high-speed railway line, HS2, to be operational by 2026.[177] Crossrail, due to open in December 2018 in London, is Europe's largest construction project with a £15 billion projected cost.[178][179]
The Highways Agency is the executive agency responsible for trunk roads and motorways in England apart from the privately owned and operated M6 Toll.[180] The Department for Transport states that traffic congestion is one of the most serious transport problems and that it could cost England an extra £22 billion in wasted time by 2025 if left unchecked.[181] According to the government-sponsored Eddington report of 2006, congestion is in danger of harming the economy, unless tackled by road pricing and expansion of the transport network.[182][183]
In the year from October 2009 to September 2010 UK airports handled a total of 211.4 million passengers.[184] In that period the three largest airports were London Heathrow Airport (65.6 million passengers), Gatwick Airport (31.5 million passengers) and London Stansted Airport (18.9 million passengers).[184] London Heathrow Airport, located 24 kilometres (15 mi) west of the capital, has the most international passenger traffic of any airport in the world.[185][186] and is the hub for the UK flag carrier British Airways, as well as BMI and Virgin Atlantic.[187] London's six commercial airports form the world's largest city airport system measured by passenger traffic.[188]
Wholesale and retail trade
This sector includes the motor trade, auto repairs, personal and household goods industries. The Blue Book 2013 reports that this sector added gross value of £151,785 million to the UK economy in 2011.[115]
As of 2016, high-street retail spending accounted for about 33% of consumer spending and 20% of GDP. Because 75% of goods bought in the United Kingdom are made overseas, the sector only accounts for 5.7% of gross value added to the British economy.[189]
The UK grocery market is dominated by four companies: Asda (owned by Wal-Mart Stores), Morrisons, Sainsbury's and Tesco.[190]
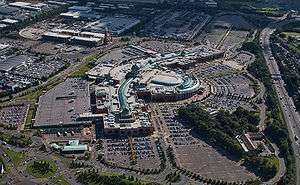
London is a major retail centre and in 2010 had the highest non-food retail sales of any city in the world, with a total spend of around £64.2 billion.[191] The UK-based Tesco is the third-largest retailer in the world measured by revenues (after Wal-Mart Stores and Carrefour) and as of 2011 was the leader in the UK market with around a 30% share.[192]
Currency
London is the world capital for foreign exchange trading, with a global market share of nearly 41% in 2013 of the daily $5.3 trillion global turnover. The highest daily volume, counted in trillions of dollars US, is reached when New York enters the trade.
The currency of the UK is the pound sterling, represented by the symbol "£'. The Bank of England is the central bank, responsible for issuing currency. Banks in Scotland and Northern Ireland retain the right to issue their own notes, subject to retaining enough Bank of England notes in reserve to cover the issue. The pound sterling is also used as a reserve currency by other governments and institutions, and is the third-largest after the US dollar and the euro.[193]
The UK chose not to join the euro at the currency's launch. The government of former Prime Minister Tony Blair had pledged to hold a public referendum to decide on membership should "five economic tests" be met. Until relatively recently there was debate over whether or not the UK should abolish its currency and adopt the euro. In 2007 the Prime Minister, Gordon Brown, pledged to hold a public referendum based on certain tests he set as Chancellor of the Exchequer. When assessing the tests, Gordon Brown concluded that while the decision was close, the United Kingdom should not yet join the euro. He ruled out membership for the foreseeable future, saying that the decision not to join had been right for the UK and for Europe.[194] In particular, he cited fluctuations in house prices as a barrier to immediate entry. Public opinion polls have shown that a majority of Britons have been opposed to joining the single currency for some considerable time, and this position has hardened further in the last few years.[195] In 2005, more than half (55%) of the UK were against adopting the currency, while 30% were in favour.[196] The possibility of joining the euro has become a non-issue since the referendum decision to withdraw from the European Union.
Exchange rates
Average for each year, in USD (US dollar) and EUR (euro) per GBP; and inversely: GBP per USD and EUR. (Synthetic Euro XEU before 1999). These averages conceal wide intra-year spreads. The coefficient of variation gives an indication of this. It also shows the extent to which the pound tracks the euro or the dollar. Note the effect of Black Wednesday in late 1992 by comparing the averages for 1992 and for 1993.
|
|
- For consistency and comparison purposes, coefficient of variation is measured on both the "per pound" ratios, although it is conventional to show the forex rates as dollars per pound and pounds per euro.
Economy by region
.svg.png)
The strength of the UK economy varies from country to country and from region to region. Excluding the effects of North Sea oil and gas (which is classified in official statistics as extra-regio), England has the highest gross value added (GVA) and Wales the lowest of the UK's constituent countries.
| Rank | Country | GDP per capita, 2015[199] |
|---|---|---|
| 1 | England | £26,160/ $40,000 |
| 2 | Scotland | £23,685/ $36,200 |
| 3 | Northern Ireland | £18,584/ $28,400 |
| 4 | Wales | £18,002/ $27,500 |
Within England, GVA per capita is highest in London. The following table shows the GVA per capita of the nine statistical regions of England.
| Rank | Region | GVA per capita, 2013[199] |
|---|---|---|
| 1 | Greater London | £40,215 |
| 2 | South East England | £25,843 |
| 3 | East of England | £21,897 |
| 4 | South West England | £21,163 |
| 5 | North West England | £19,937 |
| 6 | West Midlands | £19,428 |
| 7 | East Midlands | £19,317 |
| 8 | Yorkshire and the Humber | £19,053 |
| 9 | North East England | £17,381 |
Two of the richest 10 areas in the European Union are in the United Kingdom. Inner London is number 1 with a GDP per capita of €65 138, and Berkshire, Buckinghamshire and Oxfordshire is number 7 with a GDP per capita of €37 379.[200] Edinburgh is also one of the largest financial centres in Europe.[201]
At the other end of the scale, Cornwall has the lowest GVA per head of any county or unitary authority in England,[202] and it has received EU Convergence funding (formerly Objective One funding) since 2000.[203]
Trade
.png)
The total UK trade (goods and services) deficit widened by £3.4 billion to £8.7 billion in the three months to January 2018; excluding erratic commodities, the deficit widened by £2.6 billion to £8.9 billion.
The £3.4 billion widening of the total trade (goods and services) deficit was due to a £3.2 billion widening of the trade in goods deficit and a £0.2 billion narrowing of the trade in services surplus.
The widening of the trade in goods deficit was due mainly to a £1.3 billion increase in imports (particularly fuels) from non-EU countries, combined with a £1.2 billion decrease in exports (including fuels) to non-EU countries, in the three months to January 2018.
Large decreases in fuels export volumes combined with increases in fuels import prices had the largest impact on the widening of the trade in goods deficit in the three months to January 2018.
Between December 2017 and January 2018, the UK total trade (goods and services) deficit widened by £0.6 billion, due primarily to an increase in goods imports including aircraft and cars from non-EU countries and fuels (refined oil) from EU countries.
Comparing the three months to January 2018 with the same period in 2017, the UK total trade (goods and services) deficit widened by £0.4 billion; due primarily to increases of £5.7 billion and £3.1 billion in goods (particularly fuels) and services imports respectively.
Revisions to the total trade (goods and services) balance are mainly upward from January 2017 to December 2017, due mostly to upward revisions to services exports combined with downward revisions to goods imports.
Investment
In 2013 the UK was the leading country in Europe for inward foreign direct investment (FDI) with $26.51bn. This gave it a 19.31% market share in Europe. In contrast, the UK was second in Europe for outward FDI, with $42.59bn, giving a 17.24% share of the European market.[204]
In October 2017, the ONS revised the UK's balance of payments, changing the net international investment position from a surplus of £469bn to a deficit of £22bn. Deeper analysis of outward investment revealed that much of what was thought to be foreign debt securities owned by British companies were actually loans to British citizens. Inward investment also dropped, from a surplus of £120bn in the first half of 2016 to a deficit of £25bn in the same period of 2017. The UK had been relying on a surplus of inward investment to make up for its long-term current account deficit.[205]
Mergers and acquisitions
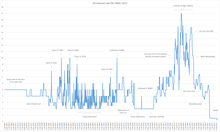
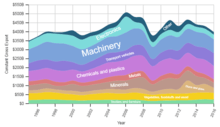
Since 1985 103,430 deals with UK participation have been announced. There have been three major waves of increased M&A activity (2000, 2007 and 2017; see graph "M&A in th UK"). 1999 however, was the year with the highest cumulated value of deals (490. bil GBP, which is about 50% more than the current peak of 2017). The Finance industry and Energy & Power made up most of the value from 2000 until 2018 (both about 15%).
Here is a list of the top 10 deals including UK companies.[206] The Vodafone - Mannesmann deal is still the biggest deal in global history.
| Rank | Date | Acquirer | Acquirer nation | Target | Target nation | Value (£billions) |
|---|---|---|---|---|---|---|
| 1 | 14 November 1999 | Vodafone AirTouch PLC | United Kingdom | Mannesmann AG | Germany | 126.95 |
| 2 | 16 September 2015 | Anheuser-Busch Inbev SA/NV | Belgium | SABMiller PLC | United Kingdom | 77.24 |
| 3 | 4 August 2015 | Royal Dutch Shell PLC | Netherlands | BG Group PLC | United Kingdom | 46.70 |
| 4 | 17 January 2000 | Glaxo Wellcome PLC | United Kingdom | SmithKline Beecham PLC | United Kingdom | 46.48 |
| 5 | 28 October 2004 | Royal Dutch Petroleum Co | Netherlands | Shell Transport & Trading Co | United Kingdom | 40.75 |
| 6 | 21 October 2016 | British American Tobacco PLC | United Kingdom | Reynolds American Inc | United States | 40.10 |
| 7 | 15 January 1999 | Vodafone Group PLC | United Kingdom | AirTouch Communications Inc | United States | 36.35 |
| 8 | 30 May 2000 | France Telecom SA | France | Orange PLC | United Kingdom | 31.14 |
| 9 | 8 November 1998 | British Petroleum Co PLC | United Kingdom | Amoco Corp | United States | 29.51 |
| 10 | 31 October 2016 | GE Oil & Gas | United Kingdom | Baker Hughes Inc | United States | 26.63 |
| 11 | 26 February 2009 | HM Treasury | United Kingdom | Royal Bank of Scotland Group | United Kingdom | 25.50 |
- In most cases both the acquiring and target companies have/had shareholders spread throughout the world, not only in the stated countries.
European Union membership
As a member of the European Union, the UK has negotiated and agreed to numerous EU-wide trade and market policies. According to the 2014 report within the "Balance of EU competences" review, the majority of the EU trade policies have been beneficial for the UK, despite the proportion of the country's exports going to the EU falling from 54 percent to 47 percent over the past decade. The total value of exports however has increased in the same period from £130 billion (€160 billion) to £240 billion (€275 billion).[207][208]
In June 2016 the UK voted to leave the EU in a national referendum on its membership of the EU. After the activation of Article 50 of the Lisbon Treaty, the UK is set to leave the EU on Friday 29 March 2019. The future relationship between the UK and EU is under negotiation, although there are still attempts to prevent the UK's departure from the European Economic Area.
Poverty
The United Kingdom is a developed country with social welfare infrastructure, thus discussions surrounding poverty tend to use a relatively high minimum income compared to developing countries. According to the OECD, the UK is in the lower half of developed country rankings for poverty rates, doing better than Italy and the US but less well than France, Austria, Hungary, Slovakia and the Nordic countries.[209] Eurostat figures show that the numbers of Britons at risk of poverty has fallen to 15.9% in 2014, down from 17.1% in 2010 and 19% in 2005 (after social transfers were taken into account).[210] Poverty is countered in United Kingdom with the welfare state. There have been protests over the recent welfare changes of introducing Universal Credit. The aim of the government was to simplify the welfare state. People have protested sanctioning of people on Universal Credit, as well as disabled people protesting changes.
The poverty line in the UK is commonly defined as being 60% of the median household income. In 2007–2008, this was calculated to be £115 per week for single adults with no dependent children; £199 per week for couples with no dependent children; £195 per week for single adults with two dependent children under 14; and £279 per week for couples with two dependent children under 14. In 2007–2008, 13.5 million people, or 22% of the population, lived below this line. This is a higher level of relative poverty than all but four other EU members.[211] In the same year, 4.0 million children, 31% of the total, lived in households below the poverty line, after housing costs were taken into account. This is a decrease of 400,000 children since 1998–1999.[212]
Data
This table shows the main economic indicators in 1980–2017.[213] The inflation rate used is the Consumer Price Index. See the government spending and economic management section for historical interest rates.
| Year | GDP (in Bil. US$ PPP) |
GDP per capita (in US$ PPP) |
GDP growth (real) |
Inflation rate (in Percent) |
Unemployment (in Percent) |
Government debt (in % of GDP) |
|---|---|---|---|---|---|---|
| 1980 | 500.1 | 8,879 | 7.1 % | 42.5 % | ||
| 1981 | ||||||
| 1982 | ||||||
| 1983 | ||||||
| 1984 | ||||||
| 1985 | ||||||
| 1986 | ||||||
| 1987 | ||||||
| 1988 | ||||||
| 1989 | ||||||
| 1990 | ||||||
| 1991 | ||||||
| 1992 | ||||||
| 1993 | ||||||
| 1994 | ||||||
| 1995 | ||||||
| 1996 | ||||||
| 1997 | ||||||
| 1998 | ||||||
| 1999 | ||||||
| 2000 | ||||||
| 2001 | ||||||
| 2002 | ||||||
| 2003 | ||||||
| 2004 | ||||||
| 2005 | ||||||
| 2006 | ||||||
| 2007 | ||||||
| 2008 | ||||||
| 2009 | ||||||
| 2010 | ||||||
| 2011 | ||||||
| 2012 | ||||||
| 2013 | ||||||
| 2014 | ||||||
| 2015 | ||||||
| 2016 | ||||||
| 2017 |
Notes
References
- 1 2 3 4 "Report for Selected Countries and Subjects – United Kingdom". International Monetary Fund. October 2018.
- ↑ "GDP Preliminary estimate Q3 2017". ONS. Office for National Statistics. 28 January 2017.
- ↑ "The World Factbook- United Kingdom". Central Intelligence Agency. Retrieved 13 May 2018.
- ↑ "Inflation and Price Indices". 13 June 2017. Retrieved 14 June 2017.
- ↑ "Population Below Poverty Line – CIA World Factbook". The World Factbook.
- ↑ Jonathan Cribb. "Living standards, poverty and inequality in the UK: 2012" (PDF). Institute for Fiscal Studies. Retrieved 4 June 2013.
- 1 2 Office for National Statistics (17 August 2016). "UK Labour Market: August 2016". Office for National Statistics. Retrieved 17 August 2016.
- ↑ Office for National Statistics. "Labour Force Survey Employment status by occupation, April – June 2011". Office for National Statistics. Retrieved 14 July 2013.
- ↑ "Earnings and working hours: United Kingdom". Office of National Statistics. 26 October 2017.
- ↑ "Ease of Doing Business in United Kingdom". Doingbusiness.org. Retrieved 23 November 2017.
- ↑ "Country Comparison to the World: Exports". The World Factbook. CIA. Retrieved 10 July 2016.
- 1 2 Statistics on UK-EU trade
- ↑ "Export Partners of United Kingdom". The World Factbook. CIA. 2015. Retrieved 10 July 2016.
- ↑ "Country Comparison to the World: Imports". The World Factbook. CIA. Retrieved 10 July 2016.
- ↑ "Import Partners of United Kingdom". CIA World Factbook. 2015. Retrieved 10 July 2016.
- ↑ "Country Fact Sheets 2016". unctad.org. Retrieved 5 July 2017.
- ↑ Allen, Katie (31 March 2016). "Current account deficit hits record high as GDP revised higher". Retrieved 4 August 2016 – via The Guardian.
- ↑ "Office for National Statistics". ONS. Retrieved 9 July 2017.
- ↑ Office for National Statistics. "Public sector finances: Jan 2017". Office for National Statistics. Retrieved 23 February 2017.
- 1 2 "Budget 2016" (PDF). HM Treasury. March 2016. Retrieved 19 June 2017.
- ↑ "Development aid rises again in 2016 but flows to poorest countries dip". OECD. 11 April 2017. Retrieved 25 September 2017.
- ↑ "Sovereigns rating list". Standard & Poor's. Retrieved 26 May 2011.
- ↑ "Moody's downgrades UK's rating to Aa2, changes outlook to stable". Moody's. 22 September 2017. Retrieved 16 November 2017.
- ↑ "Fitch - Complete Sovereign Rating History". Retrieved 25 February 2013.
- ↑ http://www.imf.org/external/np/sta/ir/IRProcessWeb/data/gbr/eng/curgbr.pdf
- 1 2 Nigel Hawkins (1 November 2010). "Privatization Revisited" (PDF). Retrieved 25 September 2014.
- 1 2 Alan Griffiths & Stuart Wall (16 July 2011). "Applied Economics" (PDF). Archived from the original (PDF) on 20 June 2013. Retrieved 25 September 2014.
- ↑ "Global Economy Watch - Projections > Real GDP / Inflation > Share of 2016 world GDP". PWC. Retrieved 23 June 2017.
- ↑ "Country Comparison: Stock of direct foreign investment – at home". CIA. Retrieved 14 August 2013.
- ↑ "Country Comparison: Stock of direct foreign investment – abroad". CIA. Retrieved 9 May 2011.
- ↑ "KOF Globalization Index". Globalization.kof.ethz.ch. Retrieved 5 September 2012.
- ↑ Lorna Booth (9 June 2017). "Components of GDP: Key Economic Indicators". UK Parliament. House of Commons Library. Retrieved 25 June 2017.
- 1 2 "The Global Financial Centres Index 21" (PDF). March 2017. Archived from the original (PDF) on 2017-06-11. Retrieved 18 June 2017.
- ↑ Laura Wipfer (12 June 2017). "Facts and Figures 2017". ADS Group. Retrieved 25 June 2017.
- ↑ Angela Monaghan (22 April 2014). "Pharmaceutical industry drives British research and innovation". The Guardian. Retrieved 25 June 2017.
- ↑ "The Fortune 2016 Global 500". Fortune. Retrieved 18 October 2016. Number of companies data taken from the "Country" box for Britain and Britain/Netherlands.
- ↑ "CRUDE OIL - PROVED RESERVES". The World Factbook. CIA. Retrieved 25 June 2017.
- ↑ Department for Business, Energy & Industrial Strategy (25 August 2016). "Crude oil and petroleum: production, imports and exports 1890 to 2015". Gov.uk. Retrieved 18 October 2016.
- ↑ "World Urbanization Prospects: The 2007 Revision Population Database". The United Nations. Archived from the original on 1 August 2009. Retrieved 21 November 2009.
- ↑ Perry, Marvin; Jacob, Margaret C.; Chase, Myrna; Jacob, James R. (2009). Western Civilization: Ideas, Politics, and Society (9th ed.). Boston: Houghton Mifflin Harcourt. p. 503. ISBN 0-547-14701-5.
- ↑ "Productivity Growth In The Industrial Revolution" (PDF). Retrieved 8 February 2014.
- ↑ "Archived copy" (PDF). Archived from the original (PDF) on 14 May 2013. Retrieved 26 December 2012.
- ↑ Ferguson, Niall (2004). Empire, The rise and demise of the British world order and the lessons for global power. Basic Books. ISBN 0-465-02328-2.
- ↑ Angus Maddison (2006). The World Economy. Development Centre of the Organisation for Economic Co-operation and Development. p. 263. ISBN 978-92-64-02261-4.
- ↑ "UofT G8 Information Centre: What is the G8?". G7.utoronto.ca. 6 February 2012. Retrieved 5 September 2012.
- ↑ G-20 Membership from the official G-20 website Archived 20 November 2013 at the Wayback Machine.
- ↑ CIA World Factbook (est. 2011): https://www.cia.gov/library/publications/the-world-factbook/fields/2012.html#uk, which also roughly correspond to figures given by Eurostat (est. 2010): "Archived copy". Archived from the original on 14 August 2012. Retrieved 22 February 2012. (i.e. combination of "Industry, including energy" and "construction")
- ↑ Charles Levy, Andrew Sissons and Charlotte Holloway (28 June 2011). "A plan for growth in the knowledge economy" (PDF). The Work Foundation. Archived from the original (PDF) on 2 June 2013. Retrieved 25 September 2014.
- ↑ "A Regional Perspective on the Knowledge Economy in Great Britain" (PDF). Archived from the original (PDF) on 21 September 2013. Retrieved 8 February 2014.
- ↑ Bolshaw, Liz (29 February 2012). "The future of work is the knowledge economy". FT.com. Retrieved 1 February 2013.
- ↑ "A survey of the liberalisation of public enterprises in the UK since 1979" (PDF). Retrieved 8 February 2014.
- ↑ "Acknowledgements" (PDF). Retrieved 8 February 2014.
- ↑ Nigel Hawkins (4 April 2008). "Privatization – Reviving the Momentum" (PDF). Adam Smith Institute, London. Archived from the original (PDF) on 1 June 2013. Retrieved 25 September 2014.
- ↑ Graeme Hodge (28 October 2011). "Revisiting State and Market through Regulatory Governance: Observations of Privatisation, Partnerships, Politics and Performance" (PDF). Retrieved 25 September 2014.
- ↑ "Global currency reserves".
- ↑ David Parker (2009). The Official History of Privatisation: The Formative Years 1970–1987. 1. Routledge. p. 7. ISBN 978-1-134-03140-5.
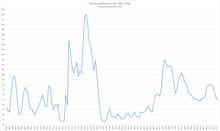
- ↑ James Denman; Paul McDonald (1996). "Unemployment statistics from 1881 to the present day". Labour Market Trends. The Government Statistical Office. 104 (15–18).
- ↑ J. Christopher R. Dow; Christopher Dow (2000). Major Recessions: Britain and the World, 1920-1995. Oxford University Press. ISBN 978-0-19-924123-1.
- ↑ High, Steven (November 2013). ""The wounds of class": a historiographical reflection on the study of deindustrialization, 1973–2013". History Compass. Wiley. 11 (11): 994–1007. doi:10.1111/hic3.12099.
- ↑ Azar Gat (2008). War in Human Civilization. Oxford University Press. p. 519. ISBN 978-0-19-923663-3.
- ↑ Keith Laybourn (1999). Modern Britain Since 1906: A Reader. I.B.Tauris. p. 230. ISBN 978-1-86064-237-1.
- ↑ Department for Business, Energy & Industrial Strategy (2016). "Historical coal data: coal production, availability and consumption 1853 to 2015".
- ↑ Phillip Inman, "Reports of recovery much exaggerated, says CBI", The Guardian (UK), 15 June 2009, p. 21.
- 1 2 "Edit/Review Countries". Imf.org. 29 April 2003. Archived from the original on 11 June 2010. Retrieved 5 September 2012.
- 1 2 The ONS figures, reproduced by the Local Government Association, "From Recession to recovery", November 2008. Retrieved 13-05-09, p. 7, are slightly lower, giving 4.5% in 1988. Archived 2 November 2011 at the Wayback Machine.
- 1 2 3 4 "How Britain changed under Margaret Thatcher". The Guardian. 8 April 2013. Retrieved 7 April 2016.
- ↑ ONS (5 June 2013). "170 Years of Industrial Change across England and Wales". The National Archives. Archived from the original on 5 January 2016. Retrieved 6 December 2016.
- ↑ "UK Politics | The Basics | past_elections | 1983: Thatcher triumphs again". BBC News. 5 April 2005. Retrieved 5 September 2012.
- 1 2 Larry Elliott (22 December 2009). "UK recession longest and deepest since war, says ONS". The Guardian. Retrieved 9 July 2009.
- ↑ Stephen Machin (6 April 2015). "Real wages and living standards: the latest UK evidence". London School of Economics. Retrieved 31 October 2016.
- ↑ Wheeler, Brian (21 July 2009). "UK | UK Politics | Election countdown – 1990s style". BBC News. Retrieved 5 September 2012.
- ↑ Simon Rogers; Ami Sedghi (12 November 2013). "UK inflation since 1948". The Guardian. Retrieved 2 June 2017.
- ↑ ONS unemployment rate bulletin
- ↑ OECD (16 July 1998). OECD Economic Surveys: United Kingdom 1998. OECD Publishing. p. 20. ISBN 978-92-64-15145-1.
- ↑ "Brown sets Bank of England free". BBC News. 6 May 1997. Retrieved 2 June 2017.
- ↑ Davis, Evan (10 May 2007). "Blair's surprising economic legacy". BBC News. Retrieved 5 September 2012.
- ↑ Mark Horsley (28 March 2015). The Dark Side of Prosperity: Late Capitalism’s Culture of Indebtedness. Ashgate Publishing. p. 31. ISBN 978-1-4724-3657-3.
- ↑ Gabriele Giudice; Robert Kuenzel; Tom Springbett (2012). UK Economy: The Crisis in Perspective. Routledge. p. 205. ISBN 978-1-136-31210-6.
- ↑ "UK unemployment falls by 32,000". BBC News. 19 March 2008. Retrieved 5 September 2012.
- ↑ "Unemployment rise continues to slow". BBC News. 16 December 2009. Retrieved 5 September 2012.
- ↑ "Twin Global Shocks Dent United Kingdom Outlook". Imf.org. 11 August 2008. Retrieved 5 September 2012.
- ↑ "United Kingdom – 2008 Article IV Consultation Concluding Statement of the Mission, 23 May 2008". Imf.org. 23 May 2008. Retrieved 5 September 2012.
- ↑ "Labour productivity per hour worked". epp.eurostat.ec.europa.eu. Archived from the original on 20 May 2012. Retrieved 25 September 2014.
- ↑ "UK interest rates lowered to 0.5%". BBC News. 5 March 2009. Retrieved 2 October 2016.
- ↑ "UK economy shrinks less than thought". BBC News. 25 November 2009.
- ↑ Annette Meyer (2012). Value Added / 14 National Labor Forces. Dorrance Publishing. p. 170. ISBN 978-1-4349-7375-7.
- ↑ Robert Peston (21 November 2011). "UK's debts 'biggest in the world'". BBC News. Retrieved 2 June 2017.
- ↑ Stewart, Heather; Wintour, Patrick (18 February 2015). "'UK employment rate hits highest level since records began'". The Guardian. Retrieved 8 June 2015.
- ↑ Wholehouse, Matthew (24 July 2014). "'UK has fastest-growing economy, International Monetary Fund says'". The Telegraph. London. Retrieved 8 June 2015.
- ↑ Gavin Jackson (5 January 2018). "UK productivity grows at quickest pace in six years". Financial Times. Retrieved 6 January 2018.
- ↑ "UK productivity gap widens to worst level since records began". The Guardian. 18 February 2016. Retrieved 7 April 2016.
- ↑ Chris Giles (6 December 2016). "UK suffering 'first lost decade since 1860s', Carney says". Financial Times. Retrieved 6 December 2016. (subscription required)
- ↑ Katie Allen; Larry Elliott (27 July 2016). "UK joins Greece at bottom of wage growth league". The Guardian. Retrieved 31 October 2016.
- ↑ "UK's current account deficit jumps to 'eye watering' record high". The Telegraph. 31 March 2016. Retrieved 7 April 2016.
- ↑ "UK current account deficit at new high". BBC News. 31 March 2016. Retrieved 7 July 2016.
- ↑ Ed Conway (5 July 2016). "The £22bn current account deficit mystery". Sky News. Retrieved 10 July 2016.
- 1 2 Ambrose Evans-Pritchard (31 March 2016). "Britain courts fate on Brexit with worst external deficit in history". The Telegraph. Retrieved 23 October 2016.
- ↑ Katie Allen (21 March 2016). "Current account deficit hits record high as GDP revised higher". The Guardian. Retrieved 23 October 2016.
- ↑ John Lanchester (9 September 2018). "After the Fall". The Sunday Times Magazine. p. 29.
- ↑ Simon Read (13 January 2016). "Is the UK facing a debt disaster?". Independent. Retrieved 8 July 2016.
- ↑ Heather Stewart (9 December 2015). "Recovery 'too reliant on consumer debt' as BCC downgrades forecast". The Guardian. Retrieved 8 July 2016.
- ↑ Emily Cadman; Chris Giles (3 January 2016). "Economists' forecasts: Fears over balance of recovery". Financial Times. Retrieved 8 July 2016. (subscription required)
- ↑ Rachel Rickard Straus (15 April 2016). "Household debt binge hits pre-crisis levels as Britons go mad for new cars and cheap loans, Bank of England warns". This is Money. Retrieved 8 July 2016.
- ↑ Mehreen Khan (12 January 2016). "Britain's recovery is not driven by debt, says Mark Carney". The Telegraph. Retrieved 8 July 2016.
- ↑ Larry Elliott; Angela Monaghan (12 February 2014). "Interest rates on hold as Bank says recovery 'unsustainable'". The Guardian. Retrieved 8 July 2016.
- ↑ Katie Allen (1 January 2017). "Why the UK economy could fare better in 2017 than forecasters predict". The Guardian. Retrieved 13 June 2017.
- ↑ George Eaton (28 April 2017). "The economic slowdown is another reason Theresa May called an early election". New Statesman. Retrieved 8 June 2017.
- ↑ "UK unemployment falls to new 42-year low". BBC News. 16 August 2017. Retrieved 31 August 2017.
- ↑ "UK interest rates cut to 0.25%". BBC News. 4 August 2016. Retrieved 2 October 2016.
- ↑ "More About the Bank". Archived from the original on 12 March 2008. Retrieved 8 August 2008. Bank of England – Retrieved 8 August 2008
- 1 2 "Comprehensive Spending Review 2010" (PDF). HM Treasury. Retrieved 23 August 2015.
- 1 2 "Britain's public debt since 1974" The Guardian, 1 March 2009
- 1 2 "Statistical Bulletin Office for National Statistics: Public Sector Finances, June 2014" (PDF). 25 September 2014. Retrieved 25 September 2014.
- 1 2 3 4 "Agriculture in the United Kingdom, 2009" (PDF). DEFRA. Archived from the original (PDF) on 21 August 2010. Retrieved 17 June 2010.
- 1 2 3 4 5 6 7 8 9 10 11 12 "Release: United Kingdom National Accounts, The Blue Book, 2013 Edition". Office for National Statistics. 31 July 2013. Retrieved 13 August 2013.
- 1 2 3 "Construction Statistics Annual 2010" (PDF). Office for National Statistics. Archived from the original (PDF) on 29 June 2011. Retrieved 9 July 2013.
- ↑ "Crossrail Regional Map". Crossrail Ltd. Retrieved 8 September 2013.
- ↑ "Crossrail's giant tunnelling machines unveiled". BBC News. 2 January 2012.
- ↑ Leftly, Mark (29 August 2010). "Crossrail delayed to save £1bn". The Independent on Sunday. London.
- ↑ Britain moves a step closer to building new nuclear reactors, Financial Times, 9 January 2008
- ↑ Chris Cook and John Stevenson, Longman companion to Britain since 1945 (1996). pp 167-68.
- ↑ "UK manufacturers provide a strong foundation for growth in the UK" EEF (2017)
- ↑ Hennik Research. Annual Manufacturing Report: 2017 (Dec. 2016)
- 1 2 "Manufacturing in the UK: An economic analysis of the sector" (PDF). Department for Business, Innovation & Skills. Retrieved 25 April 2011.
- ↑ "The future of UK manufacturing: Reports of its death are greatly exaggerated" (PDF). PricewaterhouseCoopers. Archived from the original (PDF) on 19 July 2011. Retrieved 25 April 2011.
- 1 2 3 "Motor Industry Facts 2010" (PDF). SMMT. Archived from the original (PDF) on 27 November 2010. Retrieved 28 February 2011.
- ↑ "Facts & Figures – 2009" (PDF). Aerospace & Defence Association of Europe. Archived from the original (PDF) on 24 December 2010. Retrieved 13 May 2011.
- ↑ "UK Aerospace Industry Survey – 2010". ADS Group. Archived from the original on 27 May 2012. Retrieved 13 May 2011.
- ↑ "Aerospace". UK Trade & Investment. Archived from the original on 24 October 2010. Retrieved 20 October 2010.
- ↑ Robertson, David (9 January 2009). "The Aerospace industry has thousands of jobs in peril". London: The Times. Retrieved 20 October 2010.
- ↑ "Defense News Top 100 for 2009". Defense News. 2009. Archived from the original on 4 June 2012. Retrieved 29 July 2010.
- ↑ "Rolls-Royce Wins $2 Billion Air China, Ethiopian Airlines Deals". Bloomberg. 14 November 2009. Retrieved 8 September 2010.
- ↑ "Who we are". EADS UK. Archived from the original on 3 December 2010. Retrieved 30 October 2010.
- ↑ Bawden, Tom; Rose, David (27 January 2009). "Gordon Brown plans tonic for pharmaceutical industry". The Times. London. Retrieved 27 October 2010.
- ↑ "The pharmaceutical industry and market in the UK". The Association of the British Pharmaceutical Industry. Archived from the original on 14 December 2014. Retrieved 14 December 2014.
- ↑ "Facts & Statistics from the pharmaceutical industry". The Association of the British Pharmaceutical Industry. Archived from the original on 18 September 2010. Retrieved 27 October 2010.
- ↑ "British regulator calls for drug pricing overhaul". International Herald Tribune. 27 January 2009. Retrieved 27 October 2010.
- ↑ "Global 500 – Pharmaceuticals". Fortune. 20 July 2009. Retrieved 27 October 2010.
- 1 2 3 "United Kingdom – Quick Facts Energy Overview". US Energy Information Administration. Archived from the original on 18 September 2010. Retrieved 4 November 2010.
- 1 2 3 "United Kingdom – Oil". US Energy Information Administration. Archived from the original on 18 September 2010. Retrieved 4 November 2010.
- 1 2 "United Kingdom – Natural Gas". US Energy Information Administration. Archived from the original on 18 September 2010. Retrieved 4 November 2010.
- ↑ The Coal Authority (2007). "Coal Reserves in the United Kingdom" (PDF). Response to Energy Review. The Coal Authority. Archived from the original (PDF) on 10 September 2008. Retrieved 23 September 2008.
- ↑ "England Expert predicts 'coal revolution'". BBC News. 16 October 2007. Retrieved 23 September 2008.
- ↑ Mason, Rowena (24 October 2009). "Let the battle begin over black gold". London: The Telegraph. Retrieved 26 November 2010.
- ↑ Heath, Michael (26 November 2010). "RBA Says Currency Containing Prices, Rate Level `Appropriate' in Near Term". Bloomberg. Retrieved 26 November 2010.
- ↑ "From the Margins to the Mainstream – Government unveils new action plan for the creative industries". DCMS. 9 March 2007. Archived from the original on 4 December 2008. Retrieved 9 March 2007.
- ↑ "MediaCityUK – Talent Pool". MediaCityUK. Archived from the original on 25 September 2011. Retrieved 11 October 2011.
- ↑ "LFW: Fashion industry worth 26 billion pound to UK economy". FashionUnited Group. 17 February 2014. Retrieved 17 February 2014.
- ↑ "Which is the world's biggest employer?". BBC News. 20 March 2012.
- ↑ "Labour gets into bed with private medicine". The Guardian. London. 19 November 2000. Retrieved 11 November 2010.
- ↑ "At 60, the NHS needs reality check". Reuters. 3 July 2008. Retrieved 11 November 2010.
- ↑ HM Treasury (24 March 2008). "Budget 2008, Corrections to Table C11" (PDF). p. 1. Archived from the original (PDF) on 25 February 2009. Retrieved 27 December 2008.
- 1 2 "Higher education in facts and figures – Summer 2009" (PDF). Universities UK. Archived from the original (PDF) on 15 February 2010. Retrieved 29 January 2011.
- ↑ Sassen, Saskia (2001). The Global City: New York, London, Tokyo (2nd ed.). Princeton University Press.
- ↑ "Special Report – The Global 2000" Forbes, 2 April 2008
- ↑ "HSBC tops Forbes 2000 list of world's largest companies," HSBC website, 4 April 2008 Archived 13 January 2013 at the Wayback Machine.
- ↑ "UK law firms reap rich rewards while Americans strengthen London teams". Financial News. 23 July 2007. Retrieved 11 August 2010.
- ↑ Lazarowicz (Labour MP), Mark (30 April 2003). "Financial Services Industry". United Kingdom Parliament. Retrieved 17 October 2008.
- ↑ "Leeds leading the way". Yorkshire Evening Post. Retrieved 25 January 2009.
- ↑ "Leeds Financial Facts and Figures". leedsfinancialservices.org.uk. Archived from the original on 30 January 2009. Retrieved 25 January 2009.
- ↑ "Northern Star". FDI Magazine. Archived from the original on 1 January 2009. Retrieved 25 January 2009.
- ↑ "Leeds Services". Financial Times. Retrieved 25 January 2009.
- ↑ "Leeds Legal Review". Law Gazette. Archived from the original on 30 April 2009. Retrieved 25 January 2009.
- ↑ "Live the Leeds Lifestyle". Legal Week Magazine. Archived from the original on 29 April 2009. Retrieved 25 January 2009.
- ↑ Dark money: London’s dirty secret The Financial Times, 11 May 2016.
- ↑ London is now the global money-laundering centre for the drug trade, says crime expert The Independent, 4 July 2015.
- ↑ Cameron’s corrupt countries slip puts spotlight on UK Anadolu Agency, 13 May 2016.
- ↑ "Russian money infects London". 31 March 2015.
- ↑ "UK draws billions in unrecorded inflows, much from Russia - study". Reuters. 10 March 2015.
- ↑ Davenport, Justin (9 October 2015). "'Chip and sin' cash boom for crooks". London Evening Standard. p. 1.
- ↑ Ruddick, Graham (27 January 2011). "Capital Shopping Centres seals £1.6bn Trafford Centre deal despite Simon Property Group's concerns". The Telegraph. London. Retrieved 15 September 2011.
Capital Shopping Centres has sealed the UK's largest ever property transaction after 80pc of shareholders backed its £1.6bn acquisition of the Trafford Centre.
- ↑ Nigel Henretty (17 March 2017). "Housing affordability in England and Wales: 1997 to 2016". ONS. Retrieved 14 June 2017.
- ↑ "GDP boosted by £158bn of 'phantom rent'". New Economics Foundation. Retrieved 7 April 2016.
- ↑ "UNWTO Tourism Highlights 2015 Edition". UNWTO. Retrieved 13 April 2016.
- ↑ Bremner, Caroline (28 January 2016). "Top 100 City Destinations Ranking". Euromonitor International. Retrieved 13 April 2016.
- ↑ "Department for Transport Statistics: Passenger transport: by mode, annual from 1952".
- ↑ "High-speed rail's long journey". BBC News. 17 March 2014.
- ↑ "Crossrail's giant tunnelling machines unveiled". BBC News. 2 January 2012.
- ↑ Leftly, Mark (29 August 2010). "Crossrail delayed to save £1bn". The Independent on Sunday. London.
- ↑ "M6Toll Frequently asked questions". M6toll.co.uk. Archived from the original on 13 January 2013. Retrieved 5 September 2012.
- ↑ "Tackling congestion on our roads". Department for Transport. Archived from the original on 13 May 2010.
- ↑ "Delivering choice and reliability". Department for Transport. Archived from the original on 6 June 2009.
- ↑ Rod Eddington (December 2006). "The Eddington Transport Study". UK Treasury. Archived from the original on 13 May 2010.
- 1 2 "Size of Reporting Airports October 2009 – September 2010" (PDF). CAA. Archived from the original (PDF) on 27 May 2012. Retrieved 29 June 2011.
- ↑ "Heathrow 'needs a third runway'". BBC News. 25 June 2008. Retrieved 17 October 2008.
- ↑ "Statistics: Top 30 World airports" (PDF). Airports Council International. Retrieved 15 October 2008.
- ↑ "BMI being taken over by Lufthansa". BBC News. 29 October 2008. Retrieved 29 June 2011.
- ↑ "Beijing to overtake london as world's largest aviation hub. Massive new airport planned". Centre for Aviation. Retrieved 25 August 2012.
- ↑ Allister Heath (16 June 2016). "Why Britain's shopping spree will come at a cost". The Telegraph. Retrieved 18 June 2016.
- ↑ Potter, Mark (27 April 2011). "Aldi, Lidl take record share of UK grocery – Kantar". Reuters. Retrieved 14 May 2011.
- ↑ Potter, Mark (17 February 2011). "London tops world cities spending league". Reuters. Retrieved 14 May 2011.
- ↑ Potter, Mark (16 February 2011). "Tesco to outpace growth at global rivals – study". Reuters. Retrieved 14 May 2011.
- ↑ Chavez-Dreyfuss, Gertrude (1 April 2008). "Global reserves, dollar share up at end of 2007-IMF". Reuters. Retrieved 21 December 2009.
- ↑ Treneman, Ann (24 July 2007). "Puritanism comes too naturally for 'Huck' Brown". London: Times Online. Retrieved 24 July 2007.
- ↑ "Joining the Euro, all companies' polls". Mori.com. Archived from the original on 24 July 2008. Retrieved 5 September 2012.
- ↑ "EMU Entry and EU Constitution". MORI. 28 February 2005. Retrieved 17 May 2006.
- 1 2 3 "Yearly Average Currency Exchange Rates". IRS.
- 1 2 "Regional Gross Value Added (Income Approach), December 2016" (PDF). Office for National Statistics. 10 December 2014. p. 2. Retrieved 9 August 2015.
- ↑ eurostat.ec.europa.eu – Regional BIP per capita (German)
- ↑ University of Edinburgh, 2006, Graduate Programme in Economics Archived 16 February 2012 at the Wayback Machine.
- ↑ "Regional, sub-regional and local Gross Value Added 2010" (PDF). Statistical Bulletin. Office for national Statistics. 14 December 2011. p. 10. Retrieved 9 June 2012.
- ↑ "Objective One in Cornwall and the Isles of Scilly". The Partnership Office for Cornwall and the Isles of Scilly. Retrieved 9 June 2012.
- ↑ "The fDi Report 2014 – Europe". FDi Magazine. June 2014. Retrieved 17 July 2014.
- ↑ Ambrose Evans-Pritchard (15 October 2017). "Britain's missing billions: Revised figures reveal UK is £490bn poorer than previously thought". The Telegraph. Retrieved 15 October 2017.
- ↑ "M&A UK - Mergers and Acquisitions United Kingdom, England". IMAA-Institute. Retrieved 22 February 2018.
- ↑ "New UK reports back EU powers, enrage eurosceptics". EUobserver. Retrieved 16 February 2014.
- ↑ "Balance of EU competences review: research and development". UK Government. Retrieved 16 February 2014.
- ↑ "Growing unequal?". OECD website. 2008. Retrieved 20 September 2010.
- ↑ "People at risk of poverty after social transfers". Eurostat.
- ↑ "United Kingdom: Numbers in low income". The Poverty Site. Archived from the original on 13 July 2010. Retrieved 25 September 2009.
- ↑ "United Kingdom: Children in low income households". The Poverty Site. Archived from the original on 22 June 2009. Retrieved 25 September 2009.
- ↑ "Report for Selected Countries and Subjects". Retrieved 2018-09-01.
External links
- Economy at the Office for National Statistics
- UK economy at a glance at the Financial Times
- UK profile at the CIA World Factbook
- UK profile at The World Bank
| |||||||||||||
