Economy of Kenya
.jpg) | |
| Currency | Kenyan shilling (KES) |
|---|---|
Trade organisations | CEN-SAD, COMESA, EAC, WTO and others |
| Statistics | |
| GDP |
PPP: Nominal: |
| GDP rank |
69th (nominal) 74th (PPP) |
GDP growth |
5.7% (2015), 5.9% (2016), 4.9% (2017e), 5.5% (2018f) [2] |
GDP per capita |
PPP: Nominal: |
GDP by sector | agriculture (24.2%), industry (14.8%), services (62.5%) (2015.) |
|
| |
Population below poverty line | 42% ( March 2016 est.) |
| 42.5% (2008 est.) | |
Labour force |
|
Labour force by occupation | agriculture 75%, industry and services 25% (2015 est.) |
| Unemployment | 38% (2015 est.) |
Main industries | small-scale consumer goods (plastic, furniture, batteries, textiles, clothing, soap, cigarettes, flour), agricultural products, horticulture, oil refining; aluminium, steel, lead; cement, commercial ship repair, tourism |
|
| |
| External | |
| Exports |
|
Export goods | tea, horticultural products, coffee, petroleum products, fish, cement |
Main export partners |
|
| Imports |
|
Import goods | machinery and transportation equipment, petroleum products, motor vehicles, iron and steel, resins and plastics |
Main import partners |
|
| Public finances | |
|
$11,960,000,000 (31 December 2013 est.). | |
| Revenues | $15.43 billion (2017 est.) |
| Expenses | $24.59 billion (2017 est.) |
|
Standard & Poor's:[6] | |
Kenya's economy is market-based with a few state-owned infrastructure enterprises and maintains a liberalised external trade system. The country is generally perceived as Eastern and central Africa's hub for Financial, Communication and Transportation services. Major industries include: agriculture, forestry and fishing, mining and minerals, industrial manufacturing, energy, tourism and financial services. As of 2018 estimates, Kenya had a GDP of $85.980 billion making it the 69th largest economy in the world. Per capita GDP was estimated at $1,790.
The government of Kenya is generally investment friendly and has enacted several regulatory reforms to simplify both foreign and local investment, including the creation of an export processing zone. An increasingly significant portion of Kenya's foreign inflows are remittances by non-resident Kenyans who work in the US, Middle East, Europe and Asia.[8] Compared to its neighbours, Kenya has well-developed social and physical infrastructure.
As of September 2018, economic prospects were positive with above 6% GDP growth expected,[9] largely because of expansions in telecommunications, transport, construction and a recovery in agriculture. These improvements are supported by a large pool of English-speaking professional workers. There is a high level of computer literacy, especially among the youth.
In 2018, Kenya ranked 80th in the World Bank ease of doing business rating from 113rd in 2016 (of 190 countries).[10]
Economic history
The Kenyan coastal strip was integrated to the world economy through the ancient world trade routes that spanned Africa,Asia and Europe between 70 AD and 1500 AD[11].Foreign merchants brought their merchandise to Kenyan coast and left with African goods[12].After 1500AD,Vasco Da Gama discovered a new trade route to Asia through South Africa[13].This new route allowed European nations to start dominating the trade economy of the East African coast with Portuguese entrenching themselves in the 16th and 17th centuries[14].The Portuguese were replaced in this East African economic corridor by Oman Arabs in the 18th century[15].Eventually,the British replaced the Omani Arabs first at the coastal strip in the year 1895 then following the interior trade routes all the way to Buganda Kingdom by the year 1920[16].To make this ancient economic trade route more profitable,the British built a railway from Mombasa at the coast to Kampala,the capital of Buganda kingdom[17].The railway followed the old trade route and it was constructed by Indian laborers[18].Major towns in Kenya were founded along the railway line backed by European settler farming communities[19].The Indian laborers who did not go back to India after railway construction ended, were the first to establish shops(Dukawallah) in these towns[20].The farming European settler community and the Indian dukawallahs established the foundations of the modern formal Kenyan economy during the colonial period[21].Prominent examples of Asian-Kenyan business owners whose businesses started as Dukawallah include Manu Chandaria and Madatally Manji.[22].While the Europeans and Indians enjoyed good economic tidings between 1920 and 1963,Africans were robbed off their land,dehumanized and forced to work for minimal pay under the worst possible working conditions through a well established system of racial segregation[23][24].
After regaining its independence in 1963, Kenya promoted Africanization[25] of the Kenyan economy, rapid economic growth through public investment, encouragement of smallholder agricultural production, and incentives for private often foreign industrial investment.The sessional paper number 10 of 1965 stressed the need for Kenya to avoid the western driven capitalistic economy,the eastern driven communism but concentrate on African socialism while ensuring that Kenya's economic fortunes are not dependent on a satellite relationship to any country or group of countries[26]. Gross domestic product (GDP) grew at an annual average of 6.6% from 1963 to 1973 and 7.2% during the 1970s. Agricultural production grew by 4.7% annually during the same period, stimulated by redistributing estates, diffusing new crop strains, and opening new areas to cultivation. Between 1974 and 1990, however, Kenya's economic performance declined. With GDP growth averaging 4.2% per year in the 1980s and 2.2% a year in the 1990s.[27]
Kenya's policy of import substitution which started in 1946 with European and Asian enterprises, did not achieve the desired industrial economic transformation results and the rising oil prices made Kenya's manufacturing sector noncompetitive starting in the late 1970s[28]. The government began a massive intrusion in the private sector. Lack of export incentives, tight import controls, and foreign exchange controls made the domestic environment for investment even less attractive. From 1991 to 1993, Kenya had its worst economic performance since independence. Growth in GDP stagnated, and agricultural production shrank at an annual rate of 3.9%. Inflation reached a record 100% in August 1993, and the government's budget deficit was over 10% of GDP.[29] As a result of these combined problems, bilateral and multilateral donors suspended program aid to Kenya in 1991[30].
Between the 1980s-90s the introduction of structural adjustment programs (SAPs) sponsored by the IMF and World Bank contributed to the decline in Kenya's economy. Some of the SAP conditions, such as the structural adjustment loans and strict conditions regarding policy, resulted in a decrease in government spending on economic and social services, a decrease in education enrollment, and a increase in unemployment (specifically in the agricultural industry). The loans from the SAPs were also utilized to pay off other service debts that the country had at the time.[31] As a result, the formal economy gave way to the growth of the informal economy, living standards began to decline, and Kenya opened up to the global economy.[32]
In 1993, the Government of Kenya began a major program of economic reform and liberalisation. A new minister of finance and a new governor of the central bank undertook a series of economic measures with the assistance of the World Bank and the International Monetary Fund (IMF). As part of this program, the government eliminated price controls and import licensing, removed foreign exchange controls, privatised a range of publicly owned companies, reduced the number of civil servants, and introduced conservative fiscal and monetary policies[33]. From 1994 to 1996, Kenya's real GDP growth rate averaged just over 4% a year.[34]
In 1997, however, the economy entered a period of slowing or stagnant growth, due in part to adverse weather conditions and reduced economic activity prior to general elections in December 1997. In July 1997, the Government of Kenya refused to meet commitments made earlier to the IMF on governance reforms[35]. As a result, the IMF suspended lending for three years, and the World Bank also put a $90 million structural adjustment credit on hold[36].
The Government of Kenya took positive steps on reform, including the 1997 establishment of the Kenya Anti-Corruption Authority, and measures to improve the transparency of government procurements and reduce the government payroll. In July 2000, the IMF signed a $150 million Poverty Reduction and Growth Facility, and the World Bank followed suit shortly after with a $157 million Economic and Public Sector Reform credit.However,both were suspended[37].
Between 2003 and 2008,the economy however registered an improved economic growth and recovery under the Kibaki administration[38].The growth improved from 2% in 2003 to 7% in 2007[39].In 2008,the growth slumped to 1%[40] due to post election violence before averaging to 5% between 2009 to 2013[41].Between 2013 to 2018,the GDP growth has averaged above 5%[42].The first quarter 2018 registered 5.7%[43] growth while the second quarter of 2018 registered 6.2%[44] growth.
This is a chart of trend of gross domestic product of Kenya at market prices estimated by the International Monetary Fund with figures in millions of Kenyan Shillings.
| Year | Nominal GDP(USD) | US Dollar Exchange |
|---|---|---|
| 1980 | 7.265 Billion | 7.42 Shillings |
| 1985 | 6.135 Billion | 16.43 Shillings |
| 1990 | 8.591 Billion | 22.86 Shillings |
| 1995 | 9.046 Billion | 50.42 Shillings |
| 2000 | 12.71 Billion | 78.58 Shillings |
| 2005 | 18.74 Billion | 75.55 Shillings |
| 2010 | 40 Billion | 78.90 Shillings |
| 2015 | 63.77 Billion | 96.85 Shillings |
| 2018 | 85.98 Billion | 100.77 Shillings |
| 2020 | – | - |
Small scale businesses are providing a more and more jobs in Kenya. With increased but simplified regulations, they are able to blossom into large, legitimate businesses that can eventually create more jobs and government revenue.[45]
Gross Domestic Product

In 1963,Kenya's total GDP was US$926.6 Million with a population of 8.9 million and a per capita of US$104.
The GDP grew rapidly after Independence.Between 1964 and 1976 it averaged 7% per annum. By the last year of President Jomo Kenyatta government in 1978, the total GDP of Kenya was US$5.3 Billion with a population of 15.08 million and a per capita of US$351.
The GDP growth declined between 1982 to 1990 averaging 1-2%.Throughout President Daniel arap Moi's last term (1997–2002),the economy grew at an average rate of 1% per annum. In 2002,the last year of Moi's 24-years presidency,the GDP was US$13.15 Billion with a population of 32.93 Million and a per capita of US$395.
After Mwai Kibaki took over as president in 2003,the GDP growth quickly picked up to 2.3% in 2004 reaching an all time high of 7% in 2007.GDP growth slumped to 1% in 2008 due to post election violence,then picked up to 2.9% in 2009 before averaging 5% between 2009 to 2013 when the Grand Coalition government came to an end.In the last year of Kibaki and the grand coalition government in 2013,Kenya's total GDP was US$55.1 Billion with a population of 44.83 Million and a per capita of US$1,229.
Between 2013 to 2017 under Uhuru Kenyatta government, the GDP growth averaged 5% per annum. In 2018 Kenya's Gross Domestic Product (GDP) is about US$85.98 billion. Per capita GDP averages somewhat more than US$1,790 annually. Adjusted in purchasing power parity (PPP) terms, per capita GDP in 2018 is about US$3,657. The country's real GDP growth averaged 5.7 percent in the first quarter of 2018 and nearly 6.3 percent in the second quarter of 2018, compared with 4.7 percent in the first quarter of 2017.
Real GDP is expected to continue to improve, largely because of expansions in tourism, telecommunications, transport, and construction and a recovery in agriculture. The Kenya Central Bank forecast for 2018 is above 6 percent GDP growth. GDP composition by sector, according to 2018 estimates, is as follows: agriculture, 25.7 percent; manufacturing, 14.0 percent; trade, restaurants, and hotels, 13.8 percent; transport and communications, 6.9 percent; government services, 15.6 percent; and other, 24.0 percent.[46]
Agriculture, industry and manufacturing, and services GDP growth
Agriculture: In 1980, agriculture accounted for 33% of Kenya’s overall GDP.[47] In 1990, the value agriculture added to GDP was 30 percent, in 2000, it increased to 32 percent, and in 2011, and the value agriculture added to overall GDP fell to 23 percent.[47]
Industry and manufacturing: In the last 31 years, this component of Kenya's GDP has been greatly fluctuating. In 1980, industry and manufacturing accounted for 21 percent of Kenya's overall GDP.[47] In 1990, it decreased to 19 percent, and in 2000, the value added to GDP decreased again to 17 percent.[47] In 2011, there was a slight rise to 19 percent of Kenya's overall GDP.[47]
Services: The World Bank defines Services as jobs that are included in "wholesale and retail trade, transport, government, financial, professional, and personal services."[47] In 1980, services accounted for 47 percent of Kenya's overall GPD.[47] In 1990, it accounted for 51 percent, in 2000 it stayed constant at 51 percent, and in 2011, the services sector accounted for 58 percent of Kenya's overall GDP.[47]
Industries
Agriculture
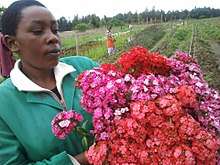
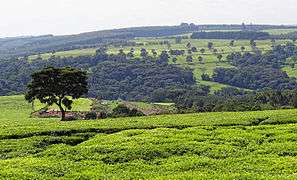
The agricultural sector continues to dominate Kenya's economy, although only 15 percent of Kenya's total land area has sufficient fertility and rainfall to be farmed, and only 7 or 8 percent can be classified as first-class land. In 2006 almost 75 percent of working Kenyans made their living on the land, compared with 80 percent in 1980.[46] About one-half of total agricultural output is non-marketed subsistence production. Agriculture is the second largest contributor to Kenya's gross domestic product (GDP), after the service sector. In 2005 agriculture, including forestry and fishing, accounted for about 24 percent of GDP, as well as for 18 percent of wage employment and 50 percent of revenue from exports. The principal cash crops are tea, horticultural produce, and coffee; horticultural produce and tea are the main growth sectors and the two most valuable of all of Kenya's exports. In 2005 horticulture accounted for 23 percent and tea for 22 percent of total export earnings. Coffee has declined in importance with depressed world prices, accounting for just 5 percent of export receipts in 2005. The production of major food staples such as corn is subject to sharp weather-related fluctuations. Production downturns periodically necessitate food aid—for example, in 2004 aid for 1.8 million people⎯because of one of Kenya's intermittent droughts. However, the expansion of credit to the agricultural sector has enabled farmers to better deal with the large risk of agriculture based on rainfall and the dramatic fluctuations of the prices of agricultural products.[46]
Tea, coffee, sisal, pyrethrum, corn, and wheat are grown in the fertile highlands, one of the most successful agricultural production regions in Africa. Livestock predominates in the semi-arid savanna to the north and east. Coconuts, pineapples, cashew nuts, cotton, sugarcane, sisal, and corn are grown in the lower-lying areas.[46]
Forestry and fishing
Resource degradation has reduced output from forestry. In 2004 roundwood removals came to 22,162,000 cubic meters. Fisheries are of local importance around Lake Victoria and have potential on Lake Turkana. Kenya's total catch reported in 2004 was 128,000 metric tons. However, output from fishing has been declining because of ecological disruption. Pollution, overfishing, and the use of unauthorised fishing equipment have led to falling catches and have endangered local fish species.[46]
Mining and minerals
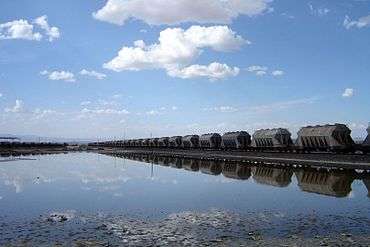
Kenya has no significant mineral endowment. The mining and quarrying sector makes a negligible contribution to the economy, accounting for less than 1 percent of gross domestic product, the majority contributed by the soda ash operation at Lake Magadi in south-central Kenya. Thanks largely to rising soda ash output, Kenya's mineral production in 2005 reached more than 1 million tons. One of Kenya's largest foreign-investment projects in recent years is the planned expansion of Magadi Soda. Apart from soda ash, the chief minerals produced are limestone, gold, salt, large quantities of niobium, fluorspar, and fossil fuel.[46]
All unextracted minerals are government property, according to the Mining Act. The Department of Mines and Geology, under the Ministry of Environment and Natural Resources, controls exploration and exploitation of such minerals.[46]
Industry and manufacturing
Although Kenya is the most industrially developed country in East Africa, manufacturing still accounts for only 14 percent of gross domestic product (GDP). This level of manufacturing GDP represents only a slight increase since independence. Expansion of the sector after independence, initially rapid, has stagnated since the 1980s, hampered by shortages in hydroelectric power, high energy costs, dilapidated transport infrastructure, and the dumping of cheap imports. However, due to urbanisation, the industry and manufacturing sectors have become increasingly important to the Kenyan economy, and has been reflected by an increasing GDP per capita. Industrial activity, concentrated around the three largest urban centres, Nairobi, Mombasa, and Kisumu, is dominated by food-processing industries such as grain milling, beer production, and sugarcane crushing, and the fabrication of consumer goods, e.g., vehicles from kits. Kenya also has an oil refinery that processes imported crude petroleum into petroleum products, mainly for the domestic market. In addition, a substantial and expanding informal sector engages in small-scale manufacturing of household goods, motor-vehicle parts, and farm implements. About half of the investment in the industrial sector is foreign, with the United Kingdom providing half. The United States is the second largest investor.[46]
Kenya's inclusion among the beneficiaries of the US Government's African Growth and Opportunity Act (AGOA) has given a boost to manufacturing in recent years. Since AGOA took effect in 2000, Kenya's clothing sales to the United States increased from US$44 million to US$270 million (2006). Other initiatives to strengthen manufacturing have been the new government's favourable tax measures, including the removal of duty on capital equipment and other raw materials.[46]
Energy
The largest share of Kenya's electricity supply comes from hydroelectric stations at dams along the upper Tana River, as well as the Turkwel Gorge Dam in the west. A petroleum-fired plant on the coast, geothermal facilities at Olkaria (near Nairobi), and electricity imported from Uganda make up the rest of the supply. Kenya's installed capacity stood at 1,142 megawatts a year between 2001 and 2003. The state-owned Kenya Electricity Generating Company (KenGen), established in 1997 under the name of Kenya Power Company, handles the generation of electricity, while the Kenya Power and Lighting Company (KPLC)[48] handles transmission and distribution. Shortfalls of electricity occur periodically, when drought reduces water flow. In 1997 and 2000, for example, drought prompted severe power rationing, with economically damaging 12-hour blackouts. Frequent outages, as well as high cost, remain serious obstacles to economic activity. Tax and other concessions are planned to encourage investment in hydroelectricity and in geothermal energy, in which Kenya is a pioneer. The government plans to open two new power stations in 2008, Sondu Miriu (hydroelectric) and Olkaria IV (geothermal), but power demand growth is strong, and demand is still expected to outpace supply during periods of drought.[46]
Kenya has recently found some hydrocarbon reserves on its semi arid northern region of Turkana after several decades of intermittent exploration. Prospecting also continues off Kenya's shore. In the meantime, Kenya currently imports all crude petroleum requirements. Petroleum accounts for 20 to 25 percent of the national import bill. Kenya Petroleum Refineries—a 50:50 joint venture between the government and several oil majors—operates the country's sole oil refinery in Mombasa. However, this oil refinery facility has been shut down and Kenya currently imports refined oil. In 2004 oil consumption was estimated at 55,000 barrels (8,700 m3) a day. Most of the Mombasa refinery's production is transported via Kenya's Mombasa–Nairobi pipeline.[46]
Tourism
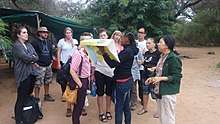

Kenya's services sector, which contributes about 63 percent of GDP, is dominated by tourism. The tourism sector exhibited steady growth in most years since independence and by the late 1980s had become the country's principal source of foreign exchange. In the late 1990s, tourism relinquished this position to tea exports because of a terrorism-related downturn. The downturn followed the 1998 bombing of the U.S Embassy in Nairobi and later negative travel advisories from Western governments. Kenya has also contributed to boosting hospitality in other countries, the Nairobi headquartered Serena Hotel is the most consistently high-rated hotel in Pakistan.
Tourists, the largest number from Germany and the United Kingdom, are attracted to the coastal beaches and the game reserves, notably, the expansive Tsavo East National Park and Tsavo West National Park (20,808 square kilometres) in the southeast. The government and tourist industry organisations have taken steps to address security issues and to reverse negative publicity. Such steps include establishing a tourist police and launching marketing campaigns in key tourist origin markets.[46] In 2006 tourism generated US$803 million, up from US$699 million the previous year.[46]
Financial services
Kenya is East and Central Africa's hub for financial services. The Nairobi Stock Exchange (NSE) is ranked 4th in Africa in terms of market capitalisation.
The Kenya banking system is supervised by the Central Bank of Kenya (CBK). As of late July 2004, the system consisted of 43 commercial banks (down from 48 in 2001), several non-bank financial institutions, including mortgage companies, four savings and loan associations, and several score foreign-exchange bureaus. Two of the four largest banks, the Kenya Commercial Bank (KCB) and the National Bank of Kenya (NBK), are partially government-owned, and the other two are majority foreign-owned (Barclays Bank and Standard Chartered). Most of the many smaller banks are family-owned and -operated.[46]
Labour
In 2006 Kenya's labour force was estimated to include about 12 million workers, almost 75 percent in agriculture. The number employed outside small-scale agriculture and pastoralism was about 6 million. In 2004 about 15 percent of the labour force was officially classified as unemployed. Other estimates place Kenya's unemployment much higher, even up to 40 percent. In recent years, Kenya's labour force has shifted from the countryside to the cities, such as Nairobi, as Kenya becomes increasingly urbanised.[46]
The labour force participation rate in Kenya has been constant from 1997 to 2010 for both women and men. In 1997, 65 percent of women were employed in some type of labour and 76 percent of men were employed.[47] In 2005, 60 percent of women and 70 percent of men were in the labour force, and in 2010, 61 percent of women and 72 percent of men were a part of the labour force.[47]
Family farm labour
In the past twenty years, Kenyans have moved away from family farming towards jobs that pay wages or to start small businesses outside of agriculture.[49] In 1989, 4.5 million Kenyan's, out of a total working population of 7.3 million, worked on family farms.[49] In 2009, only 6.5 million Kenya's, 45 percent, out of a total working population of 14.3 million, work on family farms, as compared to Tanzania, where 66 of the working population worked on family farms.[49] More than half of family farm workers in Kenya are women, 3.8 million, compared to men who make up 2.7 million.[49]
Wage-job labour
According to the World Bank 2012 Kenya Economic Update, "Men are much more likely than women to hold wage jobs, and women are more likely to work on family farms. Twice as many men as women hold wage jobs, and more men work principally in wage jobs than on family farms. Most Kenyans are now striving get modern, wage jobs."[49] Modern wage jobs include being a "engineer, telecommunication specialist, cut flower worker, teacher, construction worker, housekeepers, professionals, any industrial and manufacturing job, and port and dock workers."[49] In 1989, there were only 1.9 million Kenyans employed in wage work, in 2009, 5.1 million Kenyans work in modern, wage jobs.[49] In wage jobs, men dominate over women. In 2009, 3.4 million men held wage jobs, while only 1.3 million women were employed in wage jobs.[49]
Non-farm self-employment/"Jua Kali"
In Kenya, the "Jua Kali" sector is another name for the informal economy, also described as non-farming self employment.[49] The term "Jua Kali" is Swahili for "hot sun" and stems from the fact that the workers in the informal economy work under the fierce sun.[50] The informal sector consists of self-employment and wage employment that are neither regulated by the Kenyan government nor recognized for legal protection. As a result, informal sector employment does not contribute to Kenya's Gross Domestic Product (GDP) like that of the formal agriculture industry.[50] Non-farm self-employment has risen from 1989 to 2009.
The World Bank characterizes non-farm self-employment to include jobs being a "street vendor, shop owner, dressmaker, assistant, fishmonger, caterer, etc."[49] Non-farm self-employment has risen from a total of 0.9 million working in 1989 to a total of 2.7 million workers in 2009.[49] There is almost an equal number of men and women in the non-farm self-employment category. The men make up 1.4 million workers, and the women 1.3 million.[49]
As of 2009, Kenya's informal economy accounts for about 80 percent of the total employment for the country.[51] Kenya's informal sector consists of mostly self-employed individuals with few entrepreneurs whom employ others. Some of the benefits of the informal sector are that it contributes economic activity of what is equal to 35 % of the total GDP in Kenya, provides an informal finance in Kenya known as ROSCAs, and provides an income for those with lower socioeconomic status.[51]
Some drawbacks of the "Jua Kali" are that it promotes smuggling, tax evasion, and lacks social protection. Most members of the informal sector have low education attainment but are responsible for providing all of their own skilled labour through apprenticeships while also training almost all of its skilled workforce. Many choose to join the informal for its lack of fees, shorter training sessions, and practical content that is otherwise absent from formal education. Rising cost of education and no guarantees of future employment have caused many workers to transfer to informal apprenticeships.[52]
The Impact of Customary Law on the Informal Economy
Customary law has some adverse impacts on females in the informal sector.[53] The impact of customary law on informal economy is illustrated in how it influences the participation and opportunities of women in this sector. The 1882 Married Women’s Property Act gives married women equal property rights and the Law of Succession Act gives women inheritance rights, but the constitution exempts those who are considered “members of a particular race or tribe” and instead allows for their customary law to remain in practice.[53] Some of the consequences are that customary law allows for discrimination against women and keeps them from accessing assets, land, and property that might otherwise allow them to have collateral for business finance. This barrier to business finance restrains the amount of credit that women entrepreneurs might otherwise use to enter both the formal and informal sector. Some examples of discriminatory statutes in the constitution are, the Law of Succession Act, the Divorce Laws, and the Children’s Act 2001.[53] These statutes manifest themselves in very specific practices. For example, unmarried women inherit less than their brothers, married women are not expected to receive any inheritance, and women only have permission to manage their spouse's property as a surrogate for her sons.[53] Furthermore, women without children are still omitted from inheritance that may come from the death of their husband and married women are given a disproportionate control of property as compared to their spouse.[53] Because women have less assets and low education attainment, women are more likely to turn to the informal economy than men.[54]
Currency, exchange rate, and inflation
The exchange rate of the Kenya shilling between 2003 and 2010 has averaged at about KSh74-78 to US$1.[55]
The average inflation between 2005 and July 2015 is 8.5%,[56]
As at July 2015 Kenya's inflation rate is 6.62%.[57]
Government finances
Revenue and spending
In 2006 Kenya’s revenues totaled US$4.448 billion, while its estimated expenditures totaled US$5.377 billion. Government budget balance as a percentage of gross domestic product—a low −5.5 percent in 2004—had improved to −2.1 percent in 2006.[46]
As at 2012, Kenya set a record high budget of 1.459 trillion KES.[58]
According to 2018 reports, the budget was at 3 trillion as a deficit of 500 billion was borrowed.
Government debt
In 2006 Kenya had a current account deficit of US$1.5 billion. This figure was a significant increase over 2005, when the current account had a deficit of US$495 million. In 2006 the current account balance as a percentage of gross domestic product was −4.2.[46]
In 2006 Kenya's external debt totalled US$6.7 billion. The debt is forecast to be a manageable 30 percent of gross domestic product in 2007.[46]
In 2018, Kenya debt had risen to 5 trillion making the Chinese government to temporarily halt the continuation of the Phase 2- SGR railway.
Economic Stimulus Programme
The Kenya Economic Stimulus Program (ESP) was an initiative that aimed to stimulate economic activity in Kenya through investment in long term solutions to the challenges of food security, rural unemployment and underdevelopment. Its stated objective was to promote regional development for equity and social stability, improving infrastructure, enhancing the quality of education, availing affordable health-care for all Kenyans, investing in the conservation of the environment and expanding the access to and building the ICT capacity of the general populace of Kenya.[59] In launching the Economic Stimulus Programme, the Ministry of Finance aimed to achieve regional development for equity and social stability.
Integrated Financial Management Information System
Originally introduced in 2003, the Integrated Financial Management Information System (IFMIS)[60] was re-engineered by the Ministry of Finance to curb fraud and other malpractices that stem from inefficiency. In re-engineering IFMIS, the Ministry aimed to put Kenya's financial and economic information in a format that was accessible from an online platform, which would radically improve public expenditure management under the Ministry of Finance.
IFMIS enables fully integrated planning for the budgeting process since it links planning policy objectives and budget allocation.[61] It also seeks to support the e-Government shared services strategy by taking government financial services online. IFMIS will ensure that status reports are readily available, which enhances capacity to track budgets thus enabling effective decision-making. The three pronged benefits of IFMIS include leading to improvements in planning and budgeting, monitoring, evaluation and accountability and budget execution. Other benefits include aiding in the reduction in maintenance cost of government fleets in terms of fuel and spares where huge losses have been previously incurred.
Funds for the Inclusion of Informal Sector
The Fund for the Inclusion of Informal Sector (FIIS),[62] a fund that allows Micro and Small Entrepreneurs (MSE) to access credit facilities, expand their businesses and increase their savings.
It also aims to help informal enterprises transition to formal sector enterprises through access to formal providers of financial services. The fund is a revolving fund through which the government enters into credit facility agreements with select banks for on-lending to micro-and small-enterprises through branches, authorised banking agents and other channels, particularly mobile banking.
Its objective is to ensure that the MSE sector becomes efficient, innovative and has a diversified and competitive product range. It will also provide policies that raise the earnings and productivity of an estimated 8.3 million Kenyans working in the informal sector.
Investor compensation fund
The operations of the investor compensation fund, which aimed to compensate investors who had lost money to defunct stock brokers such as Nyaga Stock Brokers and Discount Securities Limited, was launched under his watch. In launching the operations of the fund, also ensured that the interests of future investors were safeguarded. The fund had prior to the launch of its operations been established under the Capital Markets Act.
This Fund is specifically meant to compensate investors who suffer losses resulting from failure of a licensed stockbroker or dealer to meet his contractual obligations. In both the case of the collapse of Nyaga Stock Brokers and the collapse of Discount Securities Limited all genuine claims within the statutory maximum of Sh.50,000 per every investor were compensated.
The government, through treasury and public financial management reforms, strengthened audit capacity as a result of structured capacity building and the merger of all Government of Kenya (GoK) audit functions (including those of schools and local authorities) so as to enhance their independence and effectiveness. The Ministry of Finance also issued a circular to bring donor-funded projects within the mandate of the Treasury's Internal Audit Department (IAD) with an aim of effectively monitoring the use of funds allocated to these projects.
Foreign economic relations

Since independence, Kenya, a nonaligned country, has seen both substantial foreign investment and significant amounts of development aid (total aid was $943 million in 2006, which was 4% of GNI[63]), some from Russia, some from China and others from the high developed countries. Between 60 and 70 percent of industry is still owned from abroad.
Kenya's development assistance has come from increasingly diverse sources in recent years with China taking an increasingly higher prominent role than the west. The share of funding provided by the United Kingdom has fallen significantly, while that of multilateral agencies, particularly the World Bank and the European Development Fund, has increased. The most active investors currently are the Chinese.
Kenya is active within regional trade blocs such as the Common Market for Eastern and Southern Africa (COMESA) and the East African Community (EAC), a partnership of Kenya, Uganda, and Tanzania. The aim of the EAC is to create a common market of the three states modelled on the European Union.[46] Among the early steps toward integration is the customs union which has eliminated duties on goods and non-tariff trade barriers among the members.
Exports
Kenya's chief exports are horticultural products and tea. In 2005, the combined value of these commodities was US$1,150 million, about 10 times the value of Kenya's third most valuable export, coffee. Kenya's other significant exports are petroleum products, sold to near neighbours, fish, cement, pyrethrum, and sisal. The leading imports are crude petroleum, chemicals, manufactured goods, machinery, and transportation equipment. Africa is Kenya's largest export market, followed by the European Union.[46]
The major destinations for exports are the United Kingdom (UK), Tanzania, Uganda, and the Netherlands. Major suppliers are China, India, United Arab Emirates, Saudi Arabia, and South Africa. Kenya's main exports to the United States are garments traded under the terms of the African Growth and Opportunity Act (AGOA). Despite AGOA, Kenya's apparel industry is struggling to hold its ground against Asian competition and runs a trade deficit with the United States. Many of Kenya's problems relating to the export of goods are believed by most economists to be caused by Kenya's export of inexpensive goods that saturate the global market but do little to substantially raise the amount of money coming into the country.[46]
Kenya is also the dominant trade partner of Uganda (12.3% exports, 15.6% imports) and Rwanda (30.5% exports, 17.3% imports).[64][65]
Balance of trade
Kenya typically has a substantial trade deficit. The trade balance fluctuates widely because Kenya's main exports are primary commodities subject to the effects of both world prices and weather. In 2005 Kenya's income from exports was about US$3.2 billion. The payment for imports was about US$5.7 billion, yielding a trade deficit of about US$2.5 billion.[46]
Foreign investment policies
Kenyan policies on foreign investment generally have been favourable since independence, with occasional tightening of restrictions to promote the Africanization of enterprises. Foreign investors have been guaranteed ownership and the right to remit dividends, royalties, and capital. In the 1970s, the government disallowed foreign investment unless there was also some government participation in the ownership of an enterprise.[46]
Notwithstanding some restrictions, between 60 and 70 percent of industry is still owned from abroad, a significant portion of which can be traced to fraudulent asset transfers by the colonial Britain during transition to independence. This denied Kenyans the opportunity to progress economically – relegating most of them to poverty and creating conditions that would lead to dependency on foreign aid. However, Kenyan has had more economic success and more success raising its own quality of life than some of its neighbours in Sub-Saharan Africa.[46]
Current economic standing
As of 18 June 2012, the Kenya Economic Update launched in Nairobi, indicating that the economy is stabilising due to government action in the third quarter of 2011. The actions taken consisted of a raise in interest rates that in turn brought inflation down. The latest World Bank economic report is projecting an economic growth of 5 percent in 2012, but the economy is still vulnerable to shocks that may reduce growth to a lower 4.1 percent. Johannes Zutt, the World Bank County Director for Kenya, quoted--”Kenya's per capita income has exceeded US$800 for the first time, and Kenyans have an opportunity to enjoy better standards of living as the economy progresses towards middle-income status in the coming years." Jane Kiringai, the Bank's Senior Economist for Kenya, makes a point that--“Structural weaknesses, including a widening current account deficit, pose a significant risk to Kenya's economic stability. Another oil price shock, poor harvest, or contagion in the Euro zone could easily create renewed economic turbulence and reverse the recent gains." Although these problems are currently taking place, the East African Community is creating opportunities to reduce the shocks occurring in Kenya's economy.[49]
Economic planning: Vision 2030
The Vision 2030 is Kenya's current blue-print for the future of economic growth. The long-term goals of this vision are to create a prosperous, and globally competitive nation with a high quality of life by the year 2030. To do this, it aims to transform Kenyan industry all the while creating a clean and secure environment. The vision is separated into three different pillars: economic, social, and political governance.[66][67]
The Economic Pillar
The Economic Pillar is seeking to achieve growth in the Gross Domestic Product of 10 percent by 2012. The economic areas that the Vision 2030 is targeting are: tourism, agriculture, wholesale/retail trade, manufacturing, IT enabled services, and Financial Services.[68]
The Social Pillar
The Social Pillar of Vision 2030 has the objective of improving the quality of life for all Kenyans. It aims to do this by targeting human and social welfare programs, specifically: education and training, health, environment, housing and urbanisation, children and social development, and youth and sports.[69]
The Political Pillar
The Political Pillar of Vision 2030 objective is to move to the future as one nation and envisions a democratic system that is issue based, people centred, results oriented, and is accountable to the public. It targets five main areas: The rule of law – the Constitution of Kenya, electoral and political processes, democracy and public service delivery, transparency and accountability, and security, peace building and conflict management.[70]
Criticism and challenges
The economy’s heavy dependence on rain-fed agriculture and the tourism sector leaves it vulnerable to cycles of boom and bust. The agricultural sector employs nearly 75 percent of the country's 38 million people. Half of the sector's output remains subsistence production.[46]
Kenya's economic performance has been hampered by numerous interacting factors: heavy dependence on a few agricultural exports that are vulnerable to world price fluctuations, population growth that has outstripped economic growth, prolonged drought that has necessitated power rationing, deteriorating infrastructure, and extreme disparities of wealth that have limited the opportunities of most to develop their skills and knowledge. Poor governance and corruption also have had a negative impact on growth, making it expensive to do business in Kenya. According to Transparency International, Kenya ranks among the world's half-dozen most corrupt countries. Bribery and fraud cost Kenya as much as US$1 billion a year. Kenyans, 23 percent living on less than US$1 per day, pay some 16 bribes a month—two in every three encounters with public officials. Another large drag on Kenya's economy is the burden of human immunodeficiency virus/acquired immune deficiency syndrome (HIV/AIDS).[46] Prospects significantly improved under the Kibaki government, whose policy aims include budgetary reforms and debt restraint.
Despite early disillusionment of western donors with the government, the economy has seen a broad-based expansion, led by strong performance in tourism and telecommunications, and acceptable post-drought results in agriculture, especially the vital tea sector.[46] Kenya's economy grew by more than 7% in 2007 and its foreign debt was greatly reduced.[46] However, it is possible to underscore that situation in Kenya will be stable over foreseeable future and it will result in stable economic growth, in 2014 it is expected to reach 4% and more in 2015 due to growing flow of foreign investment, prospective promotion of Kenyan goods on global markets and increment in demand for agricultural products, especially, for tea and cut flowers.[71] Western donors are now adopting a less paternalistic attitude towards their relations with African nations. However, there is still significant improvement to be done. 2007–2008 post election violence also impacted the Kenyan economy, greatly contributing to the downturn of Kenya's business cycle during the period.
See also
- Category: Companies of Kenya
- Eco-Pesa
- Vision 2030
General:
References
- 1 2 3 4 "Report for Selected Countries and Subjects (PPP valuation of Kenya GDP)". International Monetary Fund. Retrieved 2 June 2015.
- ↑ "World Bank forecast for Kenya, June 2018 (p. 153)" (PDF). World Bank. Retrieved 11 September 2018.
- ↑ "Ease of Doing Fishery in Kenya". Doingbusiness.org. Retrieved 24 November 2017.
- ↑ "Export Partners of Kenya". CIA World Factbook. 2012. Retrieved 27 July 2013.
- ↑ "Import Partners of Kenya". CIA World Factbook. 2012. Retrieved 27 July 2013.
- ↑ "Sovereigns rating list". Standard & Poor's. Retrieved 26 May 2011.
- 1 2 Rogers, Simon; Sedghi, Ami (15 April 2011). "How Fitch, Moody's and S&P rate each country's credit rating". The Guardian. Retrieved 31 May 2011.
- ↑ "Kenya Company Registration". Healy Consultants. Retrieved 2 September 2013.
- ↑ "Kenya Economic Survey 2018". Retrieved 30 September 2018.
- ↑ "Doing Business in Kenya - World Bank Group". www.doingbusiness.org. Retrieved 2017-01-14.
- ↑ "The Periplus of the Erythræan sea; travel and trade in the Indian Ocean" (PDF). New York : Longmans, Green, and Co. Retrieved 30 September 2018.
- ↑ "ZANG HE LIVED FOR ONE YEAR IN KENYA IN 1417". malindikenya.net. Retrieved 30 September 2018.
- ↑ "The History of the Vasco da Gama Pillar". Kenya Travel Sites. Retrieved 30 September 2018.
- ↑ "The Portuguese in Africa in the 19th Century". Jim Jones. Retrieved 30 September 2018.
- ↑ "19th Century Omani Rule". kenyastudy.wordpress.com. Retrieved 30 September 2018.
- ↑ "British East Africa Protectorate". enzimuseum.org. Retrieved 30 September 2018.
- ↑ "THE LUNATIC EXPRESS". The Agora. Retrieved 30 September 2018.
- ↑ "Settler Dominance, Agricultural Production and the Second World War in Kenya". Ian Spencer The Journal of African History Vol. 21, No. 4 (1980), pp. 497-51. Retrieved 30 September 2018.
- ↑ "The White Settlers in Kenya". InformationCrandle. Retrieved 30 September 2018.
- ↑ "Construction of the Kenya-Uganda Railway". enzimuseum.org. Retrieved 30 September 2018.
- ↑ "European settler farming". eLimu. Retrieved 30 September 2018.
- ↑ Himbara, David (1993). "Myths and Realities of Kenyan Capitalism". Journal of African Political Economy. 31 (1): 93–107. JSTOR 161345.
- ↑ "Colonialism and Colonial History of Kenya". informationcradle.com. Retrieved 30 September 2018.
- ↑ "Racial Discrimination In Kenya During the Colonial Period" (PDF). Ruth Catherine Cheruiyot Oklahoma State University,StillWater 1974. Retrieved 30 September 2018.
- ↑ "Sessional-Paper-No-10(1965) African Socialism and its Application to Planning in Kenya" (PDF). Kenya Government 1965. Retrieved 30 September 2018.
- ↑ "Sessional-Paper-No-10(1965) African Socialism and its Application to Planning in Kenya pg 16,Relationship With Other Countries" (PDF). Kenya Government 1965. Retrieved 30 September 2018.
- ↑ MWANGI S. KIMENYI; FRANCIS M. MWEGA; NJUGUNA S. NDUNG’U (May 2016). "The African Lions: Kenya country case study" (PDF). The Brookings Institution. Retrieved 23 May 2016.
- ↑ "The effects of import-substitution: the case of Kenya's manufacturing sector". Meilink, Henk A. (1982) Nairobi: Institute for Development Studies, University of Nairobi. Retrieved 30 September 2018.
- ↑ "Kenya (05/07/12)". U.S. Department of State. Retrieved 11 June 2015.
- ↑ "Aid Donors Insist on Kenya Reforms". New York Times Archives STEVEN GREENHOUSE NOV. 27, 1991. Retrieved 30 September 2018.
- ↑ Rono, Joseph Kipkemboi. "The impact of the structural adjustment programmes on Kenyan society." Journal of Social Development in Africa 17.1 (2002): 81-98.
- ↑ Kinyanjui, Mary Njeri. Women and the informal economy in urban Africa: From the margins to the centre. Zed Books Ltd., 2014.
- ↑ "Kenya Trade Liberalization of the 80s and 90s:Policies,Impacts,Implications" (PDF). Geoffrey Gertz,Wolfensohn Center for Development, Brookings Institution. Retrieved 30 September 2018.
- ↑ David Bigman (2002). Globalization and the Developing Countries: Emerging Strategies for Rural Development and Poverty Alleviation. CABI. p. 136. ISBN 978-0-85199-575-5.
- ↑ "Nairobi halts IMF and World Bank reforms". www.independent.co.uk. Retrieved 30 September 2018.
- ↑ "Kenya: World Bank, IMF Suspend Financial Aid to Kenya". allafrica.com. Retrieved 30 September 2018.
- ↑ "Kenya: World Bank, IMF Suspend Financial Aid to Kenya". allafrica.com. Retrieved 30 September 2018.
- ↑ "ECONOMIC RECOVERY STRATEGY FOR WEALTH AND EMPLOYMENT CREATION 2003 - 2007" (PDF). Kenya Government 2003. Retrieved 30 September 2018.
- ↑ "Kenya Vision 2030" (PDF). Kenya Government 2007. Retrieved 30 September 2018.
- ↑ "The Impact of Election (2007/2008) Violence on Kenya's Economy: Lessons Learned?" (PDF). Dr. Kiti Reginah M.K Kitiabi (PhD),ke.boell.org. Retrieved 30 September 2018.
- ↑ https://www.knbs.or.ke/download/economic-survey-2018/
- ↑ "Kenya Overview 2013-2018". World Bank. Retrieved 30 September 2018.
- ↑ "Kenya economy grew by 5.7pc in Q1 2018: IMF". IMF. Retrieved 30 September 2018.
- ↑ "Kenya's economy to grow by 6.2% in 2018 - CBK". Central Bank Of Kenya. Retrieved 30 September 2018.
- ↑ KenInvest supports small businesses to become engines of growth in Kenya | dandc.eu Archived 9 August 2011 at the Wayback Machine.
- 1 2 3 4 5 6 7 8 9 10 11 12 13 14 15 16 17 18 19 20 21 22 23 24 25 26 27 28 Kenya country profile. Library of Congress Federal Research Division (June 2007). This article incorporates text from this source, which is in the public domain.
- 1 2 3 4 5 6 7 8 9 10 "Labor force participation rate, female (% of female population ages 15+) (modeled ILO estimate)". Retrieved 11 June 2015.
- ↑ http://www.plc.co.ke
- 1 2 3 4 5 6 7 8 9 10 11 12 13 Kenya Economic Update: Kenya at work: Energizing the economy and creating jobs. World Bank. December 2012.
- 1 2 Ronald Hope Sr, Kempe. "Informal economic activity in Kenya: benefits and drawbacks." African Geographical Review 33.1 (2014): 67-80.
- 1 2 Ronald Hope Sr, Kempe. "Informal economic activity in Kenya: benefits and drawbacks." African Geographical Review 33.1 (2014): 67-80.
- ↑ Barasa, Fred Simiyu, and Eleanor SM Kaabwe. "Fallacies in policy and strategies of skills training for the informal sector: evidence from the jua kali sector in Kenya." Journal of education and work 14.3 (2001): 329-353.
- 1 2 3 4 5 Ellis, Amanda. Gender and economic growth in Kenya: Unleashing the power of women. World Bank Publications, 2007.
- ↑ Kinyanjui, Mary Njeri. Women and the informal economy in urban Africa: From the margins to the centre. Zed Books Ltd., 2014.
- ↑ Daniel Branch (15 November 2011). Kenya: Between Hope and Despair, 1963–2011. Yale University Press. ISBN 978-0-300-14876-3.
- ↑ S., Nyamu. "Inflation Rates". www.centralbank.go.ke. Archived from the original on 16 October 2015. Retrieved 14 September 2015.
- ↑ Kenya Inflation Rate "Archived copy" (PDF). Archived from the original (PDF) on 13 November 2012. Retrieved 28 November 2012. "Archived copy". Archived from the original on 16 October 2015. Retrieved 14 September 2015.
- ↑ Kenya Budget http://www.pwc.com/ke/en/pdf/kenya-budget-2012-revenue-and-expenditure-highlights.pdf
- ↑ https://web.archive.org/web/20120405063226/http://www.economicstimulus.go.ke/index.php?option=com_content&view=article&id=102&Itemid=226. Archived from the original on 5 April 2012. Retrieved 10 September 2015. Missing or empty
|title=(help) - ↑ "Republic of Kenya: Ministry of Finance". Finance.go.ke. Retrieved 2 August 2011.
- ↑ Nicholas Kerandi (nkerandi@netmedia.co.ke). "IFMIS re-engineered to revitalize public financial management". Pfmr.go.ke. Archived from the original on 25 March 2012. Retrieved 2 August 2011.
- ↑ "Capital Business". Capitalfm.co.ke. Archived from the original on 5 May 2011. Retrieved 2 August 2011.
- ↑ http://www.brookings.edu/~/media/research/files/papers/2009/1/kenya-aid-mwega/01_kenya_aid_mwega.pdf
- ↑ https://www.cia.gov/library/publications/the-world-factbook/geos/ug.html Uganda country profile, CIA World Factbook)
- ↑ https://www.cia.gov/library/publications/the-world-factbook/geos/rw.html Rwanda country profile, CIA World Fact book
- ↑ Vision 2030 http://www.vision2030.go.ke/index.php Archived 15 December 2012 at the Wayback Machine.
- ↑ http://kessa.org/yahoo_site_admin/assets/docs/3_A_Gitonga.140120221.pdf
- ↑ "The Economic Pillar" http://www.vision2030.go.ke/index.php/pillars Archived 15 December 2012 at the Wayback Machine.. Retrieved 25 November 2012
- ↑ "The Social Pillar" http://www.vision2030.go.ke/index.php/pillars/index/social Archived 15 December 2012 at the Wayback Machine.. Retrieved 25 November 2012
- ↑ "The Political Pillar" http://www.vision2030.go.ke/index.php/pillars/index/political Archived 15 December 2012 at the Wayback Machine.. Retrieved 26 November 2012
- ↑ "Enria.org" http://enria.org/economic-analysis/kenya-s-economic-growth-in-2014-and-2015 Archived 3 March 2014 at the Wayback Machine.. Retrieved 27 February 2014
Notes
![]()
![]()
Further reading
- Kitching, Gavin (1980). Class and Economic Change in Kenya. Yale University Press. ISBN 978-0-300-02385-5.
External links
| Wikimedia Commons has media related to Economy of Kenya. |
- CBIK – the Center for Business Information in Kenya, a division of the Kenya Export Promotion Council
- KenInvest; the Kenya Investment Authority, formed by the government of Kenya in 2004
- Kenya Economic Development at Curlie (based on DMOZ)
- Kenya latest trade data on ITC Trade Map
- Bio Jane Kiringai
- About Johannes Zutt
- News
- Trade
| Currency | ||
|---|---|---|
| History | ||
| Industry and business | ||
| Government agencies | ||
| Companies and Counties | ||
| Transport and Infrastructure | ||
| Communications | ||
| Finance and banking | ||
| Economic Blocs | ||
| Energy | ||
| Future | ||
.svg.png)