Economy of Poland
 | |
| Currency | 1 złoty (PLN) = 100 groszy |
|---|---|
| Calendar year | |
Trade organisations | EU, WTO and OECD |
| Statistics | |
| GDP |
|
| GDP rank | 24th (PPP, 2017 est.)[3] |
GDP growth | 4.4% (2018 est.)[4] |
GDP per capita |
|
GDP by sector | agriculture: 2.6% industry: 38.5% services: 58.9% (2016 est.) |
| 2.0% (2018 est.)[7] | |
| 30.8 (2015)[8] | |
Labour force | 17.6 million (2017 est.) |
Labour force by occupation | agriculture: 11.5% industry: 30.4% services: 58.1% (2015)[9] |
| Unemployment |
|
Average gross salary | PLN 4,973 / €1,193 / $1,460 monthly (December 2017)[11] |
Main industries |
|
|
| |
| External | |
| Exports |
|
Export goods | machinery and transport equipment 37.8%, intermediate manufactured goods 23.7%, miscellaneous manufactured articles 17.1%, food and live animals 7.6% (2012 est.) |
Main export partners |
|
| Imports |
|
Import goods | machinery and transport equipment 38.0%, intermediate manufactured goods 21.0%, chemicals 15.0%, minerals, fuels, lubricants and related materials 9.0% (2011 est.) |
Main import partners |
|
FDI stock |
|
Gross external debt |
|
| Public finances | |
|
| |
| Revenues |
|
| Expenses |
|
| Economic aid |
€67 billion from European Structural and Investment Funds (2007–2013)[14] €86 billion from European Structural and Investment Funds (2014–2020)[15] |
Foreign reserves |
|
The economy of Poland is the eighth largest economy in the European Union and the largest among the former Eastern Bloc members of the European Union.[19] Since 1990 Poland has pursued a policy of economic liberalization and its economy was the only one in the EU to avoid a recession through the 2007-2008 economic downturn.[20] In all, as of 2017 the Polish economy has been growing steadily for the past 26 years, a record high in the EU. Such growth has been exponential, with GDP per capita at purchasing power parity growing on average by 6% p.a. over the last 20 years, the most impressive performance in Central Europe resulting in the country doubling its GDP since 1990.
Poland is classified as high-income economy by World Bank[21] and ranks 23rd worldwide in terms of GDP as well as 24th in the 2017 Ease of Doing Business Index. The largest component of its economy is the service sector (62.3.%), followed by industry (34.2%) and agriculture (3.5%). With the economic reform of 1989 the Polish external debt increased from $42.2 billion in 1989 to $365.2 billion in 2014. Poland shipped US$198.2 billion worth of goods around the globe in 2015, up by 5.4% since 2011 and down 7.6% from 2014 to 2015. The top Polish exports include machinery, electronic equipment, vehicles, furniture, and plastics.
According to the Central Statistical Office of Poland, in 2010 the Polish economic growth rate was 3.7%, which was one of the best results in Europe. In 2014 its economy grew by 3.3% and in 2015 by 3.8%. Although in 2016 economic growth slowed, government stimulus measures combined with a tighter labour market in late 2016 kick-started new growth, which in 2017 the Polish Central Statistics Office states to be 5.2%.[22]
On 29 September 2017, the index provider FTSE Russell announced the results of the annual classification of markets. The Polish market has been upgraded from an emerging market to developed market status.[23]
History
Poland has seen the largest increase in GDP per capita (more than 100%) both among the former Soviet-bloc countries, and compared to the EU-15 (around 45%).[24] It has had uninterrupted economic growth since 1992, even after the 2007 financial crisis.[25]
Before 1989
This article discusses the economy of the current Poland, post-1989. For historical overview of past Polish economies, see:
- Economy of the People's Republic of Poland (1945–1989)
- Economy of the Second Polish Republic (1918–1939)
- Economy of the Polish–Lithuanian Commonwealth (1569–1795)
1990-2009
The Polish state steadfastly pursued a policy of economic liberalization throughout the 1990s, with positive results for economic growth but negative results for some sectors of the population. The privatization of small and medium state-owned companies and a liberal law on establishing new firms has encouraged the development of the private business sector, which has been the main drive for Poland's economic growth. The agricultural sector remains handicapped by structural problems, surplus labor, inefficient small farms, and a lack of investment. Restructuring and privatization of "sensitive sectors" (e.g. coal), has also been slow, but recent foreign investments in energy and steel have begun to turn the tide. Recent reforms in health care, education, the pension system, and state administration have resulted in larger than expected fiscal pressures. Improving this account deficit and tightening monetary policy, with focus on inflation, are priorities for the Polish government. Further progress in public finance depends mainly on the reduction of public sector employment, and an overhaul of the tax code to incorporate farmers, who currently pay significantly lower taxes than other people with similar income levels.
Since the 2009 financial crisis
Since the global recession of 2009, Poland's GDP continued to grow. In 2009, at the high point of the crisis, the GDP for the European Union as a whole dropped by 4.5% while Polish GDP increased by 1.6%. As of November 2013, the size of EU's economy remains below the pre-crisis level, while Poland's economy increased by a cumulative 16%. The major reasons for its success appear to be a large internal market (in terms of population is sixth in EU) and a business friendly political climate. The economic reforms implemented after the fall of socialism in the 1990s have also played a role; between 1989 and 2007 Poland's economy grew by 177%, faster than other countries in Eastern and Central Europe, while at the same time millions were left without work.[25]
However, the economic fluctuations of the business cycle did affect Poland's unemployment rate, which by early 2013 reached almost 11%. This level was still below European average and has begun falling subsequently.[26] As of October 2017, Poland's unemployment rate stood at 4.6% according to Eurostat.[27]
Data
The following table shows the main economic indicators in 1980–2017. Inflation under 2 % is in green.[28]
| Year | GDP (in Bil. US$ PPP) |
GDP per capita (in US$ PPP) |
GDP growth (real) |
Inflation rate (in Percent) |
Unemployment (in Percent) |
Government debt (in % of GDP) |
|---|---|---|---|---|---|---|
| 1980 | 168.7 | 4,744 | n/a | n/a | ||
| 1981 | n/a | n/a | ||||
| 1982 | n/a | n/a | ||||
| 1983 | n/a | n/a | ||||
| 1984 | n/a | n/a | ||||
| 1985 | n/a | n/a | ||||
| 1986 | n/a | n/a | ||||
| 1987 | n/a | n/a | ||||
| 1988 | n/a | n/a | ||||
| 1989 | n/a | n/a | ||||
| 1990 | 6.3 % | n/a | ||||
| 1991 | n/a | |||||
| 1992 | n/a | |||||
| 1993 | n/a | |||||
| 1994 | n/a | |||||
| 1995 | 48.7 % | |||||
| 1996 | ||||||
| 1997 | ||||||
| 1998 | ||||||
| 1999 | ||||||
| 2000 | ||||||
| 2001 | ||||||
| 2002 | ||||||
| 2003 | ||||||
| 2004 | ||||||
| 2005 | ||||||
| 2006 | ||||||
| 2007 | ||||||
| 2008 | ||||||
| 2009 | ||||||
| 2010 | ||||||
| 2011 | ||||||
| 2012 | ||||||
| 2013 | ||||||
| 2014 | ||||||
| 2015 | ||||||
| 2016 | ||||||
| 2017 |
Labour market and wages

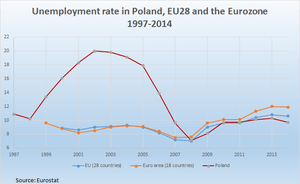

Unemployment in Poland appeared after the fall of socialism, although the economy previously had high levels of hidden unemployment. The unemployment rate then fell to 10% by the late 1990s and then increased again in the first few years of the 21st century, reaching a peak of 20% in 2002. It has since decreased, although unevenly. Since 2008 the unemployment rate in Poland has consistently been below European average.[29]
The rate fell below 8% in 2015,[30] leading to the possibility of a labor deficit.[31]
Foreign trade and FDI
With the collapse of the rouble-based COMECON trade bloc in 1991, Poland reoriented its trade. As early as 1996, 70% of its trade was with EU members. Neighboring Germany is Poland's main trading partner today. Poland joined the European Union in May 2004. Before that, it fostered regional integration and trade through the Central European Free Trade Agreement (CEFTA), which included Hungary, the Czech Republic, Slovakia and Slovenia.
Poland is a founding member of the World Trade Organization.[32] As a member of the European Union, it applies the common external tariff to goods from other countries including the United States. Poland's major imports are capital goods needed for industrial retooling and for manufacturing inputs. The country's exports also include machinery, but are highly diversified. The most successful exports are furniture, foods,[33] motor boats, light planes, hardwood products, casual clothing, shoes and cosmetics.[34] Germany is by far the biggest importer of Poland's exports as of 2013.[35] In the agricultural sector, the biggest money-makers abroad include smoked and fresh fish, fine chocolate, and dairy products, meats and specialty breads,[36] with the exchange rate conducive to export growth.[37] Food exports amounted to 62 billion złoty in 2011, increasing by 17% from 2010.[38] Most Polish exports to the U.S. receive tariff benefits under the Generalized System of Preferences (GSP) program.
Poland is less dependent on external trade than most other Central and Eastern European countries, but its volume of trade with Europe is still substantial. In 2011 the volume of trade (exports plus imports) with the Euro area as share of GDP was 40%, a doubling from the mid 1990s. 30% of Poland's exports are to Germany and another 30% to the rest of Europe. There has been substantial increase in Poland's exports to Russia.[39] However, in August 2014, exports of fruits and vegetables to Russia fell dramatically following its politically motivated ban by Moscow.[40]
Foreign direct investment (FDI) was at 40% of GDP in 2010, a doubling over the level in 2000. Most FDI into Poland comes from France, Germany and Netherlands. Polish firms in turn have foreign investments primarily in Italy and Luxembourg. Most of the internal FDI is in manufacturing, which makes it susceptible to economic fluctuations in the source countries.[39]
The UAE has become Poland's largest trading partner in the Arab world, said Roman Chalaczkiewicz, Polish Ambassador to the UAE, speaking to Gulf News.[41]
Polish law is rather favourable to foreign entrepreneurs. The government offers investors various forms of state aid, such as: CIT tax at the level of 19% and investment incentives in 14 Special Economic Zones (among others: income tax exemption, real estate tax exemption, competitive land prices), several industrial and technology parks, the possibility to benefit from the EU structural funds, brownfield and greenfield locations. According to the National Bank of Poland (NBP) the level of FDI inflow into Poland in 2006 amounted to €13.9 billion.
According to an Ernst & Young report, Poland ranks 7th in the world in terms of investment attractiveness. However, Ernst & Young's 2010 European attractiveness survey reported that Poland saw a 52% decrease in FDI job creation and a 42% decrease in number of FDI projects since 2008.[42] According to the OECD (www.oecd.org) report, in 2004 Poles were one of the hardest working nations in Europe. Yet, the ability to establish and conduct business easily has been cause for economic hardship; the 2010 the World Economic Forum ranked Poland near the bottom of OECD countries in terms of the clarity, efficiency and neutrality of the legal framework used by firms to settle disputes.[43]
Sectors
Production industries
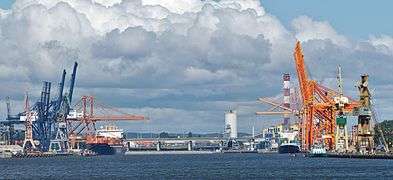
Before World War II, Poland's industrial base was concentrated in the coal, textile, chemical, machinery, iron, and steel sectors. Today it extends to fertilizers, petrochemicals, machine tools, electrical machinery, electronics, car manufacture and shipbuilding.
Poland's industrial base suffered greatly during World War II, and many resources were directed toward reconstruction. The socialist economic system imposed in the late 1940s created large and unwieldy economic structures[44] operated under a tight central command. In part because of this systemic rigidity, the economy performed poorly even in comparison with other economies in Central Europe.[44]
In 1990, the Tadeusz Mazowiecki government began a comprehensive reform programme to replace the centralised command economy with a market-oriented system. While the results overall have been impressive, many large state-owned industrial enterprises, particularly the rail, mining, steel, and defence sectors, have remained resistant to change and the downsizing required to survive in a market-based economy.[44]
Energy
Pharmaceutics
The total value of the Polish pharmacy market in 2008 was PLN 24.1bn, 11.5% more than in 2007.[45]
The non-prescription medicines market, which accounts for about one-third of the total market value, was worth PLN 7.5bn in 2008. This value includes drugs and non-drugs such as dietary supplements, cosmetics, dressings, dental materials, diagnostic tests and medical devices. The prescription medicines market was worth PLN 15.8bn.[46]
Agriculture
Agriculture employs 12.7% of the work force but contributes 3.8% to the gross domestic product (GDP), reflecting relatively low productivity. Unlike the industrial sector, Poland's agricultural sector remained largely in private hands during the decades of real socialist rule. Most of the former state farms are now leased to farmer tenants. Lack of credit is hampering efforts to sell former state farmland. Currently, Poland's 2 million private farms occupy 90% of all farmland and account for roughly the same percentage of total agricultural production. Farms are small—8 hectares on average—and often fragmented. Farms with an area exceeding 15 ha accounted for 9% of the total number of farms but cover 45% of total agricultural area. Over half of all farm households in Poland produce only for their own needs with little, if any, commercial sales.
Poland is a net exporter of processed fruit and vegetables, meat, and dairy products. Processors often rely on imports to supplement domestic supplies of wheat, feed grains, vegetable oil, and protein meals, which are generally insufficient to meet domestic demand. However, Poland is the leading EU producer of potatoes and rye and is one of the world's largest producers of sugar beets and triticale. Poland also is a significant producer of rapeseed, grains, hogs, and cattle. Poland is the sixth largest producer and exporter of apples in the entire world.[47]
Tourism

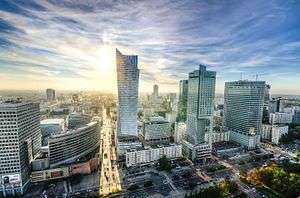
Poland, especially after joining the European Union in 2004, became a place frequently visited by tourists. Most tourist attractions in Poland are connected with natural environment, historic sites and cultural events. They draw millions of tourists every year from all around the world. According to Tourist Institute's data, Poland was visited by 15.7 million tourists in 2006, and by 15 million tourists in 2007,[48] out of the total number of 66.2 million foreign visitors.[49] In 2016 the number of arrivals to Poland amounted to 80.5 million. 17.5 million of this number are arrivals considered for tourism purposes (with at least one night's stay), making it the 16th most visited country in the world.[50] The most popular cities are Kraków, Warsaw, Wrocław, Gdańsk, Poznań, Szczecin, Lublin, Toruń, Sopot, Zakopane and the Wieliczka Salt Mine. The best recreational destinations include Poland's Masurian Lake District, Baltic Sea coast, Tatra Mountains (the highest mountain range of Carpathians), Sudetes and Białowieża Forest. Poland's main tourist offers consist of sightseeing within cities and out-of-town historical monuments, business trips, qualified tourism, agrotourism, mountain hiking (trekking) and climbing among others.
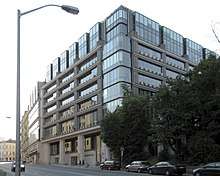
Financial sector
The Polish banking sector is regulated by the Polish Financial Supervision Authority (PFSA).
While transforming the country to a market-oriented economy during 1992–97, the government privatized some banks, recapitalized the rest and introduced legal reforms that made the sector competitive. These reforms, and the health and relative stability of the sector, attracted a number of strategic foreign investors. At the beginning of 2009, Poland's banking sector had 51 domestic banks, a network of 578 cooperative banks and 18 branches of foreign-owned banks. In addition, foreign investors had controlling stakes in nearly 40 commercial banks, which made up 68% of the banking capital.[51] Banks in Poland reacted to the financial crisis of 2009 by restraining lending, raising interest rates, and strengthening balance sheets. Subsequently, the sector started lending again, with an increase of more than 4% expected in 2011.
Transportation

Poland is served by an extensive network of railways. In most cities the main railway station is located near a city centre and is well connected to the local transportation system. The infrastructure is operated by Polish State Railways, part of state-run PKP Group. The rail network is very dense in western and northern Poland, while eastern part of the country is less developed. The capital city, Warsaw, has the country's only rapid transit system: the Warsaw Metro.
The most important airport in Poland is Warsaw 'Frederic Chopin' International Airport. Warsaw's airport is the main international hub for LOT Polish Airlines. In addition to Warsaw Chopin, Wrocław, Gdańsk, Katowice, Kraków and Poznań all have international airports. In preparation for the Euro 2012 football championships jointly hosted by Poland and Ukraine, a number of airports around the country were renovated and redeveloped. This included the building of new terminals with an increased number of jetways and stands at both Copernicus Airport in Wrocław and Lech Wałęsa Airport in Gdańsk.
Poland has 412,264 km (256,170 mi) of public roads overall. Polish public roads are grouped into categories related to administrative division, which include National roads, Voivodeship roads, Powiat roads and Gmina roads. Motorways and expressways are part of the national road network. As of 10 January 2016, there are 3,274.67 km (2,034.79 mi) of motorways (autostrady, singular - autostrada) and expressways (drogi ekspresowe, singular - droga ekspresowa) in use.
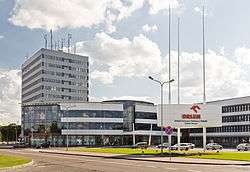
Major Polish companies
Selection from the list of 500 largest companies in Poland compiled by magazine Polityka.[52]
|
|
Currency
Budget and debt

The public and private debt levels of Poland are below the European average (2017).
GDP growth in Poland

Recent GDP growth (comparing to the same quarter of previous year):[53]
| Year | Q1 | Q2 | Q3 | Q4 | Overall |
|---|---|---|---|---|---|
| 2018 | 5.2% | 5.1% | |||
| 2017 | 4.4% | 4.3% | 5.2% | 4.3% | 4.6% |
| 2016 | 2.7% | 2.2% | 2.3% | 3.2% | 2.9% |
| 2015 | 3.9% | 3.4% | 3.8% | 4.2% | 3.8% |
| 2014 | 3.1% | 3.1% | 3.2% | 3.6% | 3.3% |
| 2013 | 0.1% | 1.3% | 1.7% | 2.2% | 1.4% |
| 2012 | 3.7% | 2.1% | 1.2% | 0.0% | 1.6% |
| 2011 | 5.2% | 5.1% | 5.1% | 4.8% | 5.0% |
| 2010 | 2.5% | 3.6% | 4.4% | 4.1% | 3.7% |
| 2009 | 2.1% | 1.9% | 2.0% | 4.1% | 2.6% |
| 2008 | 5.8% | 5.0% | 4.0% | 1.2% | 3.9% |
| 2007 | 7.5% | 7.5% | 6.4% | 7.4% | 7.2% |
| 2006 | 5.0% | 6.0% | 6.4% | 7.1% | 6.2% |
| 2005 | 3.1% | 2.3% | 4.7% | 4.0% | 3.5% |
| 2004 | 6.8% | 5.7% | 3.7% | 4.5% | 5.1% |
| 2003 | 2.0% | 3.8% | 4.1% | 4.3% | 3.6% |
| 2002 | 0.4% | 1.3% | 1.7% | 2.4% | 1.4% |
See also
External links
- www.paiz.gov.pl
- Attractiveness Europe 2007
- The Polish economy in 2007 on YouTube
- Articles on Polish economy in Central and Eastern European Packaging magazine
- OECD's Poland country Web site and OECD Economic Survey of Poland
- Business Portal for Poland
- World Bank Summary Trade Statistics Poland
- Tariffs applied by Poland as provided by ITC's Market Access Map, an online database of customs tariffs and market requirements
References
- ↑ https://www.imf.org/external/datamapper/NGDPD@WEO/OEMDC/ADVEC/WEOWORLD
- ↑ https://www.imf.org/external/datamapper/PPPGDP@WEO/OEMDC/ADVEC/WEOWORLD
- ↑ "The World Factbook — Central Intelligence Agency". www.cia.gov. Retrieved 25 March 2018.
- ↑ https://www.imf.org/external/datamapper/NGDP_RPCH@WEO/OEMDC/ADVEC/WEOWORLD
- ↑ https://www.imf.org/external/datamapper/NGDPDPC@WEO/OEMDC/ADVEC/WEOWORLD
- ↑ https://www.imf.org/external/datamapper/PPPPC@WEO/OEMDC/ADVEC/WEOWORLD
- ↑ https://www.imf.org/external/datamapper/PCPIPCH@WEO/OEMDC/ADVEC/WEOWORLD
- ↑ "The World Factbook — Central Intelligence Agency". www.cia.gov. Retrieved 25 March 2018.
- ↑ "The World Factbook — Central Intelligence Agency". www.cia.gov. Retrieved 25 March 2018.
- ↑ http://www.imf.org/external/datamapper/LUR@WEO/OEMDC/ADVEC/WEOWORLD
- ↑ http://stat.gov.pl/en/latest-statistical-news/communiques-and-announcements/list-of-communiques-and-announcements/average-monthly-gross-wage-and-salary-in-enterprise-sector-in-december-2017,11,49.html
- ↑ "Doing Business in Poland - World Bank Group". www.doingbusiness.org. Retrieved 25 March 2018.
- ↑ https://www.imf.org/external/datamapper/GGXWDG_NGDP@WEO/OEMDC/ADVEC/WEOWORLD
- ↑ http://ec.europa.eu/regional_policy/sources/docgener/informat/country2009/pl_en.pdf
- ↑ http://ec.europa.eu/regional_policy/sources/policy/what/investment-policy/esif-country-factsheet/esi_funds_country_factsheet_pl_en.pdf
- ↑ "S&P keeps Poland's rating, outlook unchanged". thenews.pl. Retrieved 25 March 2018.
- ↑ "Moody's changes outlook on Poland's A2 issuer rating to stable from negative; affirms ratings". moodys.com. 12 May 2017. Retrieved 25 March 2018.
- ↑ "Press Release". www.fitchratings.com. Retrieved 25 March 2018.
- ↑ "Report for Selected Countries and Subjects". www.imf.org. Retrieved 25 March 2018.
- ↑ Editorial, Reuters. "Poland was a". reuters.com. Retrieved 25 March 2018.
- ↑ "WDI 2017 Maps - Data". data.worldbank.org. Retrieved 25 March 2018.
- ↑ Frączyk, Jacek (7 December 2017). "Wzrostem PKB Polska zostawia Europę daleko z tyłu. Najnowsze dane Eurostatu". money.pl. Retrieved 25 March 2018.
- ↑ "FTSE Russell upgrades Poland from emerging to developed market". thenews.pl. Retrieved 25 March 2018.
- ↑ Piatkowski, Marcin. "How Poland Became Europe's Growth Champion: Insights from the Successful Post-Socialist Transition". brookings.edu. Retrieved 25 March 2018.
- 1 2 "The Next Economic Powerhouse? Poland - BusinessDay : News you can trust". businessdayonline.com. 5 July 2017. Retrieved 25 March 2018.
- ↑ "Poland has employee's market: minister". thenews.pl. Retrieved 25 March 2018.
- ↑ "File:Unemployment rates, seasonally adjusted, October 2017 (%) F2.png - Statistics Explained". ec.europa.eu. Retrieved 25 March 2018.
- ↑ "Report for Selected Countries and Subjects". www.imf.org. Retrieved 2018-09-19.
- ↑ "File:Unemployment rates, seasonally adjusted, October 2015.png - Statistics Explained". ec.europa.eu. Retrieved 25 March 2018.
- ↑ "Unemployment statistics - Statistics Explained". ec.europa.eu. Retrieved 25 March 2018.
- ↑ Internet, JSK. "Poland facing risk of labor force deficit in 2015". msp.gov.pl. Retrieved 25 March 2018.
- ↑ "Poland: June 2000". Trade Policy Reviews. World Trade Organization. 26 June 2000. Retrieved 21 May 2014.
- ↑ PAP, 9 May 2013 Polska żywność - fundament polskiego eksportu - 2012 kolejnym rokiem rekordowego eksportu żywności. Ministerstwo Skarbu Państwa (Internet Archive).
- ↑ GUS, Najwięksi partnerzy handlowi Polski: kto kupuje nasze produkty? 9 July 2014 (Internet Archive)
- ↑ Ministerstwo Gospodarki, Polska - kierunki eksportu i najchętniej kupowane produkty z naszego kraju. 8 December 2013 Euro-Dane :: Ekonomia Unii Europejskiej (Internet Archive). Most important importers of Poland's 2012 exports, graph. Archived 6 November 2014 at the Wayback Machine. Manifo.
- ↑ Patrycja Maciejewicz, Leszek Baj, Polska żywność jedzie w świat. Pełno niespodzianek 2012-04-07, Wyborcza.biz (Internet Archive).
- ↑ PAP, Więcej niż 80 proc. eksportu żywności z Polski to przetworzone produkty spożywcze 10-10-2014 Portal Spozywczy.pl (Internet Archive).
- ↑ Wiesław Łopaciuk, Padł rekord wartości eksportu produktów rolno-spożywczych z Polski. Powód: słaby złoty Rzeczpospolita, 27-01-2012 (Internet Archive). "Z analizy "Rzeczpospolitej" wynika, że łączna wartość eksportu produktów rolno-spożywczych Polski mogła w 2011 r. sięgnąć 62 mld zł. W porównaniu z 2010 r. była o niemal 17 proc. wyższa."
- 1 2 Ho, Giang (July 2012). "Republic of Poland. Selected Issues" (PDF). IMF Country Report. 12 (163).
- ↑ http://www.channelnewsasia.com/news/world/ban-on-food-imports-due/1297280.html
- ↑ UAEinteract.com. "UAE is Poland's largest Arab trading partner". Uaeinteract.com. Archived from the original on 17 September 2011. Retrieved 25 May 2011.
- ↑ Schwab, Klaus. "The Global Competitiveness Report 2010-2011" (PDF). World Economic Forum. Retrieved 25 April 2011.
- ↑ "Waking up to the new economy: Ernst & Young's 2010 European attractiveness survey" (PDF). Ernst & Young. Archived from the original (PDF) on 4 July 2010. Retrieved 25 April 2011.
- 1 2 3 "Poland (11/07)". US Department of State. Retrieved 25 September 2013.
- ↑ KPMG. "The Polish Pharmaceutical Market" (PDF). Yieldopedia. Retrieved June 7, 2018.
- ↑ "Polish pharmaceutical market". Pharmapoland.com. Retrieved 25 May 2011.
- ↑ Top 10 apple producing countries in the world. WhichCountry.co, General Knowledge.
- ↑ Information about tourism in Poland (in Polish). Archived 16 April 2013 at Archive.is Source: Instytut Turystyki, 2008.
- ↑ GUS (2008). "Przyjazdy do Polski (Foreign visits to Poland)". Statistics (in Polish). Instytut Turystyki. Archived from the original on 25 December 2012. Retrieved 31 December 2012.
- ↑ "International tourism, number of arrivals - Country Ranking". Retrieved 2017-10-28.
- ↑ Wprost (2011-11-09). "Belka: polskie banki znów powinny być polskie". 70 proc. polskiego systemu bankowego jest własnościowo zdominowane przez banki zagraniczne. Biznes: Polityka i gospodarka, Wprost.pl. Archived from the original (Internet Archive) on 12 November 2014. Retrieved 12 November 2014.
w Polsce nie zbudowano by nowoczesnego systemu bankowego [bez akcjonariuszy zagranicznych, stwierdził Prezes NBP. Bez nich] Polska nie uniknęłaby kryzysu bankowego — Marek Belka, prezes Narodowego Banku Polskiego.
- 1 2 "500 largest companies in Poland". Lista500.polityka.pl. Polityka. Retrieved 25 May 2011.
- ↑ "Quarterly National Accounts : Quarterly Growth Rates of real GDP, change over previous quarter". Stats.oecd.org. Retrieved 2014-06-01.
_F2.png)
- Worldmark Encyclopedia of National Economics, Volume 4 – Europe, Gale Group, 2002, ISBN 0-7876-4955-4
- Economic data from Eastern European Markets (ceeMarket.com)
Poland articles | |||||||||
|---|---|---|---|---|---|---|---|---|---|
| History |
|  | |||||||
| Geography | |||||||||
| Politics | |||||||||
| Economy | |||||||||
| Culture |
| ||||||||
| |||||||||
[[Category:World Trade Organization member economies|Poland