Economy of Italy
 | |
| Currency | 1 Euro = 1.17 USD (Except in Campione d'Italia CHF) |
|---|---|
| 1 January – 31 December | |
Trade organisations | European Union, WTO, OECD, AIIB |
| Statistics | |
| GDP |
$2.181 trillion (nominal; 2018)[1] $2.399 trillion (PPP; 2018)[1] |
| GDP rank | (2018)[2] |
GDP growth |
|
GDP per capita |
$35,913 (nominal; 2018)[1] $39,499 (PPP; 2018)[1] |
GDP per capita rank | |
GDP by sector | agriculture: 2.2%; industry: 23.9%; services: 73.8% (2016 est.) |
|
| |
Population below poverty line | 5.7% in poverty, 2014;[5] 24.7% at risk of poverty or social exclusion, 2014[6] |
| 33.1 (2016)[7] | |
Labour force | 25.6 million (2016 est.) |
Labour force by occupation | agriculture: 3.9%; industry: 28.3%; services: 67.8% (2011) |
| Unemployment |
|
Average gross salary |
€29,114 (2016)[9] / (average net disposable income per capita) €19,086, yearly (+2,0%)(2017) [10] |
Main industries | |
|
| |
| External | |
| Exports |
|
Export goods | Engineering products, textiles and clothing, production machinery, motor vehicles, transport equipment, chemicals; foodstuffs, beverages, and tobacco; minerals, nonferrous metals |
Main export partners |
|
| Imports |
|
Import goods | Engineering products, chemicals, transport equipment, energy products, minerals and nonferrous metals, textiles and clothing; food, beverages, tobacco |
Main import partners |
|
FDI stock | $0.7 trillion |
Gross external debt | $2.324 trillion (June 2017)[14] |
| Public finances | |
| 133.3% of GDP (2017 est.) | |
| Revenues | $842.5 billion (2016 est.) |
| Expenses | $889.8 billion (2016 est.) |
| Economic aid | donor: ODA, $4.86 billion (2016)[15] |
|
Standard & Poor's:[16] BBB Outlook: Stable Moody's:[17] Baa2 Outlook: Negative Fitch:[18] BBB Outlook: Stable | |
Foreign reserves | $143.1 billion (March 2016) |
The economy of Italy is the 3rd-largest national economy in the eurozone, the 8th-largest by nominal GDP in the world, and the 12th-largest by GDP (PPP). The country, that has a major advanced economy,[19] is a founding member of the European Union, the Eurozone, the OECD, the G7 and the G20. Italy is the eighth largest exporter in the world with $514 billion exported in 2016. Its closest trade ties are with the other countries of the European Union, with whom it conducts about 59% of its total trade. The largest trading partners, in order of market share, are Germany (12.6%), France (11.1%), United States (6.8%), Switzerland (5.7%), United Kingdom (4.7%), and Spain (4.4%).[20]
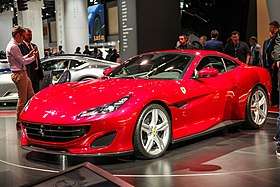
In the post-war period, Italy was transformed from an agricultural based economy which had been severely affected by the consequences of the World Wars, into one of the world's most advanced nations,[21] and a leading country in world trade and exports. According to the Human Development Index, the country enjoys a very high standard of living, and has the world's 8th highest quality of life according to The Economist.[22] Italy owns the world's third-largest gold reserve,[23] and is the third net contributor to the budget of the European Union.[24] The country is also well known for its influential and innovative business economic sector, an industrious (Italy is the second largest manufacturer in Europe[25] behind Germany) and competitive agricultural sector (Italy is the world's largest wine producer),[26] and for its creative and high-quality automobile, naval, industrial, appliance and fashion design. Italy is the largest hub for luxury goods in Europe and the third luxury hub globally.[27][28] Furthermore, the country's private wealth is one of the largest in the world.
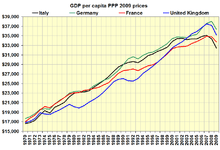
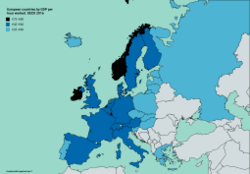
Despite these important achievements, the country's economy today suffers from structural and non-structural problems. After strong GDP growth in 1945–1990, the last two decades' average annual growth rates were below the EU average with Italy being hit particularly hard by the late-2000s recession. The stagnation in economic growth, and the political efforts to revive it with massive government spending from the 1980s onwards, eventually produced a severe rise in public debt. In addition, Italian living standards have a considerable North–South divide: the average GDP per capita in Northern and Central Italy significantly exceeds the EU average, while some regions and provinces in Southern Italy are dramatically below.[29]
In recent years, Italy's GDP per capita growth slowly caught-up with the Eurozone average[30] while its employment rate still lags behind; however, economists dispute the official figures because of the large number of informal jobs (estimated between 10% and 20% of the labour force) that lift the inactivity or unemployment rates.[31]
History
The economic history of Italy can be divided in three main phases:[32] an initial period of struggle after the unification of the country, characterised by high emigration and stagnant growth; a central period of robust catch-up from the 1890s to the 1980s, interrupted by the Great Depression of the 1930s and the two world wars; and a final period of sluggish growth that has been exacerbated by a double-dip recession following the 2008 global financial crush, and from which the country is slowly reemerging only in recent years.
Age of Industrialization
Prior to unification, the economy of the many Italian statelets was overwhelmingly agrarian; however, the agricultural surplus produced what historians call a "pre-industrial" transformation in North-western Italy starting from the 1820s,[33] that led to a diffuse, if mostly artisanal, concentration of manufacturing activities, especially in Piedmont-Sardinia under the liberal rule of the Count of Cavour.[34]
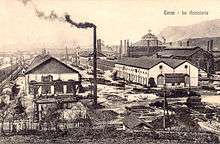
After the birth of the unified Kingdom of Italy in 1861, there was a deep consciousness in the ruling class of the new country's backwardness, given that the per capita GDP expressed in PPS terms was roughly half of that of Britain and about 25% less than that of France and Germany.[32] During the 1860s and 1870s, the manufacturing activity was backward and small-scale, while the oversized agrarian sector was the backbone of the national economy. The country lacked large coal and iron deposits[35] and the population was largely illiterate. In the 1880s, a severe farm crisis led to the introduction of more modern farming techniques in the Po valley,[36] while from 1878 to 1887 protectionist policies were introduced with the aim to establish a heavy industry base.[37] Some large steel and iron works soon clustered around areas of high hydropower potential, notably the Alpine foothills and Umbria in central Italy, while Turin and Milan led a textile, chemical, engineering and banking boom and Genoa captured civil and military shipbuilding.[38]
However, the diffusion of industrialisation that characterised the northwestern area of the country largely excluded Venetia and, especially, the South. The resulting Italian diaspora concerned up to 26 million Italians, the most part in the years between 1880–1914; by many scholars it is considered the biggest mass migration of contemporary times.[39] During the Great War, the still frail Italian state successfully fought a modern war, being able of arming and training some 5 million recruits.[40] But this result came at a terrible cost: by the end of the war, Italy had lost 700,000 soldiers and had a ballooning sovereign debt amounting to billions of lira.
Fascist regime
Italy emerged from World War I in a poor and weakened condition. The National Fascist Party of Benito Mussolini came to power in 1922, at the end of a period of social unrest. However, once Mussolini acquired a firmer hold of power, laissez-faire and free trade were progressively abandoned in favour of government intervention and protectionism.[41]
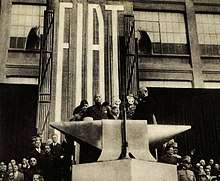
In 1929, Italy was hit hard by the Great Depression.[42] Trying to handle the crisis, the Fascist government nationalized the holdings of large banks which had accrued significant industrial securities, establishing the Istituto per la Ricostruzione Industriale.[43] A number of mixed entities were formed, whose purpose it was to bring together representatives of the government and of the major businesses. These representatives discussed economic policy and manipulated prices and wages so as to satisfy both the wishes of the government and the wishes of business.[41]
This economic model based on a partnership between government and business was soon extended to the political sphere, in what came to be known as corporatism. At the same time, the aggressive foreign policy of Mussolini led to an increasing military expenditure. After the invasion of Ethiopia, Italy intervened to support Franco's nationalists in the Spanish Civil War. By 1939, Italy had the highest percentage of state-owned enterprises after the Soviet Union.[41]
Italy's involvement in World War II as a member of the Axis powers required the establishment of a war economy. The Allied invasion of Italy in 1943 eventually caused the Italian political structure – and the economy – to rapidly collapse. The Allies, on the one hand, and the Germans on the other, took over the administration of the areas of Italy under their control. By the end of the war, Italian per capita income was at its lowest point since the beginning of the 20th century.[44]
Post-war economic miracle
After the end of World War II, Italy was in rubble and occupied by foreign armies, a condition that worsened the chronic development gap towards the more advanced European economies. However, the new geopolitical logic of the Cold War made possible that the former enemy Italy, a hinge-country between Western Europe and the Mediterranean, and now a new, fragile democracy threatened by the NATO occupation forces, the proximity of the Iron Curtain and the presence of a strong Communist party,[46] was considered by the United States as an important ally for the Free World, and received under the Marshall Plan US$1,204 million from 1947-51.
The end of aid through the Plan could have stopped the recovery but it coincided with a crucial point in the Korean War whose demand for metal and manufactured products was a further stimulus of Italian industrial production. In addition, the creation in 1957 of the European Common Market, with Italy as a founding member, provided more investment and eased exports.[47]
These favorable developments, combined with the presence of a large labour force, laid the foundation for spectacular economic growth that lasted almost uninterrupted until the "Hot Autumn's" massive strikes and social unrest of 1969–70, which then combined with the later 1973 oil crisis and put an abrupt end to the prolonged boom. It has been calculated that the Italian economy experienced an average rate of growth of GDP of 5.8% per year between 1951–63, and 5% per year between 1964–73.[47] Italian rates of growth were second only, but very close, to the German rates, in Europe, and among the OEEC countries only Japan had been doing better.[48]
The 1970s and 1980s: from stagflation to "il sorpasso"

The 1970s were a period of economic, political turmoil and social unrest in Italy, known as Years of Lead. Unemployment rose sharply, especially among the young, and by 1977 there were one million unemployed people under age 24. Inflation continued, aggravated by the increases in the price of oil in 1973 and 1979. The budget deficit became permanent and intractable, averaging about 10 percent of the gross domestic product (GDP), higher than any other industrial country. The lira fell steadily, from 560 lira to the U.S. dollar in 1973 to 1,400 lira in 1982.[49]
The economic recession went on into the mid-1980s until a set of reforms led to the independence of the Bank of Italy[50] and a big reduction of the indexation of wages[51] that strongly reduced inflation rates, from 20.6% in 1980 to 4.7% in 1987.[52] The new macroeconomic and political stability resulted in a second, export-led "economic miracle", based on small and medium-sized enterprises, producing clothing, leather products, shoes, furniture, textiles, jewelry, and machine tools. As a result of this rapid expansion, in 1987 Italy overtook the British economy (an event known as il sorpasso), becoming the sixth in the world.[53] The Milan stock exchange increased its market capitalization more than fivefold in the space of a few years.[54]
However, the Italian economy of the 1980s presented a problem: it was booming, thanks to increased productivity and surging exports, but unsustainable fiscal deficits drove the growth.[53] In the 1990s, the new Maastricht criteria boosted the urge to curb the public debt, already at 104% of GDP in 1992.[55] The consequent restrictive economic policies worsened the impact of the global recession already underway. After a brief recover at the end of the 1990s, high tax rates and red tape caused the country to stagnate between 2000 and 2008.[56][57]
Great Recession
Italy was among the countries hit hardest by the Great Recession of 2008-2009 and the subsequent European debt crisis. The national economy shrunk by 6.76% during the whole period, totaling seven-quarters of recession.[58] In November 2011 the Italian bond yield was 6.74 percent for 10-year bonds, nearing a 7 percent level where Italy is thought to lose access to financial markets.[59] According to Eurostat, in 2015 the Italian government debt stood at 128% of GDP, ranking as the second biggest debt ratio after Greece (with 175%).[60] However, the biggest chunk of Italian public debt is owned by Italian nationals [61] and relatively high levels of private savings and low levels of private indebtedness are seen as making it the safest among Europe's struggling economies.[62] As a shock therapy to avoid the debt crisis and kick-start growth, the National unity government led by the famous economist Mario Monti launched a program of massive austerity measures, that have brought down the deficit but precipitated the country in a double-dip recession in 2012 and 2013, receiving widespread criticism from numerous economists.[63][64]
Economic recovery
In spite of a very high public debt and political instability (Italy has had four governments since 2011), the Italian economy since 2014 has returned to growth[65][66][67][68][69] (an event known as la ripresa) and is espected to grow by 1.5% or more[70] in 2017, mainly thanks to a rise in exports and the reform of the banking system.[71] On 6 October 2017 Moody's confirmed Italy's rating to Baa2, reiterating the negative outlook.[72] Standard & Poor's in October 2017 changed Italy's rating from BBB- to BBB, with a stable outlook: it was the first time since 1988 that S&P raised the sovereign rating of Italy.[73] The solidity of the long-term economic recovery is confirmed by Warren Buffett's recent investments.[74]
Overview
Data
The following table shows the main economic indicators in 1980–2017. Inflation under 2 % is in green.[75]
| Year | GDP (in Bil. Euro) |
GDP per capita (in Euro) |
GDP growth (real) |
Inflation rate (in Percent) |
Unemployment (in Percent) |
Government debt (in % of GDP) |
|---|---|---|---|---|---|---|
| 1980 | 213.0 | 3,777 | 7.4 % | n/a | ||
| 1981 | n/a | |||||
| 1982 | n/a | |||||
| 1983 | n/a | |||||
| 1984 | n/a | |||||
| 1985 | n/a | |||||
| 1986 | n/a | |||||
| 1987 | n/a | |||||
| 1988 | 93.0 % | |||||
| 1989 | ||||||
| 1990 | ||||||
| 1991 | ||||||
| 1992 | ||||||
| 1993 | ||||||
| 1994 | ||||||
| 1995 | ||||||
| 1996 | ||||||
| 1997 | ||||||
| 1998 | ||||||
| 1999 | ||||||
| 2000 | ||||||
| 2001 | ||||||
| 2002 | ||||||
| 2003 | ||||||
| 2004 | ||||||
| 2005 | ||||||
| 2006 | ||||||
| 2007 | ||||||
| 2008 | ||||||
| 2009 | ||||||
| 2010 | ||||||
| 2011 | ||||||
| 2012 | ||||||
| 2013 | ||||||
| 2014 | ||||||
| 2015 | ||||||
| 2016 | ||||||
| 2017 |
Companies
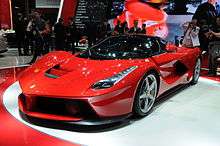
Of the world's 500 largest stock-market-listed companies measured by revenue in 2016, the Fortune Global 500, nine are headquartered in Italy.[78] The country's major companies by sector are:[79] Fiat Chrysler Automobiles, CNH Industrial, Ducati, Piaggio (motor vehicles); Pirelli (tyre manufacturing); Enel, Edison, A2A, Terna (energy); Eni (petrochemicals); Candy, Indesit, De'Longhi (home appliances); Leonardo that has absorbed its subsidiary companies Alenia Aermacchi, AgustaWestland and Oto Melara (defence); Avio, Telespazio (space); Beretta, Benelli (firearms); Armani, Versace, Dolce & Gabbana, Gucci, Benetton, Diesel, Prada, Luxottica, YOOX (fashion); Ferrero, Barilla, Autogrill, Lavazza, Perfetti Van Melle, Campari, Parmalat (food&beverages); Techint, Lucchini, Gruppo Riva, Danieli (steel); Prysmian, Salini Impregilo, Italcementi, Buzzi Unicem, Astaldi (construction); STMicroelectronics (electronics); Telecom Italia, Mediaset (communications); Assicurazioni Generali, Unipol (insurance); UniCredit, Intesa Sanpaolo (banking); Ferrari, Maserati, Lamborghini (luxury vehicles); Fincantieri, Ferretti, Azimut (shipbuilding).
| Rank (World) | Rank (Italy) | Company | Headquarters | Revenue (€bn) | Profit (€bn) | Employees (World) | Main sector |
|---|---|---|---|---|---|---|---|
| 19 | 1 | Fiat | Turin | 152.6 | 0.83 | 225,587 | Automotive |
| 49 | 2 | Generali Group | Trieste | 102.6 | 2.25 | 74,000 | Insurance |
| 65 | 3 | Eni | Rome | 93.0 | 1.33[80] | 80,911 | Petroleum |
| 78 | 4 | Enel | Rome | 83.9 | 2.44 | 62,080 | Electric utility |
| 224 | 5 | Intesa Sanpaolo | Turin | 42.2 | 3.04 | 90,807 | Banking |
| 300 | 6 | UniCredit | Milan | 34.6 | 1.88 | 117,659 | Banking |
| 305 | 7 | Poste italiane | Rome | 34.1 | 0.61 | 142,268 | Postal services |
| 404 | 8 | Telecom Italia | Milan | 26.6 | 0.44[81] | 66,025 | Telecommunications |
| 491 | 9 | Unipol | Bologna | 21.5 | 0.30 | 14,223 | Insurance |
Figures are for 2016. Figures in italic = Q3 2017
Wealth

Italy has over 1.4 million people with a net wealth greater than $1 million, a total national wealth of $11.857 trillion, and represents the 5th largest cumulative net wealth globally (it accounts for 4.92% of the net wealth in the world).[82] According to the Credit Suisse's Global Wealth Databook 2013, the median wealth per adult is $138,653 (5th in the world),[82] while according to the Allianz's Global Wealth Report 2013, the net financial wealth per capita is €45,770 (13th among 52 countries considered).[83]
The following top 10 list of Italian billionaires is based on an annual assessment of wealth and assets compiled and published by Forbes in 2017.[84]
| Rank (World) | Rank (Italy) | Name | Net Worth ($bn) | Main source | Main sector |
|---|---|---|---|---|---|
| 29 | 1 | Maria Franca Fissolo Ferrero & family | 25.2 | Ferrero SpA | Food |
| 50 | 2 | Leonardo Del Vecchio | 17.9 | Luxottica | Eyewear |
| 80 | 3 | Stefano Pessina | 13.9 | Walgreens Boots | Pharmaceutical retail |
| 133 | 4 | Massimiliana Landini Aleotti | 9.5 | Menarini | Pharmaceutical |
| 199 | 5 | Silvio Berlusconi | 7.0 | Fininvest | Financial services |
| 215 | 6 | Giorgio Armani | 6.6 | Armani | Fashion |
| 250 | 7 | Augusto & Giorgio Perfetti | 5.8 | Perfetti Van Melle | Confectionery |
| 385 | 8 | Paolo & Gianfelice Rocca | 3.4 | Techint | Conglomerate |
| 474 | 9 | Giuseppe De' Longhi | 3.8 | De'Longhi | Small appliance |
| 603 | 10 | Patrizio Bertelli | 3.3 | Prada | Apparels |
Regional data
.jpg)
| Rank | Region | GDP €m | % of Nation | € per capita |
|---|---|---|---|---|
| - | 1,645,439 | 100.00 | 27,045 | |
| 1 | 357,200 | 21.71 | 35,885 | |
| 2 | 192,642 | 11.09 | 30,967 | |
| 3 | 151,634 | 9.21 | 30,843 | |
| 4 | 149,525 | 9.08 | 33,558 | |
| 5 | 127,365 | 7.74 | 28,870 | |
| 6 | 110,332 | 6.70 | 29,446 | |
| 7 | 100,544 | 6.11 | 17,187 | |
| 8 | 87,383 | 5.31 | 17,068 | |
| 9 | 72,135 | 4.38 | 17,166 | |
| 10 | 47,663 | 2.90 | 30,438 | |
| 11 | 40,593 | 2.47 | 25,971 | |
| 12 | 40,096 | 2.44 | 37,813 | |
| 13 | 35,669 | 2.17 | 29,147 | |
| 14 | 32,795 | 1.99 | 16,467 | |
| 15 | 32,592 | 1.98 | 24,160 | |
| 16 | 32,481 | 1.97 | 19,306 | |
| 17 | 21,438 | 1.30 | 23,735 | |
| 18 | 11,449 | 0.69 | 19,473 | |
| 19 | 6,042 | 0.36 | 18,891 | |
| 20 | 4,374 | 0.27 | 34,301 |
North–South divide
Since the unification of Italy in 1861, a wide and increasing economic divide has been noticeably growing between the northern provinces and the southern half of the Italian state. In the early decades of the new kingdom, the lack of an effective land reform, heavy taxes and other economic measures imposed on the South, together with the removal of protectionist tariffs on agricultural goods, made the situation virtually impossible for many tenant farmers and land owners. Multitudes chose to emigrate rather than try to eke out a meager living, especially from 1892 to 1921.[87]
In addition, the surge of brigandage and the Mafia provoked widespread violence, corruption and illegality. After the rise of Benito Mussolini, the "Iron Prefect" Cesare Mori tried to defeat the already powerful criminal organizations flourishing in the South with some degree of success. Fascist policy aimed at the creation of an Italian empire and Southern Italian ports were strategic for all commerce towards the colonies. With the invasion of Southern Italy, the Allies restored the authority of the mafia families, lost during the Fascist period, and used their influence to maintain public order.[88]
In the 1950s the Cassa per il Mezzogiorno was set up as a huge public master plan to help industrialize the South, aiming to do this in two ways: through land reforms creating 120,000 new smallholdings, and through the "Growth Pole Strategy" whereby 60% of all government investment would go to the South, thus boosting the Southern economy by attracting new capital, stimulating local firms, and providing employment. However, the objectives were largely missed, and as a result the South became increasingly subsidized and state dependent, incapable of generating private growth itself.[89]
Even at present, huge regional disparities persist. Problems in Southern Italy still include widespread political corruption, pervasive organized crime, and very high unemployment rates.[90] In 2007, it was estimated that about 80% of the businesses in the Sicilian cities of Catania and Palermo paid protection money;[91] thanks to grassroots movement like Addiopizzo, the mafia racket is slowly but constantly losing its verve.[92][93] The Italian Ministry of Interior reported that organized crime generated an estimated annual profit of €13 billion.[94]
Economic sectors
Primary
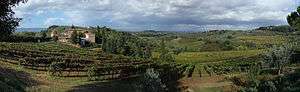
According to the last national agricultural census, there were 1.6 million farms in 2010 (-32.4% since 2000) covering 12.7 million hectares (63% of which are located in Southern Italy).[95] The vast majority (99%) are family-operated and small, averaging only 8 hectares in size.[95] Of the total surface area in agricultural use (forestry excluded), grain fields take up 31%, olive tree orchards 8.2%, vineyards 5.4%, citrus orchards 3.8%, sugar beets 1.7%, and horticulture 2.4%. The remainder is primarily dedicated to pastures (25.9%) and feed grains (11.6%).[95] The northern part of Italy produces primarily maize corn, rice, sugar beets, soybeans, meat, fruits and dairy products, while the South specializes in wheat and citrus fruits. Livestock includes 6 million head of cattle, 8.6 million head of swine, 6.8 million head of sheep, and 0.9 million head of goats.[95] The total annual production of the fishing industry in Italy from capture and aquaculture, including crustaceans and molluscs, is around 480,000 tons.
Italy is the first largest producer of wine in the world, and one of the leading in olive oil, fruits (apples, olives, grapes, oranges, lemons, pears, apricots, hazelnuts, peaches, cherries, plums, strawberries and kiwifruits), and vegetables (especially artichokes and tomatoes). The most famous Italian wines are probably the Tuscan Chianti and the Piedmontese Barolo. Other famous wines are Barbaresco, Barbera d'Asti, Brunello di Montalcino, Frascati, Montepulciano d'Abruzzo, Morellino di Scansano, and the sparkling wines Franciacorta and Prosecco. Quality goods in which Italy specialises, particularly the already mentioned wines and regional cheeses, are often protected under the quality assurance labels DOC/DOP. This geographical indication certificate, which is attributed by the European Union, is considered important in order to avoid confusion with low-quality mass-produced ersatz products.
Secondary
Italy has a smaller number of global multinational corporations than other economies of comparable size, but there is a large number of small and medium-sized enterprises, many of them grouped in clusters, which are the backbone of the Italian industry.[96] This has produced a manufacturing sector often focused on the export of niche market and luxury products, that on one side is less capable of competing on quantity, but on the other side is more capable of facing the competition from emerging economies based on lower labor costs, with higher quality products.[97] The industrial districts are regionalized: in the Northwest there is a large modern group of industries, as in the so-called "Industrial Triangle" (Milan-Turin-Genoa), where there is an area of intense machinery, automotive, aerospace and naval production; in the Northeast and the Center, previously rural areas that experienced social and economic development around family-based firms, there are small enterprises of low technology but high craftsmanship, specialized in clothing, leather products, footwear, furniture, textiles, machine tools, spare parts, appliances, and jewellery; finally, in the less-developed South, the two forms exist side by side.[96][98]
Tertiary
The origins of modern banking can be traced to medieval and early Renaissance Italy, to the rich cities like Florence, Lucca, Siena, Venice and Genoa. The Bardi and Peruzzi families dominated banking in 14th-century Florence, establishing branches in many other parts of Europe.[99] One of the most famous Italian banks was the Medici Bank, set up by Giovanni di Bicci de' Medici in 1397.[100] The earliest known state deposit bank, the Bank of Saint George, was founded in 1407 in Genoa,[101] while Banca Monte dei Paschi di Siena, founded in 1472, is the oldest surviving bank in the world. Today, among the financial services companies, UniCredit is one of the largest bank in Europe by capitalization and Assicurazioni Generali is second largest insurance group in the world by revenue after AXA.
The following is a list of the main Italian banks and insurance groups ranked by total assets and gross premiums written.
- As of 31 December 2013
|
|
Infrastructure
Energy and natural resources
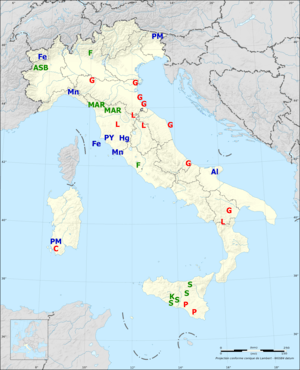
In the early 1970s Italy was a major producer of pyrites (from the Tuscan Maremma), asbestos (from the Balangero mines), fluorite (found in Sicily), and salt. At the same time, it was self-sufficient in aluminum (from Gargano), sulphur (from Sicily), lead, and zinc (from Sardinia).[102] By the beginning of the 1990s, however, it had lost all its world-ranking positions and was no longer self-sufficient in those resources. There are no substantial deposits of iron, coal, or oil. Moderate natural gas reserves, mainly in the Po Valley and offshore Adriatic Sea, have been discovered in recent years and constitute the country's most important mineral resource. Italy is one of the world's leading producers of pumice, pozzolana, and feldspar.[102] Another mineral resource for which Italy is well-known is marble, especially the world-famous white Carrara marble from the Massa and Carrara quarries in Tuscany. Most raw materials needed for manufacturing and more than 80% of the country's energy sources are imported (99.7% of the solid fuels demand, 92.5% of oil, 91.2% of natural gas and 13% of electricity).[103][104] Due to its reliance on imports, Italians pay approximately 45% more than the EU average for electricity.[105]
Italy has managed four nuclear reactors until the 1980s, but in 1987, after the Chernobyl disaster, a large majority of Italians passed a referendum opting for phasing out nuclear power in Italy. The government responded by closing existing nuclear power plants and stopping work on projects underway, continuing to work to the nuclear energy program abroad. The national power company Enel operates seven nuclear reactors in Spain (through Endesa) and four in Slovakia (through Slovenské elektrárne),[106] and in 2005 made an agreement with Électricité de France for a nuclear reactor in France.[105] With these agreements, Italy has managed to access nuclear power and direct involvement in design, construction, and operation of the plants without placing reactors on Italian territory.[105]
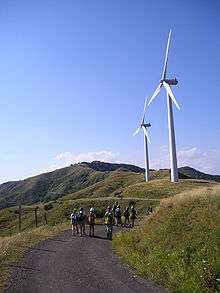
In the last decade, Italy has become one of the world's largest producers of renewable energy, ranking as the second largest producer in the European Union after Germany and the ninth in the world. The country is also the world's fifth largest producer of energy from solar power. Renewable sources account for the 27.5% of all electricity produced in Italy, with hydro alone reaching 12.6%, followed by solar at 5.7%, wind at 4.1%, bioenergy at 3.5%, and geothermal at 1.6%.[107] The rest of the national demand is covered by fossil fuels (38.2% natural gas, 13% coal, 8.4% oil) and by imports.[107]
Transport

Italy was the first country in the world to build motorways, the so-called "autostrade", reserved for motor vehicles. The Milano-Laghi motorway, connecting Milan to Varese and now parts of the A8 and A9 motorways, was devised by Piero Puricelli, a civil engineer and entrepreneur. He received the first authorization to build a public-utility fast road in 1921, and completed the construction between 1924 and 1926. By the end of the 1930s, over 400 kilometers of multi- and dual-single-lane motorways were constructed throughout Italy, linking cities and rural towns. Today there are 668,721 km of serviceable roads in Italy, including 6,661 km of motorways (mostly toll roads, national and local roads), state-owned but privately operated mainly by Atlantia company.
The railway network is also extensive, especially in the north, totalizing 16,862 km of which 69% are electrified and on which 4,937 locomotives and railcars circulate. It is the 12th largest in the world, and is operated by state-owned Ferrovie dello Stato, while the rail tracks and infrastructure are managed by Rete Ferroviaria Italiana. While a number of private railroads exist and provide mostly commuter-type services, the national railway also provides sophisticated high-speed rail service that joins the major cities. The Florence–Rome high-speed railway was the first high-speed line opened in Europe when more than half of it opened in 1977. In 1991 the TAV was created for the planning and construction of high-speed rail lines along Italy's most important and saturated transport routes (Milan-Rome-Naples and Turin-Milan-Venice). High-speed trains include ETR-class trains, with the Frecciarossa 1000 reaching 400 km/h.
There are approximately 130 airports in Italy, of which 99 have paved runways (including the two hubs of Leonardo Da Vinci International in Rome and Malpensa International in Milan), and 43 major seaports including the Port of Genoa, the country's largest and the third busiest by cargo tonnage in the Mediterranean Sea. The national inland waterway network comprises 1,477 km of navigable rivers and channels. In 2007 Italy maintained a civilian air fleet of about 389,000 units and a merchant fleet of 581 ships.[108]
Poverty
In 2015, poverty in Italy hit the high levels in the previous 10 years. The level of absolute poverty for a 2 people family was €1050.95/month. The poverty line per capita changed by region from €552.39/month to €819.13/month.The numbers of those in absolute poverty rose nearly an entire percent in 2015, from 6.8% in 2014, to 7.6% in 2015.[109] In the south of Italy the numbers are even higher with 10% living in absolute poverty, up from 9 percent in 2014. The north is better off at 6.7%, but still an increase from 5.7% in 2014.[109] The national statics reporting agency, ISTAT, defines absolute poverty as those who can’t buy goods and services which they need to survive. In 2015, the proportion of poor households in relative poverty also increased in 2015 to 13.7 from 12.9 in 2014. ISTAT defines relative poverty as people whose disposable income is less than around half the national average. The unemployment rate in February 2016 remained at 11.7%, which has been the same for almost a year, but even having a job doesn’t guarantee freedom from poverty.[110] Those who have at least one family employed still suffer from 6.1% to 11.7% poverty, the higher number being for those who have factory jobs. The numbers are even higher for the younger generations because their unemployment rate is over 40%. Also, children are hit hard. In 2014, 32% of those aged 0–17 are at risk of poverty or social exclusion, which is one child out of three. In the last ISTAT report poverty is in decline.[111]
References
- 1 2 3 4 "Report for Selected Countries and Subjects – Italy". International Monetary Fund. April 2018.
- ↑ https://www.imf.org/external/pubs/ft/weo/2018/01/weodata/weorept.aspx?sy=2016&ey=2023&scsm=1&ssd=1&sort=country&ds=.&br=1&pr1.x=57&pr1.y=3&c=136&s=NGDPD%2CNGDPDPC%2CPPPPC&grp=0&a=
- 1 2 http://www.istat.it/it/archivio/209843
- ↑ https://www.istat.it/it/archivio/inflazione
- ↑ http://www.ansa.it/sito/notizie/economia/2016/03/14/poverta-istat-in-2014-assoluta-per-147-mln-famiglie_5faaef89-d222-41dd-a04f-6f43459dbc0a.html. Missing or empty
|title=(help) - ↑ "People at risk of poverty or social exclusion - Eurostat". Eurostat. December 2015. Retrieved 14 March 2016.
- ↑ "Gini coefficient of equivalised disposable income (source: SILC)". Luxembourg: Eurostat. 15 June 2017. Retrieved 24 June 2017.
- ↑ https://www.istat.it/en/
- ↑ https://stats.oecd.org/Index.aspx?DataSetCode=AV_AN_WAGE
- ↑ http://www.stamptoscana.it/articolo/economia/reddito-pro-capite-firenze-ai-primi-posti-su-scala-nazionale
- ↑ "Ease of Doing Business in Italy". Doingbusiness.org. Retrieved 2017-11-21.
- ↑ https://www.cia.gov/library/publications/the-world-factbook/rankorder/2078rank.html#it
- ↑ https://www.cia.gov/library/publications/the-world-factbook/rankorder/2087rank.html#it
- ↑ "Euromoney Institutional Investor Company". Retrieved 2017-09-30.
- ↑ "Development aid rises again in 2016 but flows to poorest countries dip". OECD. 2017-04-11. Retrieved 2017-09-25.
- ↑ "Sovereigns Rating List". Standard & Poor's. Retrieved 26 May 2011.
- ↑ Bufacchi, Isabella (16 October 2014). "Moody's confirms stable outlook on Italy's "Baa2" sovereign rating". Il Sole 24 Ore. Retrieved 8 February 2015.
- ↑ "Fitch Affirms Italy at 'BBB+'; Outlook Stable". Reuters. Retrieved 24 October 2014.
- ↑ https://www.imf.org/external/pubs/ft/weo/2017/02/weodata/weorept.aspx?pr.x=37&pr.y=12&sy=2015&ey=2022&scsm=1&ssd=1&sort=country&ds=.&br=1&c=136&s=NGDPD%2CPPPGDP%2CNGDPDPC%2CPPPPC&grp=0&a=
- ↑ "CIA World Factbook: Italy". CIA. Retrieved 8 February 2015.
- ↑ https://www.imf.org/external/pubs/ft/weo/2017/02/weodata/weoselgr.aspx
- ↑ "The Economist Intelligence Unit's quality-of-life index" (PDF). The Economist. Retrieved 8 February 2015.
- ↑ Stringa, Giovanni (5 January 2013). "Italia terza al mondo per riserve d'oro, per ogni cittadino dote di 1.650 euro". Corriere della Sera. Retrieved 6 February 2015.
- ↑ "Quel bilancio Ue poco equilibrato". Il Sole 24 Ore. 1 February 2013. Retrieved 8 February 2015.
- ↑ "Manufacturing statistics". Eurostat. November 2015. Retrieved 8 February 2015.
- 1 2 Woodard, Richard (19 March 2013). "Italian wine now 22% of global market". Decanter. Retrieved 8 February 2015.
- ↑
- ↑ Italy remains the third market for luxury goods
- ↑ "Convergence between Eu countries and a gap at the territorial level between Italian regions". ISTAT. 19 October 2011. Archived from the original on 9 February 2015. Retrieved 8 February 2015.
- ↑
- ↑
- 1 2 Toniolo, edited by Gianni (2013). The Oxford handbook of the Italian economy since unification. New York, NY: Oxford University Press. ISBN 9780199936694.
- ↑ Riall, Lucy (1999). The Italian risorgimento : state, society, and national unification (Repr. ed.). London [u.a.]: Routledge. p. 53. ISBN 978-0415057752.
- ↑ Killinger, Charles L. (2002). The history of Italy ([Online-Ausg.] ed.). Westport, Conn. [u.a.]: Greenwood Press. p. 112. ISBN 978-0313314834.
- ↑ Hildebrand, George Herbert (1965). Growth and Structure in the Economy of Modern Italy. Cambridge, Massachusetts: Harvard University Press. pp. 307–309.
|access-date=requires|url=(help) - ↑ Zamagni, Vera (1993). The economic history of Italy, 1860-1990 : from the periphery to the centre (Repr. ed.). [New York]: Clarendon Press. p. 64. ISBN 978-0198287735.
- ↑ Kemp, Tom (1985). Industrialization in nineteenth-century Europe (2nd ed.). London: Longman. ISBN 978-0582493841.
- ↑ Ciccarelli, Carlo; Fenoaltea, Stefano (July 2010). "Through the Magnifying Glass: Provincial Aspects of Industrial Growth in Post-Unification Italy" (PDF). Banca d'Italia. p. 4.
- ↑ Cohen, Robin (1995). The Cambridge Survey of World Migration. Cambridge: Cambridge University Press. p. 114. ISBN 0-521-44405-5. Retrieved 8 February 2015.
- ↑ Clark, Martin (1984). Modern Italy, 1871-1982. New York: Longman. p. 186. ISBN 0-582-48361-1. Retrieved 8 February 2015.
- 1 2 3 Knight, Patricia (2003). Mussolini and Fascism. New York: Routledge. pp. 64–65. ISBN 0-415-27921-6. Retrieved 8 February 2015.
- ↑ Welk, William G. (1938). Fascist Economy Policy: An Analysis of Italy's Economic Experiment. Cambridge: Harvard University Press. p. 166. Retrieved 8 February 2015.
- ↑ Morgan, Philip (2003). Italian Fascism, 1915-1945. Basingstoke: Macmillan Publishers. p. 160. ISBN 0-333-94998-6. Retrieved 8 February 2015.
- ↑ Lyttelton, Adrian (2002). Liberal and Fascist Italy, 1900-1945. Oxford: Oxford University Press. p. 13. ISBN 0-198-73198-1. Retrieved 8 February 2015.
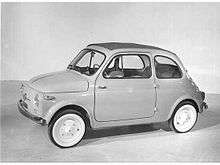
- ↑ Tagliabue, John (11 August 2007). "Italian Pride Is Revived in a Tiny Fiat". The New York Times. Retrieved 8 February 2015.
- ↑ Hogan, Michael J. (1987). The Marshall Plan: America, Britain, and the reconstruction of Western Europe, 1947–1952. Cambridge: Cambridge University Press. pp. 44–45. ISBN 0-521-37840-0.
- 1 2 Crafts, Nicholas; Toniolo, Gianni (1996). Economic Growth in Europe Since 1945. Cambridge: Cambridge University Press. p. 428. ISBN 0-521-49627-6.
- ↑ Di Nolfo, Ennio (1992). Power in Europe? Great Britain, France, Germany, and Italy, and the Origins of the EEC, 1952–57. Berlin: Walter de Gruyter. p. 198. ISBN 3-11-012158-1.
- ↑ "Italy since 1945: Demographic and social change". Encyclopædia Britannica Online. Retrieved 8 February 2015.
- ↑ Vicarelli, Fausto; Sylla, Richard; Cairncross, Alec (1988). Central banks' independence in historical perspective. Berlin: Walter de Gruyter. p. 180. ISBN 978-3110114409.
- ↑ "Italy since 1945: The economy in the 1980s". Encyclopædia Britannica Online. Retrieved 8 February 2015.
- ↑ "L'Italia in 150 anni. Sommario di statistiche storiche 1861-2010". ISTAT. Archived from the original on 9 February 2015. Retrieved 8 February 2015.
- 1 2 Vietor, Richard (1 April 2001). "Italy's Economic Half-Miracle". Strategy&. Retrieved 8 October 2014.
- ↑ "Italian Stock Exchange: Main Indicators (1975-2012)". Borsa Italiana. Retrieved 8 February 2015.
- ↑ "Italy: General government gross debt (Percent of GDP)". International Monetary Fund. Retrieved 8 October 2014.
- ↑ Balcerowicz, Leszek (2013). Economic Growth in the European Union (PDF). Brussels: Lisbon Council. p. 13. ISBN 978-9-0902-7915-2. Retrieved 8 October 2014.
- ↑ ""Secular stagnation" in graphics". The Economist. 19 November 2014. Retrieved 8 February 2015.
- ↑ "Quarterly Growth Rates of real GDP, change over previous quarter". OECD. Retrieved 8 February 2015.
- ↑ Moody, Barry; Mackenzie, James (8 November 2011). "Berlusconi to resign after parliamentary setback". Reuters. Retrieved 8 February 2015.
- ↑ "General government gross debt". Eurostat. Retrieved 8 February 2015.
- ↑ Auret, Lisa (18 May 2010). "Could Italy Be Better Off than its Peers?". CNBC. Archived from the original on 30 April 2011. Retrieved 30 May 2011.
- ↑ Sanderson, Rachel (10 January 2011). "Italian deficit narrows in third quarter". Financial Times. Retrieved 16 July 2011.
- ↑ Krugman, Paul (24 February 2013). "Austerity, Italian-Style". The New York Times. Retrieved 26 November 2017.
- ↑ Orsi, Roberto. "The Demise of Italy and the Rise of Chaos". London School of Economics. Retrieved 26 November 2017.
- ↑ http://www.corriere.it/economia/16_settembre_23/pil-l-istat-rivede-crescita-2015-l-incremento-scende-08-07percento-66322ccc-8164-11e6-bb54-ccc86a7805dc.shtml
- ↑ "Real GDP growth rate - volume". Eurostat. Retrieved 26 November 2017.
- ↑ "Il clima di fiducia fattore chiave per la ripresa". ilsole24ore.com. Retrieved 7 October 2017.
- ↑ http://www.ilsole24ore.com/art/notizie/2017-06-01/pil-l-istat-rivede-rialzo-crescita-i-trimestre-04percento-12percento-anno--100105.shtml?uuid=AEJ7kyWB
- ↑ "Piazza Affari verso il record del decennio per numero di Ipo". ilsole24ore.com. Retrieved 7 October 2017.
- ↑ http://www.repubblica.it/economia/2017/11/21/news/istat_pil_2017-181687790/
- ↑ "Why Italy's troubled economy is returning to form". The Economist. 13 September 2017. Retrieved 26 November 2017.
- ↑ "Moody's changes outlook on Italy's Baa2 issuer rating to negative; affirms rating". www.moodys.com. www.moodys.com. Retrieved 7 October 2017.
- ↑ http://www.ilpost.it/2017/10/28/rating-italia-sp/
- ↑ "Warren Buffett sbarca in Italia e compra il 9% di Cattolica". ilsole24ore.co,. ilsole24ore.com. Retrieved 7 October 2017.
- ↑ "Report for Selected Countries and Subjects". www.imf.org. Retrieved 2018-09-10.
- ↑ Haigh, Robert (18 February 2014). "Ferrari – The World's Most Powerful Brand". Brand Finance. Retrieved 9 February 2015.
- ↑ https://data.oecd.org/lprdty/gdp-per-hour-worked.htm#indicator-chart
- ↑ Mehta, Stephanie (2016). "2016 Fortune Global 500". Fortune. Retrieved 26 November 2017.
- 1 2 3 "Leading Italian Companies". Mediobanca. October 2014. Retrieved 9 February 2015.
- ↑ "Results for the third quarter and the nine months of 2017". Eni. Retrieved 26 November 2017.
- ↑ "Telecom Italia Q3 Profit Declines". Business Insider. Retrieved 26 November 2017.
- 1 2 "Global Wealth Databook 2013" (PDF). Credit Suisse. October 2013. Archived from the original (PDF) on 9 February 2015. Retrieved 9 February 2015.
- ↑ "Global Wealth Report 2013" (PDF). Allianz. August 2013. Retrieved 9 February 2015.
- ↑ "The World's Billionaires, 2017 Rankings". Forbes. 2017. Retrieved 26 November 2017.
- ↑ "Gross domestic product (GDP) at current market prices by NUTS 2 regions". Retrieved 15 November 2017.
- ↑ "Regional accounts: per capita values". Istituto Nazionale di Statistica. Retrieved 24 November 2017.
- ↑ Smith, Dennis M. (1997). Modern Italy: A Political History. Ann Arbor: University of Michigan Press. pp. 209–210. ISBN 978-0-472-10895-4.
- ↑ Newark, Tim (2007). Mafia Allies: The True Story of America's Secret Alliance with the Mob in World War II. London: MBI Publishing Company. pp. 123–135. ISBN 978-0-7603-2457-8.
- ↑ "Italy: The South". Encyclopædia Britannica Online. 3 February 2015. Retrieved 9 February 2015.
- ↑ Astarita, Tommaso (2005). Between Salt Water and Holy Water: A History of Southern Italy. New York: W. W. Norton & Company. ISBN 0-393-05864-6.
- ↑ Kiefer, Peter (22 October 2007). "Mafia crime is 7% of GDP in Italy, group reports". The New York Times. Retrieved 9 February 2015.
- ↑ Addiopizzo (30 October 2014). "Report on the activity of "Addiopizzo Catania"" (PDF). European Parliament. Retrieved 9 February 2015.
- ↑ Kington, Tom (9 March 2008). "Shopkeepers revolt against Sicilian Mafia". The Guardian. Retrieved 9 February 2015.
- ↑ "Gli investimenti delle mafie" (PDF). Programma Operativo Nazionale. Obiettivo Sud. 16 January 2013. Archived from the original (PDF) on 14 February 2015. Retrieved 9 February 2015.
- 1 2 3 4 "Censimento Agricoltura 2010". ISTAT. 24 October 2010. Retrieved 11 February 2015.
- 1 2 Mignone, Mario B. (2008). Italy today: Facing the Challenges of the New Millennium. New York: Lang Publishing. pp. 161–162. ISBN 978-1-4331-0187-8.
- ↑ "Knowledge Economy Forum 2008: Innovative Small And Medium Enterprises Are Key To Europe & Central Asian Growth". World Bank. 19 May 2005. Retrieved 17 June 2008.
- ↑ Friedman, Jonathan (2003). Globalization, the State, and Violence. Lanham: Rowman & Littlefield. p. 97. ISBN 0-7591-0280-5.
- ↑ Hoggson, Noble F. (1926). Banking Through the Ages. New York: Dodd, Mead and Company. p. 76. Retrieved 11 February 2015.
- ↑ Goldthwaite, Richard A. (1995). Banks, Palaces, and Entrepreneurs in Renaissance Florence. Aldershot: Ashgate Publishing. ISBN 978-0-860-78484-5. Retrieved 11 February 2015.
- ↑ Macesich, George (2000). Issues in Money and Banking. Westport: Greenwood Publishing Group. p. 42. ISBN 978-0-275-96777-2. Retrieved 12 March 2009.
- 1 2 "Italy, the economy: Resources and power". Encyclopædia Britannica Online. 3 February 2015. Retrieved 9 February 2015.
- ↑ Eurostat (2008). "Energy, transport and environment indicators" (PDF). EU Bookshop. ISBN 978-92-79-09835-2. Retrieved 10 May 2009.
- ↑ Eurostat (2009). "Panorama of Energy" (PDF). EU Bookshop. ISBN 978-92-79-11151-8. Retrieved 10 May 2009.
- 1 2 3 "Emerging Nuclear Energy Countries". World Nuclear Association. December 2014. Retrieved 11 February 2015.
- ↑ "Nuclear Production". Enel. 31 December 2013. Archived from the original on 7 February 2015. Retrieved 11 February 2015.
- 1 2 "Rapporto Statistico sugli Impianti a fonti rinnovabili". Gestore dei Servizi Energetici. 19 December 2013. Archived from the original (PDF) on 18 October 2017. Retrieved 11 February 2015.
- ↑ Eurostat (2007). "Panorama of Transport" (PDF). European Commission. ISBN 978-92-79-04618-6. Retrieved 3 May 2009.
- 1 2 "Poverty in Italy" (PDF). National Institute of Statistics. Retrieved 1 December 2016.
- ↑ "Unemployment by sex and age - monthly average". eurostat.ec. eurostat. Retrieved 2 December 2016.
- ↑ "Italy: tackling child poverty and overcoming the crisis - European Platform for Investing in Children (EPIC) - European Union". europa.eu. Europa. Retrieved 2 December 2016.
External links
| Wikimedia Commons has media related to Economy of Italy. |
- Italian National Institute of Statistic (ISTAT)
- Italy - OECD
- Italy profile at The World Bank
- The leading international footwear exhibition (MICAM)
| Industry and business | |
|---|---|
| Research | |
| Energy | |
| Infrastructure | |
| Taxation | |
| Finance and banking | |
| Development | |
| Events |
|
| |
| ||||||||||||||||||||||||||||||||

,_2013_and_2014.png)