Geography
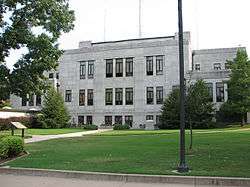
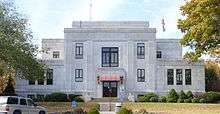
View of the Newton County Courthouse
According to the U.S. Census Bureau, the county has a total area of 627 square miles (1,620 km2), of which 625 square miles (1,620 km2) is land and 1.8 square miles (4.7 km2) (0.3%) is water.[4]
Lakes
Total lake area: 2,573 acres (10.4 km2)
- Newtonia Lake
- Thurman Lake
Rivers & creeks
Total river area: 361 acres (1.5 km2); length: 70 miles (110 km)
- Baynham Branch
- Buffalo Creek
- Center Creek
- Clear Creek
- Dry Valley Branch
|
- Elm Spring Creek
- Five Mile Creek
- Harrison Creek
- Hickory Creek
- Clear Creek
|
- Indian Creek
- Shoal Creek
- Jacobs Creek
- Lost Creek
- Mason Spring Creek
|
- Middle Creek
- Rock Creek
- Silver Creek
- Warren Creek
- Willow Creek
|
Demographics
| Historical population |
| Census | Pop. | | %± |
| 1840 | 8,790 | | — |
| 1850 | 4,268 | | −51.4% |
| 1860 | 9,319 | | 118.3% |
| 1870 | 12,821 | | 37.6% |
| 1880 | 18,947 | | 47.8% |
| 1890 | 22,108 | | 16.7% |
| 1900 | 27,001 | | 22.1% |
| 1910 | 27,136 | | 0.5% |
| 1920 | 24,886 | | −8.3% |
| 1930 | 26,959 | | 8.3% |
| 1940 | 29,039 | | 7.7% |
| 1950 | 28,240 | | −2.8% |
| 1960 | 30,093 | | 6.6% |
| 1970 | 32,901 | | 9.3% |
| 1980 | 40,555 | | 23.3% |
| 1990 | 44,445 | | 9.6% |
| 2000 | 52,636 | | 18.4% |
| 2010 | 58,114 | | 10.4% |
| Est. 2017 | 58,290 | [5] | 0.3% |
U.S. Decennial Census[6]
1790-1960[7] 1900-1990[8]
1990-2000[9] 2010-2015[1] |
As of the census of 2000, there were 52,636 people, 20,140 households, and 14,742 families residing in the county. The population density was 84 people per square mile (33.75/km²). There were 21,897 housing units at an average density of 35 per square mile (14/km²). The racial makeup of the county was 93.26% White, 0.59% Black or African American, 2.23% Native American, 0.32% Asian, 0.28% Pacific Islander, 1.12% from other races, and 2.20% from two or more races. 2.18% of the population were Hispanic or Latino of any race.
There were 20,140 households out of which 33.10% had children under the age of 18 living with them, 60.50% were married couples living together, 8.80% had a female householder with no husband present, and 26.80% were non-families. 22.70% of all households were made up of individuals and 9.70% had someone living alone who was 65 years of age or older. The average household size was 2.57 and the average family size was 3.00.
In the county, the population was spread out with 26.30% under the age of 18, 8.70% from 18 to 24, 27.10% from 25 to 44, 23.80% from 45 to 64, and 14.00% who were 65 years of age or older. The median age was 37 years. For every 100 females, there were 95.60 males. For every 100 females age 18 and over, there were 92.30 males.
The median income for a household in the county was $35,041, and the median income for a family was $40,616. Males had a median income of $30,057 versus $21,380 for females. The per capita income for the county was $17,502. About 8.10% of families and 11.60% of the population were below the poverty line, including 14.20% of those under age 18 and 9.50% of those age 65 or over.
Education
Public schools
- East Newton County R-VI School District – Granby
- Granby Elementary School (K–04)
- Triway Elementary School (K–04) – Stella
- Granby Junior High School (05–08)
- Triway Junior High School (05–08)
- East Newton County High School (09–12)
- Diamond R-IV School District – Diamond
- Diamond Elementary School (PK–04)
- Diamond Middle School (05–08)
- Diamond High School (09–12)
- Neosho R-V School District – Neosho
- Field Early Childhood Center (PK)
- Benton Elementary School (K–04)
- Central Elementary School (K–04)
- George Washington Carver Elementary School (K–04)
- Goodman Elementary School (K–04)
- South Elementary School (K–04)
- Westview Elementary School (K–07)
- Neosho Middle School (05–07)
- Neosho Junior High School (08)
- Neosho High School (09–12)
- Seneca R-VII School District – Seneca
- Seneca Elementary School (PK–05)
- Iva E. Wells Middle School (06–08)
- Seneca High School (09–12)
Public libraries
- Neosho/Newton County Library[10]
Politics
Local
The Republican Party completely controls politics at the local level in Newton County. Republicans hold every elected position in the county.
State
Past Gubernatorial Elections Results
| Year |
Republican |
Democratic |
Third Parties |
| 2016 |
71.92% 19,123 |
24.85% 6,607 |
3.23% 860 |
| 2012 |
57.88% 14,483 |
39.48% 9,880 |
2.64% 661 |
| 2008 |
61.85% 15,570 |
36.29% 9,134 |
1.86% 468 |
| 2004 |
75.23% 17,935 |
23.75% 5,662 |
1.02% 242 |
| 2000 |
66.05% 13,917 |
32.18% 6,780 |
1.77% 373 |
| 1996 |
58.15% 10,445 |
39.60% 7,114 |
2.25% 404 |
Newton County is divided into four districts in the Missouri House of Representatives, all of which are held by Republicans.
- District 159 — Bill Lant (R-Pineville) Consists of the communities of Fairview, Newtonia, Racine, Ritchey, Seneca, Stark City, and Stella.
Missouri House of Representatives — District 159 — Newton County (2016)
| Party |
Candidate |
Votes |
% |
± |
|
Republican |
Bill Lant |
5,209 |
100.00% |
|
Missouri House of Representatives — District 159 — Newton County (2014)
| Party |
Candidate |
Votes |
% |
± |
|
Republican |
Bill Lant |
2,362 |
100.00% |
|
Missouri House of Representatives — District 159 — Newton County (2012)
| Party |
Candidate |
Votes |
% |
± |
|
Republican |
Bill Lant |
4,719 |
100.00% |
|
- District 160 — Bill Reiboldt (R-Neosho). Consists of the communities of Diamond, Granby, Loma Linda, Neosho, Wentworth, and part of Silver Creek.
Missouri House of Representatives — District 160 — Newton County (2016)
| Party |
Candidate |
Votes |
% |
± |
|
Republican |
Bill Reiboldt |
15,228 |
100.00% |
|
Missouri House of Representatives — District 161 — Newton County (2014)
| Party |
Candidate |
Votes |
% |
± |
|
Republican |
Bill Reiboldt |
7,434 |
100.00% |
|
Missouri House of Representatives — District 161 — Newton County (2012)
| Party |
Candidate |
Votes |
% |
± |
|
Republican |
Bill Reiboldt |
14,061 |
100.00% |
|
- District 161 — Bill White (R-Joplin). Consists of the communities of Leawood, Redings Mill, and parts of Joplin and Silver Creek.
Missouri House of Representatives — District 161 — Newton County (2016)
| Party |
Candidate |
Votes |
% |
± |
|
Republican |
Bill White |
3,339 |
100.00% |
+23.10 |
Missouri House of Representatives — District 161 — Newton County (2014)
| Party |
Candidate |
Votes |
% |
± |
|
Republican |
Bill White |
1,501 |
76.90% |
-23.10 |
|
Democratic |
Charles Shields |
451 |
23.10% |
+23.10 |
Missouri House of Representatives — District 161 — Newton County (2012)
| Party |
Candidate |
Votes |
% |
± |
|
Republican |
Bill White |
3,326 |
100.00% |
|
Missouri House of Representatives — District 162 — Newton County (2016)
| Party |
Candidate |
Votes |
% |
± |
|
Republican |
Charlie Davis |
27 |
100.00% |
|
Missouri House of Representatives — District 162 — Newton County (2014)
| Party |
Candidate |
Votes |
% |
± |
|
Republican |
Charlie Davis |
5 |
100.00% |
|
Missouri House of Representatives — District 162 — Newton County (2012)
| Party |
Candidate |
Votes |
% |
± |
|
Republican |
Charlie Davis |
24 |
100.00% |
|
All of Newton County is a part of Missouri’s 32nd District in the Missouri Senate and is represented by Ron Richard (R-Joplin).
Missouri Senate — District 32 — Newton County (2014)
| Party |
Candidate |
Votes |
% |
± |
|
Republican |
Ron Richard |
11,397 |
100.00% |
|
Federal
U.S. Senate — Missouri — Newton County (2016)
| Party |
Candidate |
Votes |
% |
± |
|
Republican |
Roy Blunt |
18,598 |
69.89% |
+11.31 |
|
Democratic |
Jason Kander |
6,691 |
25.14% |
-10.76 |
|
Libertarian |
Jonathan Dine |
573 |
2.15% |
-3.37 |
|
Green |
Johnathan McFarland |
295 |
1.11% |
+1.11 |
|
Constitution |
Fred Ryman |
454 |
1.71% |
+1.71 |
U.S. Senate — Missouri — Newton County (2012)
| Party |
Candidate |
Votes |
% |
± |
|
Republican |
Todd Akin |
14,574 |
58.58% |
|
|
Democratic |
Claire McCaskill |
8,933 |
35.90% |
|
|
Libertarian |
Jonathan Dine |
1,374 |
5.52% |
|
All of Newton County is included in Missouri's 7th Congressional District and is represented by Billy Long (R-Springfield) in the U.S. House of Representatives.
U.S. House of Representatives — Missouri's 7th Congressional District — Newton County (2016)
| Party |
Candidate |
Votes |
% |
± |
|
Republican |
Billy Long |
19,497 |
74.15% |
+0.14 |
|
Democratic |
Genevieve Williams |
5,790 |
22.02% |
+0.67 |
|
Libertarian |
Benjamin T. Brixey |
1,008 |
3.83% |
-0.77 |
U.S. House of Representatives — Missouri's 7th Congressional District — Newton County (2014)
| Party |
Candidate |
Votes |
% |
± |
|
Republican |
Billy Long |
9,646 |
74.01% |
+2.87 |
|
Democratic |
Jim Evans |
2,782 |
21.35% |
-3.75 |
|
Libertarian |
Kevin Craig |
600 |
4.60% |
+0.84 |
|
Write-in |
Write-ins |
5 |
0.04% |
+0.04 |
U.S. House of Representatives — Missouri's 7th Congressional District — Newton County (2012)
| Party |
Candidate |
Votes |
% |
± |
|
Republican |
Billy Long |
17,499 |
71.14% |
|
|
Democratic |
Jim Evans |
6,174 |
25.10% |
|
|
Libertarian |
Kevin Craig |
924 |
3.76% |
|
Presidential elections results
Presidential elections results[11]
| Year |
Republican |
Democratic |
Third parties |
| 2016 |
76.7% 20,553 |
18.6% 4,990 |
4.7% 1,264 |
| 2012 |
72.2% 18,181 |
25.5% 6,425 |
2.3% 587 |
| 2008 |
69.4% 17,637 |
29.3% 7,450 |
1.3% 319 |
| 2004 |
72.0% 17,187 |
27.5% 6,564 |
0.6% 138 |
| 2000 |
67.3% 14,232 |
30.5% 6,447 |
2.3% 483 |
| 1996 |
55.7% 10,067 |
32.3% 5,840 |
12.0% 2,178 |
| 1992 |
47.6% 8,804 |
32.4% 5,987 |
20.0% 3,688 |
| 1988 |
64.4% 10,617 |
35.2% 5,798 |
0.5% 82 |
| 1984 |
71.7% 11,709 |
28.3% 4,623 |
|
| 1980 |
63.1% 10,515 |
33.7% 5,621 |
3.2% 526 |
| 1976 |
49.9% 7,142 |
49.3% 7,045 |
0.8% 114 |
| 1972 |
71.4% 10,701 |
28.6% 4,291 |
|
| 1968 |
52.9% 7,343 |
36.5% 5,064 |
10.7% 1,481 |
| 1964 |
45.0% 6,660 |
55.0% 8,139 |
|
| 1960 |
61.3% 9,010 |
38.7% 5,678 |
|
| 1956 |
58.5% 7,792 |
41.5% 5,529 |
|
| 1952 |
62.7% 8,577 |
37.1% 5,070 |
0.2% 30 |
| 1948 |
50.9% 5,820 |
48.9% 5,598 |
0.2% 25 |
| 1944 |
57.5% 6,985 |
42.3% 5,146 |
0.2% 23 |
| 1940 |
56.1% 8,064 |
43.6% 6,256 |
0.3% 44 |
| 1936 |
47.9% 6,437 |
51.5% 6,929 |
0.6% 82 |
| 1932 |
39.4% 4,806 |
59.2% 7,224 |
1.5% 179 |
| 1928 |
67.8% 7,054 |
31.4% 3,269 |
0.8% 85 |
| 1924 |
51.0% 4,592 |
44.1% 3,970 |
5.0% 449 |
| 1920 |
55.9% 5,541 |
41.1% 4,078 |
3.0% 293 |
| 1916 |
45.7% 2,929 |
49.3% 3,158 |
5.0% 322 |
| 1912 |
27.2% 1,470 |
44.8% 2,421 |
27.9% 1,508 |
| 1908 |
45.0% 2,620 |
46.8% 2,725 |
8.2% 478 |
| 1904 |
48.6% 2,647 |
42.2% 2,296 |
9.3% 504 |
| 1900 |
46.3% 2,673 |
49.9% 2,877 |
3.8% 219 |
| 1896 |
41.3% 2,174 |
57.5% 3,029 |
1.2% 65 |
| 1892 |
40.2% 1,883 |
42.3% 1,978 |
17.5% 819 |
| 1888 |
41.3% 1,787 |
45.5% 1,969 |
13.2% 573 |
Communities
Unincorporated communities
Townships
- Benton
- Berwick
- Buffalo
- Dayton
- Five Mile
- Franklin
- Granby
- Marion
- Neosho
- Newtonia
- Seneca
- Shoal Creek
- Van Buren
- West Benton
References
- 1 2 "State & County QuickFacts". United States Census Bureau. Archived from the original on July 15, 2011. Retrieved September 12, 2013.
- ↑ "Find a County". National Association of Counties. Retrieved 2011-06-07.
- ↑ Eaton, David Wolfe (1917). How Missouri Counties, Towns and Streams Were Named. The State Historical Society of Missouri. p. 335.
- ↑ "2010 Census Gazetteer Files". United States Census Bureau. August 22, 2012. Archived from the original on October 21, 2013. Retrieved November 17, 2014.
- ↑ "Population and Housing Unit Estimates". Retrieved June 9, 2017.
- ↑ "U.S. Decennial Census". United States Census Bureau. Retrieved November 17, 2014.
- ↑ "Historical Census Browser". University of Virginia Library. Retrieved November 17, 2014.
- ↑ "Population of Counties by Decennial Census: 1900 to 1990". United States Census Bureau. Retrieved November 17, 2014.
- ↑ "Census 2000 PHC-T-4. Ranking Tables for Counties: 1990 and 2000" (PDF). United States Census Bureau. Retrieved November 17, 2014.
- ↑ Breeding, Marshall. "Neosho/Newton County Library". Libraries.org. Retrieved May 8, 2017.
- ↑ Leip, David. "Dave Leip's Atlas of U.S. Presidential Elections". uselectionatlas.org. Retrieved 2018-03-25.