Sandia Heights, New Mexico
| Sandia Heights, New Mexico | |
|---|---|
| Census-designated place | |
 Sandia Heights | |
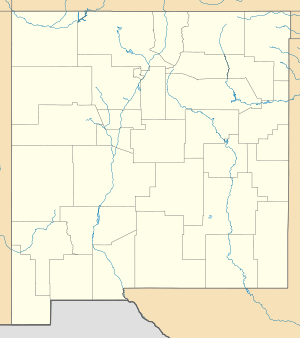
| Coordinates: 35°10′27″N 106°29′18″W / 35.17417°N 106.48833°WCoordinates: 35°10′27″N 106°29′18″W / 35.17417°N 106.48833°W | |
| Country | United States |
| State | New Mexico |
| County | Bernalillo |
| Area | |
| • Total | 1.9 sq mi (5.0 km2) |
| • Land | 1.9 sq mi (5.0 km2) |
| • Water | 0.0 sq mi (0.0 km2) |
| Elevation | 6,180 ft (1,880 m) |
| Population (2010) | |
| • Total | 10,293 |
| • Density | 1,658/sq mi (640.2/km2) |
| Time zone | UTC-7 (Mountain (MST)) |
| • Summer (DST) | UTC-6 (MDT) |
| ZIP code | 87122 |
| Area code(s) | 505 |
| FIPS code | 35-66765 |
| GNIS feature ID | 1867388 |
Sandia Heights is a census-designated place (CDP) in Bernalillo County, New Mexico, United States. The population was 10,293 at the 2010 census.[1] It is part of the Albuquerque Metropolitan Statistical Area.
Geography
Sandia Heights is located in northern Bernalillo County at the western base of the Sandia Mountains. It is bordered to the south by the city of Albuquerque. The base station for the Sandia Peak Tramway is located just outside the northern edge of the CDP.
According to the United States Census Bureau, Sandia Heights has a total area of 1.9 square miles (5.0 km2), all of it land.[1]
Climate
Sandia Heights is categorized as being within the 7b USDA hardiness zone, meaning temperatures can get as low as 5 to 10 °F.[2]
| Climate data for Sandia Heights (6,180 feet above sea level) | |||||||||||||
|---|---|---|---|---|---|---|---|---|---|---|---|---|---|
| Month | Jan | Feb | Mar | Apr | May | Jun | Jul | Aug | Sep | Oct | Nov | Dec | Year |
| Record high °F (°C) | 67.0 (19.4) |
70.0 (21.1) |
79.0 (26.1) |
85.0 (29.4) |
96.0 (35.6) |
101.0 (38.3) |
100.0 (37.8) |
98.0 (36.7) |
93.0 (33.9) |
86.0 (30) |
75.0 (23.9) |
67.0 (19.4) |
101 (38.3) |
| Average high °F (°C) | 43.0 (6.1) |
48.0 (8.9) |
56.0 (13.3) |
64.0 (17.8) |
74.0 (23.3) |
83.0 (28.3) |
85.0 (29.4) |
83.0 (28.3) |
77.0 (25) |
66.0 (18.9) |
53.0 (11.7) |
43.0 (6.1) |
65 (18.1) |
| Daily mean °F (°C) | 30.0 (−1.1) |
34.5 (1.4) |
41.0 (5) |
48.0 (8.9) |
57.5 (14.2) |
66.0 (18.9) |
69.5 (20.8) |
68.5 (20.3) |
61.5 (16.4) |
50.5 (10.3) |
39.0 (3.9) |
30.0 (−1.1) |
49.7 (9.8) |
| Average low °F (°C) | 17.0 (−8.3) |
21.0 (−6.1) |
26.0 (−3.3) |
32.0 (0) |
41.0 (5) |
49.0 (9.4) |
54.0 (12.2) |
54.0 (12.2) |
46.0 (7.8) |
35.0 (1.7) |
25.0 (−3.9) |
17.0 (−8.3) |
35 (1.5) |
| Record low °F (°C) | −30.0 (−34.4) |
−27.0 (−32.8) |
0.0 (−17.8) |
7.0 (−13.9) |
12.0 (−11.1) |
28.0 (−2.2) |
40.0 (4.4) |
38.0 (3.3) |
22.0 (−5.6) |
3.0 (−16.1) |
−18.0 (−27.8) |
−18.0 (−27.8) |
−30 (−34.4) |
| Average precipitation inches (mm) | 0.49 (12.4) |
0.35 (8.9) |
0.68 (17.3) |
0.61 (15.5) |
0.99 (25.1) |
1.63 (41.4) |
2.23 (56.6) |
2.52 (64) |
1.62 (41.1) |
1.40 (35.6) |
0.60 (15.2) |
0.65 (16.5) |
13.77 (349.6) |
| Source: Weather Channel[3] | |||||||||||||
References
- 1 2 "Geographic Identifiers: 2010 Demographic Profile Data (G001): Sandia Heights CDP, New Mexico". U.S. Census Bureau, American Factfinder. Retrieved January 30, 2014.
- ↑ "USDA Plant Hardiness Zone Map". United States Department of Agriculture. Retrieved 13 August 2018.
- ↑ "Sandia Heights, NM Monthly Weather Forecast". Weather Channel. Retrieved 13 August 2018.
Municipalities and communities of Bernalillo County, New Mexico, United States | ||
|---|---|---|
| Cities | 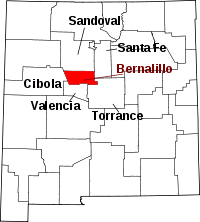 | |
| Town | ||
| Villages | ||
| CDPs | ||
| Other unincorporated communities | ||
| Indian reservations | ||
| Footnotes | ‡This populated place also has portions in an adjacent county or counties | |
This article is issued from
Wikipedia.
The text is licensed under Creative Commons - Attribution - Sharealike.
Additional terms may apply for the media files.