2004 United States presidential election in Colorado
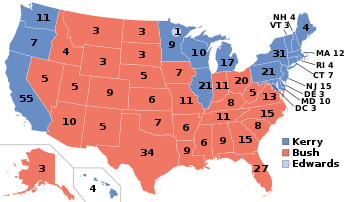
The 2004 United States presidential election in Colorado took place on November 2, 2004, and was part of the 2004 United States presidential election. Voters chose nine representatives, or electors to the Electoral College, who voted for president and vice president.
| ||||||||||||||||||||||||||
| ||||||||||||||||||||||||||
 County Results
| ||||||||||||||||||||||||||
| ||||||||||||||||||||||||||
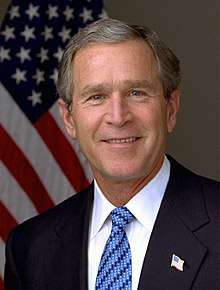
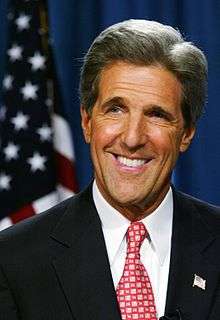
Colorado was won by incumbent President George W. Bush by a 4.67% margin of victory. Prior to the election, ten of twelve news organizations considered this a state Bush would win, or otherwise considered as a red state, although both campaigns targeted it as the Democratic candidate, John Kerry, was born in Colorado. On election day, Bush did carry Colorado, but by only about half the 9% margin he won over Al Gore in 2000. Additionally, Colorado voters decided not to pass a referendum that would have split their electoral vote for this and future presidential elections.
As of the 2016 presidential election, this is the last time the Republican nominee carried Colorado in a presidential election, as well as Arapahoe County, Jefferson County, Larimer County, Alamosa County, and Ouray County.[1] This is also the only presidential election that Broomfield County, created in 2001, has voted Republican.[1] It was also the first time any candidate received a million votes in the state.
Primaries
- 2004 Colorado Democratic primary
Campaign
Predictions
| Elections in Colorado | ||||||||
|---|---|---|---|---|---|---|---|---|
 | ||||||||
|
||||||||
|
||||||||
|
|
||||||||
There were 12 news organizations who made state-by-state predictions of the election. Here are their last predictions before election day.[2]
- D.C. Political Report: Slight Republican
- Associated Press: Leans Bush
- CNN: Bush
- Cook Political Report: Leans Republican
- Newsweek: Leans Bush
- New York Times: Leans Bush
- Rasmussen Reports: Bush
- Research 2000: Leans Bush
- Washington Post: Battleground
- Washington Times: Leans Bush
- Zogby International: Kerry
- Washington Dispatch: Bush
Polling
Although considered a battleground state, Bush won every single pre-election poll. The final three polls averaged Bush leading with 51% to 44%.[3]
Analysis
The key to Bush's victory in the state was winning the largely populated counties such as Jefferson County, Douglas County, El Paso County, and Arapahoe County. Although nationally Bush did better, his margin in Colorado was smaller than in 2000 and this was the first occasion San Juan County voted Democratic since Lyndon B. Johnson’s 1964 landslide.[lower-alpha 1][8] Nonetheless, Huerfano County voted for a Republican presidential candidate for the first time since Richard Nixon’s 2,900-plus-county landslide in 1972,[8] with Bush’s win there reflecting his strong appeal (for a Republican) amongst Hispanic voters as seen in New Mexico and Bush’s native Texas.
Results
| 2004 United States presidential election in Colorado[9] | |||||
|---|---|---|---|---|---|
| Party | Candidate | Votes | Percentage | Electoral votes | |
| Republican | George W. Bush | 1,101,255 | 51.69% | 9 | |
| Democratic | John Kerry | 1,001,732 | 47.02% | 0 | |
| Independent | Ralph Nader | 12,718 | 0.60% | 0 | |
| Libertarian | Michael Badnarik | 7,664 | 0.36% | 0 | |
| Constitution | Michael Peroutka | 2,562 | 0.12% | 0 | |
| Green | David Cobb | 1,591 | 0.07% | 0 | |
| Independent | Stanford Andress | 804 | 0.04% | 0 | |
| Independent | Write-Ins | 700 | 0.03% | 0 | |
| Concerns of People | Gene Amondson | 378 | 0.02% | 0 | |
| Socialist Equality | Bill Van Auken | 329 | 0.02% | 0 | |
| Socialist Workers | Roger Calero | 241 | 0.01% | 0 | |
| Socialist | Walt Brown | 216 | 0.01% | 0 | |
| Prohibition | Earl Dodge | 140 | 0.01% | 0 | |
| Totals | 2,130,330 | 100.00% | 9 | ||
| Voter turnout (Voting Age) | 62.7% | ||||
Results by county
| County | George Walker Bush[10] Republican |
John Forbes Kerry[10] Democratic |
Ralph Nader[10] Independent |
Michael J. Badnarik[10] Libertarian |
Various candidates Other parties |
Margin | ||||||
|---|---|---|---|---|---|---|---|---|---|---|---|---|
| % | # | % | # | % | # | % | # | % | # | % | # | |
| Cheyenne | 81.39% | 923 | 17.46% | 198 | 0.62% | 7 | 0.09% | 1 | 0.44% | 5 | 63.93% | 725 |
| Washington | 81.03% | 2,050 | 17.98% | 455 | 0.43% | 11 | 0.24% | 6 | 0.32% | 8 | 63.04% | 1,595 |
| Rio Blanco | 80.02% | 2,403 | 18.85% | 566 | 0.57% | 17 | 0.30% | 9 | 0.27% | 8 | 61.17% | 1,837 |
| Kiowa | 79.82% | 712 | 19.28% | 172 | 0.34% | 3 | 0.22% | 2 | 0.34% | 3 | 60.54% | 540 |
| Kit Carson | 77.70% | 2,721 | 20.82% | 729 | 0.66% | 23 | 0.26% | 9 | 0.57% | 20 | 56.88% | 1,992 |
| Lincoln | 77.83% | 1,819 | 21.52% | 503 | 0.30% | 7 | 0.09% | 2 | 0.26% | 6 | 56.31% | 1,316 |
| Baca | 76.85% | 1,680 | 22.10% | 483 | 0.50% | 11 | 0.37% | 8 | 0.18% | 4 | 54.76% | 1,197 |
| Jackson | 76.02% | 710 | 22.48% | 210 | 0.75% | 7 | 0.43% | 4 | 0.32% | 3 | 53.53% | 500 |
| Yuma | 75.81% | 3,456 | 23.34% | 1,064 | 0.37% | 17 | 0.18% | 8 | 0.31% | 14 | 52.47% | 2,392 |
| Moffat | 74.18% | 4,247 | 23.67% | 1,355 | 1.14% | 65 | 0.40% | 23 | 0.61% | 35 | 50.52% | 2,892 |
| Elbert | 73.84% | 8,389 | 24.94% | 2,834 | 0.46% | 52 | 0.29% | 33 | 0.47% | 53 | 48.90% | 5,555 |
| Phillips | 73.85% | 1,717 | 25.03% | 582 | 0.60% | 14 | 0.30% | 7 | 0.22% | 5 | 48.82% | 1,135 |
| Prowers | 71.49% | 3,392 | 27.57% | 1,308 | 0.55% | 26 | 0.15% | 7 | 0.25% | 12 | 43.92% | 2,084 |
| Sedgwick | 71.40% | 971 | 27.50% | 374 | 0.66% | 9 | 0.29% | 4 | 0.15% | 2 | 43.90% | 597 |
| Logan | 70.36% | 6,168 | 28.42% | 2,491 | 0.66% | 58 | 0.16% | 14 | 0.40% | 35 | 41.95% | 3,677 |
| Montrose | 69.17% | 11,218 | 29.45% | 4,776 | 0.62% | 100 | 0.41% | 67 | 0.36% | 58 | 39.72% | 6,442 |
| Dolores | 68.50% | 785 | 29.06% | 333 | 0.79% | 9 | 0.26% | 3 | 1.40% | 16 | 39.44% | 452 |
| Delta | 68.66% | 9,722 | 29.83% | 4,224 | 0.74% | 105 | 0.42% | 59 | 0.35% | 49 | 38.83% | 5,498 |
| Teller | 68.36% | 8,094 | 30.03% | 3,556 | 0.77% | 91 | 0.57% | 68 | 0.26% | 31 | 38.33% | 4,538 |
| Custer | 68.25% | 1,657 | 30.44% | 739 | 0.54% | 13 | 0.41% | 10 | 0.37% | 9 | 37.81% | 918 |
| Morgan | 68.31% | 6,787 | 30.59% | 3,039 | 0.64% | 64 | 0.15% | 15 | 0.31% | 31 | 37.72% | 3,748 |
| Mesa | 67.12% | 41,539 | 31.61% | 19,564 | 0.68% | 420 | 0.32% | 197 | 0.27% | 165 | 35.51% | 21,975 |
| Crowley | 67.38% | 1,006 | 32.02% | 478 | 0.07% | 1 | 0.27% | 4 | 0.27% | 4 | 35.37% | 528 |
| Fremont | 67.18% | 12,313 | 32.37% | 5,933 | 0.39% | 72 | 0.06% | 11 | 0.00% | 0 | 34.81% | 6,380 |
| El Paso | 66.74% | 161,361 | 32.11% | 77,648 | 0.55% | 1,319 | 0.37% | 896 | 0.23% | 562 | 34.62% | 83,713 |
| Douglas | 66.54% | 80,651 | 32.72% | 39,661 | 0.34% | 418 | 0.26% | 314 | 0.13% | 156 | 33.82% | 40,990 |
| Montezuma | 63.44% | 6,988 | 35.11% | 3,867 | 0.79% | 87 | 0.35% | 39 | 0.31% | 34 | 28.33% | 3,121 |
| Weld | 62.71% | 55,591 | 35.95% | 31,868 | 0.56% | 497 | 0.32% | 287 | 0.46% | 409 | 26.76% | 23,723 |
| Rio Grande | 62.43% | 3,448 | 36.32% | 2,006 | 0.85% | 47 | 0.16% | 9 | 0.24% | 13 | 26.11% | 1,442 |
| Bent | 62.09% | 1,338 | 36.43% | 785 | 1.02% | 22 | 0.19% | 4 | 0.28% | 6 | 25.66% | 553 |
| Mineral | 61.87% | 383 | 36.67% | 227 | 0.97% | 6 | 0.48% | 3 | 0.00% | 0 | 25.20% | 156 |
| Archuleta | 61.67% | 3,601 | 36.67% | 2,141 | 0.70% | 41 | 0.31% | 18 | 0.65% | 38 | 25.00% | 1,460 |
| Otero | 60.48% | 4,947 | 38.68% | 3,164 | 0.48% | 39 | 0.16% | 13 | 0.21% | 17 | 21.80% | 1,783 |
| Hinsdale | 58.97% | 355 | 39.20% | 236 | 0.83% | 5 | 0.50% | 3 | 0.50% | 3 | 19.77% | 119 |
| Park | 57.22% | 4,781 | 41.23% | 3,445 | 0.71% | 59 | 0.47% | 39 | 0.37% | 31 | 15.99% | 1,336 |
| Grand | 55.99% | 4,260 | 42.62% | 3,243 | 0.78% | 59 | 0.42% | 32 | 0.20% | 15 | 13.37% | 1,017 |
| Chaffee | 55.59% | 4,875 | 42.95% | 3,766 | 0.88% | 77 | 0.41% | 36 | 0.17% | 15 | 12.65% | 1,109 |
| Garfield | 53.87% | 11,123 | 44.69% | 9,228 | 0.72% | 148 | 0.47% | 97 | 0.25% | 51 | 9.18% | 1,895 |
| Larimer | 51.82% | 75,884 | 46.62% | 68,266 | 0.68% | 999 | 0.46% | 672 | 0.42% | 614 | 5.20% | 7,618 |
| Jefferson | 51.84% | 140,644 | 46.65% | 126,558 | 0.64% | 1,730 | 0.40% | 1,089 | 0.47% | 1,272 | 5.19% | 14,086 |
| Broomfield | 51.68% | 12,007 | 47.06% | 10,935 | 0.61% | 142 | 0.42% | 98 | 0.23% | 53 | 4.61% | 1,072 |
| Ouray | 51.56% | 1,402 | 47.00% | 1,278 | 0.77% | 21 | 0.37% | 10 | 0.29% | 8 | 4.56% | 124 |
| Arapahoe | 51.46% | 119,475 | 47.49% | 110,262 | 0.50% | 1,158 | 0.33% | 776 | 0.22% | 500 | 3.97% | 9,213 |
| Alamosa | 50.71% | 3,179 | 48.13% | 3,017 | 0.70% | 44 | 0.21% | 13 | 0.26% | 16 | 2.58% | 162 |
| Huerfano | 49.97% | 1,700 | 48.88% | 1,663 | 0.71% | 24 | 0.15% | 5 | 0.29% | 10 | 1.09% | 37 |
| Conejos | 49.05% | 1,864 | 49.84% | 1,894 | 0.50% | 19 | 0.08% | 3 | 0.53% | 20 | -0.79% | -30 |
| Las Animas | 48.52% | 3,196 | 50.10% | 3,300 | 0.64% | 42 | 0.21% | 14 | 0.53% | 35 | -1.58% | -104 |
| Adams | 48.23% | 65,912 | 50.58% | 69,122 | 0.59% | 813 | 0.30% | 411 | 0.30% | 414 | -2.35% | -3,210 |
| Pueblo | 46.32% | 31,117 | 52.65% | 35,369 | 0.63% | 425 | 0.18% | 124 | 0.22% | 147 | -6.33% | -4,252 |
| Eagle | 46.10% | 8,533 | 52.64% | 9,744 | 0.64% | 118 | 0.37% | 69 | 0.25% | 47 | -6.54% | -1,211 |
| La Plata | 45.92% | 11,704 | 52.60% | 13,409 | 0.77% | 196 | 0.41% | 104 | 0.30% | 77 | -6.69% | -1,705 |
| San Juan | 44.44% | 216 | 52.06% | 253 | 2.06% | 10 | 0.41% | 2 | 1.03% | 5 | -7.61% | -37 |
| Clear Creek | 44.93% | 2,522 | 53.25% | 2,989 | 0.80% | 45 | 0.69% | 39 | 0.32% | 18 | -8.32% | -467 |
| Routt | 44.21% | 5,199 | 54.35% | 6,392 | 0.76% | 89 | 0.47% | 55 | 0.22% | 26 | -10.14% | -1,193 |
| Lake | 42.76% | 1,261 | 55.04% | 1,623 | 1.39% | 41 | 0.58% | 17 | 0.24% | 7 | -12.28% | -362 |
| Gilpin | 41.58% | 1,329 | 56.54% | 1,807 | 0.72% | 23 | 0.69% | 22 | 0.47% | 15 | -14.96% | -478 |
| Saguache | 41.49% | 1,163 | 56.87% | 1,594 | 0.71% | 20 | 0.57% | 16 | 0.36% | 10 | -15.38% | -431 |
| Gunnison | 41.32% | 3,479 | 56.79% | 4,782 | 1.10% | 93 | 0.40% | 34 | 0.38% | 32 | -15.48% | -1,303 |
| Summit | 39.10% | 5,370 | 59.29% | 8,144 | 0.87% | 119 | 0.44% | 60 | 0.31% | 42 | -20.20% | -2,774 |
| Boulder | 32.39% | 51,586 | 66.29% | 105,564 | 0.61% | 964 | 0.48% | 764 | 0.24% | 379 | -33.89% | -53,978 |
| Costilla | 32.18% | 566 | 66.52% | 1,170 | 0.85% | 15 | 0.28% | 5 | 0.17% | 3 | -34.34% | -604 |
| Pitkin | 30.08% | 2,784 | 68.45% | 6,335 | 0.83% | 77 | 0.42% | 39 | 0.22% | 20 | -38.37% | -3,551 |
| Denver | 29.29% | 69,903 | 69.61% | 166,135 | 0.57% | 1,371 | 0.33% | 781 | 0.20% | 482 | -40.32% | -96,232 |
| San Miguel | 26.85% | 1,079 | 71.56% | 2,876 | 0.77% | 31 | 0.67% | 27 | 0.15% | 6 | -44.71% | -1,797 |
Results by congressional district
Bush won four of seven congressional districts including one held by a Democratic representative.[11]
| District | Bush | Kerry | Representative |
|---|---|---|---|
| 1st | 31% | 68% | Diana DeGette |
| 2nd | 41% | 58% | Mark Udall |
| 3rd | 55% | 44% | Scott McInnis |
| John Salazar | |||
| 4th | 58% | 41% | Marilyn Musgrave |
| 5th | 66% | 33% | Joel Hefley |
| 6th | 60% | 39% | Tom Tancredo |
| 7th | 48% | 51% | Bob Beauprez |
Electors
Technically the voters of Colorado cast their ballots for electors: representatives to the Electoral College. Colorado is allocated 9 electors because it has seven congressional districts and two senators. All candidates who appear on the ballot or qualify to receive write-in votes must submit a list of nine electors, who pledge to vote for their candidate and his or her running mate. Whoever wins the majority of votes in the state is awarded all nine electoral votes. Their chosen electors then vote for president and vice president. Although electors are pledged to their candidate and running mate, they are not obligated to vote for them. An elector who votes for someone other than his or her candidate is known as a faithless elector.
The electors of each state and the District of Columbia met on December 13, 2004, to cast their votes for president and vice president. The Electoral College itself never meets as one body. Instead the electors from each state and the District of Columbia met in their respective capitols.
The following were the members of the Electoral College from the state. All were pledged to and voted for George W. Bush and Dick Cheney.[12]
- Theodore S. Halaby
- Robert A. Martinez
- Lilly Y. Nunez
- Cynthia H. Murphy
- Sylvia Morgan-Smith
- Diane B. Gallagher
- Vicki A. Edwards
- Frances W. Owens
- Booker T. Graves
Failed election reform
There was a Constitutional amendment put on the ballot in the state to alter the way the state's electors would be distributed among presidential candidates, but was rejected by the voters in 2004.
Notes
- San Juan County actually gave a plurality to Independent Ross Perot in 1992, but gave a Republican plurality in every other presidential election between 1968 and 2000.
References
- Sullivan, Robert David; ‘How the Red and Blue Map Evolved Over the Past Century’; America Magazine in The National Catholic Review; June 29, 2016
- http://www.dcpoliticalreport.com/members/2004/Pred2.htm#NW%5B%5D
- "Archived copy". Archived from the original on 2008-11-16. Retrieved 2009-06-20.CS1 maint: archived copy as title (link)
- "George W Bush - $374,659,453 raised, '04 election cycle, Republican Party, President". www.campaignmoney.com.
- "John F Kerry - $345,826,176 raised, '04 election cycle, Democratic Party, President". www.campaignmoney.com.
- "CNN.com Specials". www.cnn.com.
- "CNN.com Specials". www.cnn.com.
- Menendez, Albert J.; The Geography of Presidential Elections in the United States, 1868-2004, pp. 159-161 ISBN 0786422173
- "CNN.com Election 2004". www.cnn.com.
- Our Campaigns; CO US President Race, November 02, 2004
- "Presidential Results by Congressional District, 2000-2008 – Swing State Project". www.swingstateproject.com.
- "U. S. Electoral College 2008 Election - Certificates". www.archives.gov.