Greenwich (UK Parliament constituency)
| Greenwich | |
|---|---|
|
Former Borough constituency for the House of Commons | |
| County | Greater London |
| 1832–1885 | |
| Number of members | Two |
| Replaced by | Deptford, Greenwich, Lewisham and Woolwich |
| Created from | Kent |
| 1885–1997 | |
| Number of members | One |
| Replaced by | Greenwich & Woolwich |
| Created from | Greenwich |
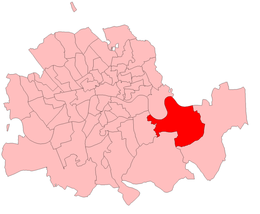
Greenwich was a parliamentary constituency in south-east London, which returned Members of Parliament to the House of Commons of the UK Parliament from 1832 to 1997 (by the first past the post system).
History
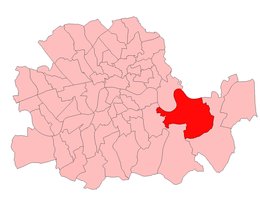
From 1832 until 1885 it was a two-member constituency. Its area was cut and it was reduced to a seat under the Redistribution of Seats Act 1885 associated with the Reform Act 1884. For the 1997 general election, it was merged with part of the former Woolwich constituency to form the Greenwich and Woolwich seat.

Its history is dominated by the area's strong maritime tradition. Its most prominent claim to fame was as the seat of William Ewart Gladstone between 1868 and 1880, and it also achieved prominence in the 1987 Greenwich by-election, when the SDP won a surprise victory.
Boundaries
1885-1918: The civil parishes of Greenwich, St Nicholas, Deptford, Charlton, and Kidbrooke.
1918-1974: The Metropolitan Borough of Greenwich.
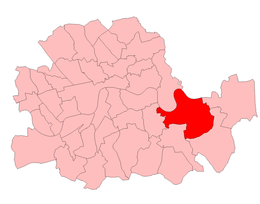
1974-1983: The London Borough of Greenwich wards of Blackheath, Charlton, Eastcombe, Hornfair, Kidbrooke, Marsh, Park, Trafalgar, Vanbrugh, and West.
1983-1997: The London Borough of Greenwich wards of Blackheath, Charlton, Ferrier, Hornfair, Kidbrooke, Rectory Field, St Alfege, Trafalgar, Vanbrugh, and West.
Between 1983 and 1997, the constituency formed the western part of the Royal Borough of Greenwich.
Members of Parliament
MPs 1832–1885
| Election | 1st Member | 1st Party | 2nd Member | 2nd Party | ||
|---|---|---|---|---|---|---|
| 1832 | constituency created with two members | |||||
| 1832 | James Whitley Deans Dundas | Whig[1] | Edward George Barnard | Radical[2] | ||
| 1835 | John Angerstein | Liberal | ||||
| 1837 | Matthias Wolverley Attwood | Conservative | ||||
| 1841 | James Whitley Deans Dundas | Whig[1] | ||||
| 1851 by-election | David Salomons | Radical[3] | ||||
| 1852 by-election | Houston Stewart | Whig[4] | ||||
| 1852 | Peter Rolt | Conservative | Montague Chambers | Radical[3] | ||
| Feb 1857 by-election | Sir William Codrington | Whig | ||||
| Mar. 1857 | John Townsend | Radical[3] | ||||
| Feb. 1859 by-election | David Salomons | Radical[3] | ||||
| 1859 | William Angerstein | Liberal | Liberal | |||
| 1865 | Sir Charles Tilston Bright | Liberal | ||||
| 1868 | William Ewart Gladstone | Liberal | ||||
| 1873 by-election | Sir Thomas Boord | Conservative | ||||
| 1880 | Baron Henry de Worms | Conservative | ||||
| 1885 | Representation reduced to one member | |||||
MPs since 1885
Election results
Elections in the 1850s
Barnard's death caused a by-election.
| Party | Candidate | Votes | % | ± | |
|---|---|---|---|---|---|
| Radical | David Salomons | 2,165 | 62.9 | ||
| Radical | David Williams Wire[6][3] | 1,278 | 37.1 | ||
| Majority | 887 | 25.8 | |||
| Turnout | 3,443 | 57.2 | |||
| Registered electors | 6,022 | ||||
| Radical hold | Swing | ||||
Dundas resigned after being appointed Commander of the Mediterranean Fleet, causing a by-election.
| Party | Candidate | Votes | % | ± | |
|---|---|---|---|---|---|
| Whig | Houston Stewart | 2,956 | 70.9 | ||
| Radical | Montague Chambers | 1,211 | 29.1 | ||
| Majority | 1,745 | 41.9 | |||
| Turnout | 4,167 | 66.1 | |||
| Registered electors | 6,308 | ||||
| Whig hold | Swing | ||||
| Party | Candidate | Votes | % | ± | |
|---|---|---|---|---|---|
| Conservative | Peter Rolt | 2,415 | 30.6 | N/A | |
| Radical | Montague Chambers | 2,360 | 29.9 | ||
| Whig | Houston Stewart | 2,026 | 25.6 | ||
| Radical | David Salomons | 1,102 | 13.9 | ||
| Turnout | 5,159 (est) | 81.8 (est) | |||
| Registered electors | 6,308 | ||||
| Majority | 55 | 0.7 | N/A | ||
| Conservative gain from Whig | Swing | ||||
| Majority | 334 | 4.2 | |||
| Radical hold | Swing | ||||
Rolt resigned, causing a by-election.
| Party | Candidate | Votes | % | ± | |
|---|---|---|---|---|---|
| Whig | William Codrington | 2,975 | 65.8 | +30.2 | |
| Radical | Arthur B. Sleigh[8] | 1,543 | 34.2 | −9.6 | |
| Majority | 1,432 | 31.7 | N/A | ||
| Turnout | 4,518 | 57.3 | −24.5 | ||
| Registered electors | 7,888 | ||||
| Whig gain from Conservative | Swing | +19.9 | |||
| Party | Candidate | Votes | % | ± | |
|---|---|---|---|---|---|
| Whig | William Codrington | 2,985 | 38.1 | +12.5 | |
| Radical | John Townsend | 2,784 | 35.5 | +21.6 | |
| Radical | Montague Chambers | 2,065 | 26.4 | −3.5 | |
| Majority | 719 | 9.2 | N/A | ||
| Turnout | 3,917 (est) | 49.7 (est) | −32.1 | ||
| Registered electors | 7,888 | ||||
| Whig gain from Conservative | Swing | +1.8 | |||
| Radical hold | Swing | +4.6 | |||
Townsend resigned after becoming a bankrupt, also leading to his suspension from the House of Commons.
| Party | Candidate | Votes | % | ± | |
|---|---|---|---|---|---|
| Radical | David Salomons | 3,444 | 57.7 | −4.2 | |
| Whig | William Angerstein[3] | 2,523 | 42.3 | +4.2 | |
| Majority | 921 | 15.4 | N/A | ||
| Turnout | 5,967 | 75.1 | +25.4 | ||
| Registered electors | 7,942 | ||||
| Radical hold | Swing | −4.2 | |||
| Party | Candidate | Votes | % | ± | |
|---|---|---|---|---|---|
| Liberal | David Salomons | 3,873 | 38.2 | N/A | |
| Liberal | William Angerstein | 3,520 | 34.7 | N/A | |
| Liberal | Montague Chambers | 1,718 | 16.9 | −9.5 | |
| Conservative | John Heron-Maxwell | 1,031 | 10.2 | N/A | |
| Majority | 1,802 | 17.8 | +8.6 | ||
| Turnout | 5,587 (est) | 70.3 (est) | +20.6 | ||
| Registered electors | 7,942 | ||||
| Liberal hold | Swing | N/A | |||
| Liberal hold | Swing | N/A | |||
Elections in the 1860s
| Party | Candidate | Votes | % | ± | |
|---|---|---|---|---|---|
| Liberal | David Salomons | 4,499 | 41.6 | +3.4 | |
| Liberal | Charles Tilston Bright | 3,691 | 34.1 | N/A | |
| Conservative | John Heron-Maxwell | 2,328 | 21.5 | +16.4 | |
| Radical Liberal | Baxter Langley | 190 | 1.8 | N/A | |
| Conservative | Douglas Harris[9] | 116 | 1.1 | −4.0 | |
| Majority | 1,363 | 12.6 | −5.2 | ||
| Turnout | 6,518 (est) | 66.5 (est) | −3.8 | ||
| Registered electors | 9,805 | ||||
| Liberal hold | Swing | −1.4 | |||
| Liberal hold | Swing | N/A | |||
| Party | Candidate | Votes | % | ± | |
|---|---|---|---|---|---|
| Liberal | David Salomons | 6,684 | 30.2 | −11.4 | |
| Liberal | William Ewart Gladstone | 6,386 | 28.8 | −5.3 | |
| Conservative | Henry Parker[10] | 4,704 | 21.2 | −0.3 | |
| Conservative | Arthur Stanhope | 4,372 | 19.7 | +18.6 | |
| Majority | 1,682 | 7.6 | −5.0 | ||
| Turnout | 11,073 (est) | 71.0 (est) | +4.5 | ||
| Registered electors | 15,588 | ||||
| Liberal hold | Swing | −15.0 | |||
| Liberal hold | Swing | −2.5 | |||
Gladstone's appointment as Prime Minister and First Lord of the Treasury caused a by-election.
| Party | Candidate | Votes | % | ± | |
|---|---|---|---|---|---|
| Liberal | William Ewart Gladstone | Unopposed | |||
| Liberal hold | |||||
Elections in the 1870s
Salomons' death caused a by-election.
| Party | Candidate | Votes | % | ± | |
|---|---|---|---|---|---|
| Conservative | Thomas Boord | 4,525 | 54.2 | +13.3 | |
| Radical Liberal | Baxter Langley[12] | 2,379 | 28.5 | N/A | |
| Liberal | William Angerstein | 1,064 | 12.7 | −46.3 | |
| Radical Liberal | John Bennett[13][14] | 324 | 3.9 | N/A | |
| Liberal-Conservative | Robert Coningsby[15] | 27 | 0.3 | N/A | |
| Ind. Conservative | Henry Pook[16] | 27 | 0.3 | N/A | |
| Majority | 2,146 | 25.7 | N/A | ||
| Turnout | 8,346 | 52.2 | −18.8 | ||
| Registered electors | 15,990 | ||||
| Conservative gain from Liberal | Swing | +29.8 | |||
| Party | Candidate | Votes | % | ± | |
|---|---|---|---|---|---|
| Conservative | Thomas Boord | 6,193 | 27.0 | +5.8 | |
| Liberal | William Ewart Gladstone | 5,968 | 26.0 | −2.8 | |
| Conservative | John Evelyn Liardet[17] | 5,561 | 24.2 | +4.5 | |
| Liberal | Baxter Langley | 5,255 | 22.9 | −7.3 | |
| Turnout | 11,489 (est) | 65.3 (est) | −5.7 | ||
| Registered electors | 17,599 | ||||
| Majority | 225 | 1.0 | N/A | ||
| Conservative gain from Liberal | Swing | +6.6 | |||
| Majority | 407 | 1.8 | −5.8 | ||
| Liberal hold | Swing | −3.7 | |||
Elections in the 1880s
| Party | Candidate | Votes | % | ± | |
|---|---|---|---|---|---|
| Conservative | Thomas Boord | 9,243 | 26.6 | −0.4 | |
| Conservative | Henry de Worms | 9,240 | 26.6 | +2.4 | |
| Liberal | James Ebenezer Saunders[18] | 8,152 | 23.4 | −2.6 | |
| Liberal | William Henry Stone[19] | 8,141 | 23.4 | +0.5 | |
| Majority | 1,088 | 3.1 | +2.1 | ||
| Turnout | 17,388 (est) | 78.5 (est) | +13.2 | ||
| Registered electors | 22,161 | ||||
| Conservative hold | Swing | −0.5 | |||
| Conservative gain from Liberal | Swing | +2.5 | |||
| Party | Candidate | Votes | % | ± | |
|---|---|---|---|---|---|
| Conservative | Thomas Boord | 3,317 | 52.8 | −0.4 | |
| Liberal | Herbert Watney | 2,961 | 47.2 | +0.4 | |
| Majority | 356 | 5.6 | +2.5 | ||
| Turnout | 6,278 | 72.7 | −5.8 (est) | ||
| Registered electors | 8,632 | ||||
| Conservative hold | Swing | −0.4 | |||
| Party | Candidate | Votes | % | ± | |
|---|---|---|---|---|---|
| Conservative | Thomas Boord | 3,240 | 55.9 | +3.1 | |
| Liberal | George Crispe Whiteley | 2,551 | 44.1 | -3.1 | |
| Majority | 689 | 11.8 | +6.2 | ||
| Turnout | 5,791 | 67.1 | -5.6 | ||
| Registered electors | 8,632 | ||||
| Conservative hold | Swing | +3.1 | |||
Elections in the 1890s
| Party | Candidate | Votes | % | ± | |
|---|---|---|---|---|---|
| Conservative | Thomas Boord | 4,200 | 52.0 | -3.9 | |
| Liberal | George Crispe Whiteley | 3,877 | 48.0 | +3.9 | |
| Majority | 323 | 4.0 | -7.8 | ||
| Turnout | 8,077 | 78.8 | +11.7 | ||
| Registered electors | 10,256 | ||||
| Conservative hold | Swing | -3.9 | |||
| Party | Candidate | Votes | % | ± | |
|---|---|---|---|---|---|
| Conservative | Hugh Cecil | 4,802 | 57.4 | +5.4 | |
| Liberal | George Crispe Whiteley | 3,564 | 42.6 | -5.4 | |
| Majority | 1,238 | 14.8 | +10.8 | ||
| Turnout | 8,366 | 76.8 | -2.0 | ||
| Registered electors | 10,899 | ||||
| Conservative hold | Swing | +5.4 | |||
Elections in the 1900s

| Party | Candidate | Votes | % | ± | |
|---|---|---|---|---|---|
| Conservative | Hugh Cecil | 5,454 | 61.0 | +3.6 | |
| Liberal | Richard Jackson | 3,484 | 39.0 | −3.6 | |
| Majority | 1,970 | 22.0 | +7.2 | ||
| Turnout | 8,938 | 73.0 | −3.8 | ||
| Registered electors | 12,247 | ||||
| Conservative hold | Swing | +3.6 | |||
| Party | Candidate | Votes | % | ± | |
|---|---|---|---|---|---|
| Liberal | Richard Jackson | 4,906 | 45.3 | +6.3 | |
| Ind. Conservative | Ion Hamilton Benn | 3,565 | 32.9 | N/A | |
| Conservative | Hugh Cecil | 2,356 | 21.8 | −39.2 | |
| Majority | 1,341 | 12.4 | N/A | ||
| Turnout | 10,827 | 83.0 | +10.0 | ||
| Registered electors | 13,049 | ||||
| Liberal gain from Conservative | Swing | +22.8 | |||
- Cecil was a free-trader and Benn was a supporter of tariff reform
Elections in the 1910s
| Party | Candidate | Votes | % | ± | |
|---|---|---|---|---|---|
| Conservative | Ion Hamilton Benn | 6,284 | 55.3 | +33.5 | |
| Liberal | Richard Jackson | 5,083 | 44.7 | -0.6 | |
| Majority | 1,201 | 10.6 | -1.8 | ||
| Turnout | 13,153 | 86.4 | +3.4 | ||
| Conservative gain from Liberal | Swing | +17.0 | |||
| Party | Candidate | Votes | % | ± | |
|---|---|---|---|---|---|
| Conservative | Ion Hamilton Benn | 5697 | 57.9 | +2.6 | |
| Liberal | John William Harris | 4146 | 42.1 | -2.6 | |
| Majority | 1,551 | 15.8 | +5.2 | ||
| Turnout | 13,153 | 74.8 | -11.6 | ||
| Conservative hold | Swing | +2.6 | |||
| Party | Candidate | Votes | % | ± | |
|---|---|---|---|---|---|
| C | Unionist | Ion Hamilton Benn | 14,576 | 69.3 | +11.4 |
| Labour | James Bermingham | 6,471 | 30.7 | N/A | |
| Majority | 8,105 | 38.6 | +22.8 | ||
| Turnout | 21,047 | 48.1 | −26.7 | ||
| Registered electors | 43,756 | ||||
| Unionist hold | Swing | N/A | |||
| C indicates candidate endorsed by the coalition government. | |||||
Elections in the 1920s
| Party | Candidate | Votes | % | ± | |
|---|---|---|---|---|---|
| Unionist | George Hume | 16,934 | 60.9 | −8.4 | |
| Labour | Edward Timothy Palmer | 10,860 | 39.1 | +8.4 | |
| Majority | 6,074 | 21.8 | −16.8 | ||
| Turnout | 27,794 | 60.4 | +12.3 | ||
| Registered electors | 46,005 | ||||
| Unionist hold | Swing | −8.4 | |||
| Party | Candidate | Votes | % | ± | |
|---|---|---|---|---|---|
| Labour | Edward Timothy Palmer | 12,314 | 42.7 | +3.6 | |
| Unionist | George Hume | 10,746 | 37.2 | −23.7 | |
| Liberal | Charles Garfield Lott Du Cann | 5,806 | 20.1 | N/A | |
| Majority | 1,568 | 5.5 | N/A | ||
| Turnout | 28,866 | 61.8 | +1.4 | ||
| Registered electors | 46,741 | ||||
| Labour gain from Unionist | Swing | +13.7 | |||
| Party | Candidate | Votes | % | ± | |
|---|---|---|---|---|---|
| Unionist | George Hume | 18,473 | 51.5 | +14.3 | |
| Labour | Edward Timothy Palmer | 17,409 | 48.5 | +5.8 | |
| Majority | 1,064 | 3.0 | N/A | ||
| Turnout | 35,882 | 75.2 | +13.4 | ||
| Registered electors | 47,716 | ||||
| Unionist gain from Labour | Swing | +4.3 | |||
| Party | Candidate | Votes | % | ± | |
|---|---|---|---|---|---|
| Labour | Edward Timothy Palmer | 20,328 | 46.3 | −2.2 | |
| Unionist | George Hume | 16,710 | 38.1 | −13.4 | |
| Liberal | W P Campbell | 6,870 | 15.6 | N/A | |
| Majority | 3,618 | 8.2 | N/A | ||
| Turnout | 43,908 | 70.4 | −4.8 | ||
| Registered electors | 62,342 | ||||
| Labour gain from Unionist | Swing | +5.6 | |||
Elections in the 1930s
| Party | Candidate | Votes | % | ± | |
|---|---|---|---|---|---|
| Conservative | George Hume | 29,278 | 65.03 | +26.9 | |
| Labour | Edward Timothy Palmer | 13,722 | 30.48 | -15.8 | |
| Communist | Kath Duncan | 2,024 | 4.50 | N/A | |
| Majority | 15,556 | 34.6 | N/A | ||
| Turnout | 45,024 | 71.03 | +0.6 | ||
| Registered electors | 63,385 | ||||
| Conservative gain from Labour | Swing | +21.35 | |||
| Party | Candidate | Votes | % | ± | |
|---|---|---|---|---|---|
| Conservative | George Hume | 22,526 | 52.43 | -12.60 | |
| Labour Co-op | Joseph Reeves | 20,436 | 47.57 | +17.09 | |
| Majority | 2,090 | 3.51 | -31.04 | ||
| Turnout | 49,213 | 67.79 | -3.24 | ||
| Registered electors | 72,599 | ||||
| Conservative hold | Swing | -14.85 | |||
Elections in the 1940s
| Party | Candidate | Votes | % | ± | |
|---|---|---|---|---|---|
| Labour | Joseph Reeves | 22,078 | 65.60 | +18.03 | |
| Conservative | Augustus Agar | 11,580 | 34.40 | -18.03 | |
| Majority | 10,498 | 31.19 | N/A | ||
| Turnout | 33,658 | 70.08 | +2.20 | ||
| Registered electors | 48,025 | ||||
| Labour gain from Conservative | Swing | +18.03 | |||
Elections in the 1950s
| Party | Candidate | Votes | % | ± | |
|---|---|---|---|---|---|
| Labour | Joseph Reeves | 29,379 | 57.85 | -7.75 | |
| Conservative | Ronald Gilbey | 18,255 | 35.95 | +1.55 | |
| Liberal | Leslie Maurice Dale | 3,148 | 6.20 | N/A | |
| Majority | 11,124 | 21.91 | -9.28 | ||
| Turnout | 50,782 | 82.73 | +12.65 | ||
| Registered electors | 62,132 | ||||
| Labour hold | Swing | -4.65 | |||
| Party | Candidate | Votes | % | ± | |
|---|---|---|---|---|---|
| Labour | Joseph Reeves | 30,326 | 60.38 | +2.53 | |
| Conservative | William H Bishop | 19,898 | 39.62 | +3.67 | |
| Majority | 10,428 | 20.76 | -1.15 | ||
| Turnout | 50,224 | 80.95 | -2.03 | ||
| Registered electors | 62,042 | ||||
| Labour hold | Swing | -0.57 | |||
| Party | Candidate | Votes | % | ± | |
|---|---|---|---|---|---|
| Labour | Joseph Reeves | 26,423 | 58.84 | -1.54 | |
| Conservative | William F Rhodes | 18,484 | 41.16 | +1.54 | |
| Majority | 7,939 | 17.68 | -3.08 | ||
| Turnout | 44,907 | 73.24 | -7.71 | ||
| Registered electors | 61,314 | ||||
| Labour hold | Swing | -1.54 | |||
| Party | Candidate | Votes | % | ± | |
|---|---|---|---|---|---|
| Labour | Richard Marsh | 25,204 | 56.15 | -2.69 | |
| Conservative | J Rodney Holmes | 19,679 | 43.85 | +2.69 | |
| Majority | 5,525 | 12.31 | -5.37 | ||
| Turnout | 44,883 | 74.11 | +0.87 | ||
| Registered electors | 60,561 | ||||
| Labour hold | Swing | -2.69 | |||
Elections in the 1960s
| Party | Candidate | Votes | % | ± | |
|---|---|---|---|---|---|
| Labour | Richard Marsh | 22,814 | 56.18 | +0.03 | |
| Conservative | John Gummer | 12,592 | 31.01 | -12.84 | |
| Liberal | Michael PD Ellman | 5,205 | 12.82 | N/A | |
| Majority | 10,222 | 25.17 | +13.14 | ||
| Turnout | 40,611 | 71.57 | -2.54 | ||
| Registered electors | 56,742 | ||||
| Labour hold | Swing | +6.44 | |||
| Party | Candidate | Votes | % | ± | |
|---|---|---|---|---|---|
| Labour | Richard Marsh | 24,359 | 64.86 | +8.68 | |
| Conservative | John Gummer | 13,200 | 35.14 | +4.13 | |
| Majority | 11,159 | 29.71 | +4.54 | ||
| Turnout | 37,559 | 67.70 | -3.87 | ||
| Registered electors | 55,477 | ||||
| Labour hold | Swing | +6.41 | |||
Elections in the 1970s
| Party | Candidate | Votes | % | ± | |
|---|---|---|---|---|---|
| Labour | Richard Marsh | 20,804 | 55.75 | ||
| Conservative | J Stuart Thom | 13,195 | 35.36 | ||
| Liberal | Pamela Wylan | 3,319 | 8.89 | ||
| Majority | 7,609 | 20.39 | |||
| Turnout | 37,318 | 65.66 | |||
| Labour hold | Swing | ||||
| Party | Candidate | Votes | % | ± | |
|---|---|---|---|---|---|
| Labour | Guy Barnett | 14,671 | 66.73 | +10.98 | |
| Conservative | J Stuart Thom | 6,150 | 27.97 | -7.39 | |
| Fellowship | Ronald Stephen Mallone | 792 | 3.60 | n/a | |
| Ind. Conservative | Reginald Simmerson | 285 | 1.30 | n/a | |
| Independent | David Davies | 89 | 0.40 | n/a | |
| Turnout | 21,987 | ||||
| Majority | 8,521 | 38.76 | +18.37 | ||
| Labour hold | Swing | ||||
| Party | Candidate | Votes | % | ± | |
|---|---|---|---|---|---|
| Labour | Guy Barnett | 20.164 | 51.29 | ||
| Conservative | Suzette Mary Tremlett Harold | 11,294 | 28.73 | ||
| Liberal | Alastair James Drysdale Wilson | 7,855 | 19.98 | ||
| Majority | 8,870 | 22.56 | |||
| Turnout | 39,313 | 75.01 | |||
| Labour hold | Swing | ||||
| Party | Candidate | Votes | % | ± | |
|---|---|---|---|---|---|
| Labour | Guy Barnett | 19,155 | 55.53 | +4.24 | |
| Conservative | Suzette Mary Tremlett Harold | 9,249 | 26.81 | -1.92 | |
| Liberal | Alastair James Drysdale Wilson | 5,838 | 16.92 | -3.06 | |
| Independent | David Green | 254 | 0.74 | ||
| Majority | 9,906 | 28.72 | |||
| Turnout | 34,496 | 65.29 | |||
| Labour hold | Swing | +3.08 | |||
| Party | Candidate | Votes | % | ± | |
|---|---|---|---|---|---|
| Labour | Guy Barnett | 18,975 | 52.14 | -3.38 | |
| Conservative | Narindar Singh Saroop | 12,133 | 33.34 | +6.53 | |
| Liberal | Graham Howard Knight | 3,870 | 10.64 | -6.29 | |
| National Front | Helena Mary Steven | 951 | 2.61 | ||
| Fellowship | Ronald Stephen Mallone | 460 | 1.26 | ||
| Majority | 6,842 | 18.80 | |||
| Turnout | 36,389 | 70.63 | |||
| Labour hold | Swing | -4.96 | |||
Elections in the 1980s
| Party | Candidate | Votes | % | ± | |
|---|---|---|---|---|---|
| Labour | Guy Barnett | 13,361 | 38.2 | −13.9 | |
| Conservative | Arthur Rolfe | 12,150 | 34.8 | +1.5 | |
| Social Democratic | T. Ford | 8,783 | 25.1 | N/A | |
| BNP | Ian Dell | 259 | 0.7 | N/A | |
| Fellowship | Ronald Mallone | 242 | 0.7 | −0.6 | |
| Communist | F. Hooks | 149 | 0.4 | N/A | |
| Majority | 1,211 | 3.5 | −15.3 | ||
| Turnout | 67.7 | −2.9 | |||
| Labour hold | Swing | ||||
| Party | Candidate | Votes | % | ± | |
|---|---|---|---|---|---|
| Social Democratic | Rosie Barnes | 18,287 | 53.0 | +27.9 | |
| Labour | Deirdre Wood | 11,676 | 33.8 | −4.4 | |
| Conservative | John Antcliffe | 3,852 | 11.2 | −23.6 | |
| Green | Graham Bell | 264 | 0.8 | n/a | |
| Rainbow Dream Ticket | Malcolm Hardee | 124 | 0.3 | n/a | |
| BNP | Ian Dell | 116 | 0.3 | −0.4 | |
| National Front | Joe Pearce | 103 | 0.3 | N/A | |
| Revolutionary Communist | Kate Marshall | 91 | 0.3 | n/a | |
| Majority | 6,611 | 19.2 | +15.7 | ||
| Turnout | 34,513 | 68.2 | |||
| Social Democratic gain from Labour | Swing | +16.2 | |||
| Party | Candidate | Votes | % | ± | |
|---|---|---|---|---|---|
| Social Democratic | Rosie Barnes | 15,149 | 40.6 | +15.5 | |
| Labour | Deirdre Wood | 13,008 | 34.9 | −3.3 | |
| Conservative | John Antcliffe | 8,695 | 23.3 | −11.5 | |
| Green | Jacqueline Thomas | 346 | 0.9 | +0.9 | |
| Fellowship | Ronald Mallone | 59 | 0.2 | −0.5 | |
| Communist | Patricia Clinton | 58 | 0.2 | −0.2 | |
| Majority | 2,141 | 5.7 | +2.3 | ||
| Turnout | 37,315 | 73.4 | +5.7 | ||
| Social Democratic gain from Labour | Swing | +9.4 | |||
- swings relative to 1983 election, not 1987 by-election
Elections in the 1990s
| Party | Candidate | Votes | % | ± | |
|---|---|---|---|---|---|
| Labour | Nick Raynsford | 14,630 | 41.0 | +6.2 | |
| Independent Social Democrat | Rosie Barnes | 13,273 | 37.2 | −3.4 | |
| Conservative | Alison McNair | 6,960 | 19.5 | −3.8 | |
| Green | Robert H.J. McCracken | 483 | 1.4 | +0.4 | |
| Fellowship | Ronald Mallone | 147 | 0.4 | +0.3 | |
| Independent | Malcolm Hardee | 103 | 0.3 | N/A | |
| Natural Law | John D. Small | 70 | 0.2 | N/A | |
| Majority | 1,357 | 3.8 | −1.9 | ||
| Turnout | 35,666 | 74.6 | +1.2 | ||
| Labour gain from Social Democratic | Swing | +4.8 | |||
- The swing for Rosie Barnes is relative to her performance in 1987.
References
- 1 2 Weinstein, Benjamin (2011). Liberalism and Local Government in Early Victorian London. Boydell & Brewer. p. 42. ISBN 9780861933129.
- ↑ Sylvanus Urban, ed. (1851). The Gentleman's Magazine - Volume 36. London: John Bowyers, Nichol & Company. p. 543.
- 1 2 3 4 5 6 Crossick, Geoffrey (2016). An Artisan Elite in Victorian Society: Kentish London 1840-1880. Routledge. ISBN 9781317237419.
- ↑ "Houston Stewart". Legacies of British Slave-ownership. University College London. Retrieved 29 March 2018.
- 1 2 3 4 5 6 7 8 9 10 11 12 13 Craig, F. W. S., ed. (1977). British Parliamentary Election Results 1832-1885 (e-book)
|format=requires|url=(help) (1st ed.). London: Macmillan Press. ISBN 978-1-349-02349-3. - ↑ "To the Independent Electors of the Borough of Greenwich". West Kent Guardian. 23 June 1851. p. 1. Retrieved 29 March 2018 – via British Newspaper Archive. (Subscription required (help)).
- ↑ "'Ili Vronium". The Spectator. 14 February 1852. p. 8. Retrieved 29 March 2018.
- ↑ Newkey-Burden, George William (2011). "The Making of a Victorian Newspaper during a Period of Social Change: 1855 – 1865" (PDF). City Research Online. City, University of London. pp. 120–150. Retrieved 29 March 2018.
- ↑ "Greenwich". Kentish Mercury. 15 July 1865. p. 4. Retrieved 15 February 2018 – via British Newspaper Archive. (Subscription required (help)).
- ↑ "Greenwich". Dundee Courier. 6 November 1868. p. 3. Retrieved 15 February 2018 – via British Newspaper Archive. (Subscription required (help)).
- ↑ "Weekly Notes". North Wales Chronicle. 9 August 1873. p. 4. Retrieved 31 December 2017 – via British Newspaper Archive. (Subscription required (help)).
- ↑ "Re-Construction of the Ministry". Norfolk News. 9 August 1873. pp. 6–7. Retrieved 31 December 2017.
- ↑ "Election Intelligence: Greenwich". Jersey Independent and Daily Telegraph. 31 July 1873. p. 4. Retrieved 31 December 2017 – via British Newspaper Archive. (Subscription required (help)).
- ↑ "Greenwich". The Scotsman. 22 July 1873. p. 4. Retrieved 31 December 2017 – via British Newspaper Archive. (Subscription required (help)).
- ↑ "The Representation of Greenwich". Huddersfield Chronicle. 23 July 1873. p. 4. Retrieved 31 December 2017 – via British Newspaper Archive. (Subscription required (help)).
- ↑ "To the Electors of Guardians of Greenwich". Woolwich Gazette. 5 April 1873. p. 4. Retrieved 31 December 2017 – via British Newspaper Archive. (Subscription required (help)).
- ↑ "The New Tory Candidate". Woolwich Gazette. 23 August 1873. p. 3. Retrieved 31 December 2017 – via British Newspaper Archive. (Subscription required (help)).
- ↑ "Election Intelligence". The Globe. 6 Dec 1884. p. 7. Retrieved 27 November 2017 – via British Newspaper Archive. (Subscription required (help)).
- ↑ "Greenwich Election". Kentish Independent. 27 Mar 1880. p. 5. Retrieved 27 November 2017 – via British Newspaper Archive. (Subscription required (help)).
- 1 2 3 4 5 6 7 8 British Parliamentary Election Results 1885-1918, FWS Craig
- ↑ "The General Election. First Returns., Polls In The Boroughs., Heavy Voting". The Times. 16 November 1922. p. 7.
- ↑ "General Election 1924, Results in Detail". The Times. 31 October 1924. p. i.
- ↑ "General Election 1929, Results in Detail". The Times. 1 June 1929. p. i.
- ↑ "General Election Results 1931". The Times. 29 October 1931. p. i.
- ↑ Kimber, Richard. "UK General Election results 1931". Political Science Resources. Retrieved 15 April 2016.
- ↑ Kimber, Richard. "UK General Election results 1935". Political Science Resources. Retrieved 15 April 2016.
- ↑ Kimber, Richard. "UK General Election results 1945". Political Science Resources. Retrieved 15 April 2016.
- ↑ Kimber, Richard. "UK General Election results 1950". Political Science Resources. Retrieved 15 April 2016.
- ↑ http://tools.assembla.com/svn/grodt/uk/thc/files/marked_up/1950_marked_up.txt
- ↑ Kimber, Richard. "UK General Election results 1951". Political Science Resources. Retrieved 15 April 2016.
- ↑ http://tools.assembla.com/svn/grodt/uk/thc/files/marked_up/1951_marked_up.txt
- ↑ Kimber, Richard. "UK General Election results 1955". Political Science Resources. Retrieved 15 April 2016.
- ↑ http://tools.assembla.com/svn/grodt/uk/thc/files/marked_up/1955_marked_up.txt
- ↑ Kimber, Richard. "UK General Election results 1959". Political Science Resources. Retrieved 15 April 2016.
- ↑ http://tools.assembla.com/svn/grodt/uk/thc/files/marked_up/1959_marked_up.txt
- ↑ Kimber, Richard. "UK General Election results 1964". Political Science Resources. Retrieved 15 April 2016.
- ↑ http://tools.assembla.com/svn/grodt/uk/thc/files/marked_up/1964_marked_up.txt
- ↑ Kimber, Richard. "UK General Election results 1966". Political Science Resources. Retrieved 15 April 2016.
- ↑ http://tools.assembla.com/svn/grodt/uk/thc/files/marked_up/1966_marked_up.txt
- 1 2 3 "'Greenwich', Feb 1974 - May 1983". ElectionWeb Project. Cognitive Computing Limited. Retrieved 22 March 2016.
- ↑ Kimber, Richard. "UK General Election results February 1974". Political Science Resources. Retrieved 22 March 2016.
- ↑ Kimber, Richard. "UK General Election results October 1974". Political Science Resources. Retrieved 22 March 2016.
- ↑ Kimber, Richard. "UK General Election results 1970". Political Science Resources. Retrieved 22 March 2016.
- ↑ "Election Data 1983". Electoral Calculus. Archived from the original on 15 October 2011. Retrieved 28 June 2017.
- ↑ "Election Data 1987". Electoral Calculus. Archived from the original on 15 October 2011. Retrieved 28 June 2017.
- ↑ "Election Data 1992". Electoral Calculus. Archived from the original on 15 October 2011. Retrieved 28 June 2017.
- ↑ "Politics Resources". Election 1992. Politics Resources. 9 April 1992. Retrieved 6 December 2010.
Bibliography
- Leigh Rayment's Historical List of MPs – Constituencies beginning with "G" (part 2)
- British Parliamentary Election Results 1885–1918, compiled and edited by F.W.S. Craig (Macmillan Press 1974)
- Debrett’s Illustrated Heraldic and Biographical House of Commons and the Judicial Bench 1886
- Debrett’s House of Commons and the Judicial Bench 1901
- Debrett’s House of Commons and the Judicial Bench 1918
| Parliament of the United Kingdom | ||
|---|---|---|
| Preceded by Buckinghamshire |
Constituency represented by the Prime Minister 1868–1874 |
Succeeded by Buckinghamshire |