Fulham (UK Parliament constituency)
| Fulham | |
|---|---|
|
Former Borough constituency for the House of Commons | |
| 1885–1918 | |
| Number of members | One |
| Replaced by | Fulham East and Fulham West |
| Created from | Chelsea |
| 1955–1997 | |
| Replaced by | Hammersmith and Fulham |
| Created from | Fulham East and Fulham West |
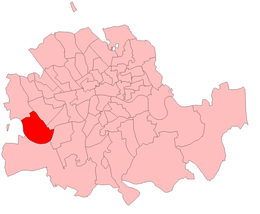
Fulham was a borough constituency centred on the London district of Fulham. It was represented in the House of Commons of the Parliament of the United Kingdom from 1885 until 1918 and from 1955 to 1997.
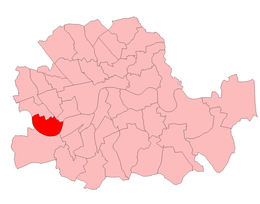
Between 1918 and 1955 it was divided into two constituencies, Fulham East and Fulham West. At the 1997 general election it was replaced by Hammersmith and Fulham.
Boundaries
1955-1974: The Metropolitan Borough of Fulham wards of Hurlingham, Munster, Sands End, Town, and Walham.
1974-1983: The London Borough of Hammersmith wards of Avonmore, Colehill, Crabtree, Gibbs Green, Helford, Margravine, Parsons Green, Sandford, Sherbrooke, Sulivan, and Town.
1983-1997: The London Borough of Hammersmith and Fulham wards of Avonmore, Colehill, Crabtree, Eel Brook, Gibbs Green, Margravine, Normand, Palace, Sands End, Sherbrooke, Sulivan, Town, and Walham.
Members of Parliament
MPs 1885-1918
| Election | Member | Party | |
|---|---|---|---|
| 1885 | William Fisher | Conservative | |
| 1906 | Timothy Davies | Liberal | |
| 1910 | William Fisher | Conservative | |
| 1918 | constituency abolished: see Fulham East and Fulham West | ||
MPs 1955-1997
| Election | Member | Party | Notes | |
|---|---|---|---|---|
| 1955 | Michael Stewart | Labour | ||
| 1979 | Martin Stevens | Conservative | Died 1986 | |
| 1986 b-e | Nick Raynsford | Labour | ||
| 1987 | Matthew Carrington | Conservative | ||
| 1997 | constituency abolished: see Hammersmith and Fulham | |||
Elections
Elections in the 1880s
| Party | Candidate | Votes | % | ± | |
|---|---|---|---|---|---|
| Conservative | William Fisher | 2,642 | 50.5 | N/A | |
| Liberal | George W. E. Russell | 2,590 | 49.5 | N/A | |
| Majority | 52 | 1.0 | N/A | ||
| Turnout | 5,232 | 80.5 | N/A | ||
| Registered electors | 6,499 | ||||
| Conservative win (new seat) | |||||
| Party | Candidate | Votes | % | ± | |
|---|---|---|---|---|---|
| Conservative | William Fisher | 2,557 | 53.2 | +2.7 | |
| Liberal | George W. E. Russell | 2,247 | 46.8 | -2.7 | |
| Majority | 310 | 6.4 | +5.4 | ||
| Turnout | 4,804 | 73.9 | -6.6 | ||
| Registered electors | 6,499 | ||||
| Conservative hold | Swing | +2.7 | |||
Elections in the 1890s
| Party | Candidate | Votes | % | ± | |
|---|---|---|---|---|---|
| Conservative | William Fisher | 4,365 | 51.2 | -2.0 | |
| Liberal | William David Barnett | 4,154 | 48.8 | +2.0 | |
| Majority | 211 | 2.4 | -4.0 | ||
| Turnout | 8,519 | 75.6 | +1.7 | ||
| Registered electors | 11,266 | ||||
| Conservative hold | Swing | -2.0 | |||
.jpg)
| Party | Candidate | Votes | % | ± | |
|---|---|---|---|---|---|
| Conservative | William Fisher | 5,378 | 56.7 | +5.5 | |
| Liberal | Edwin Cornwall | 3,915 | 41.2 | -7.6 | |
| Ind. Labour Party | William Parnell | 196 | 2.1 | N/A | |
| Majority | 1,463 | 15.5 | +13.1 | ||
| Turnout | 9,489 | 74.6 | -1.0 | ||
| Registered electors | 12,716 | ||||
| Conservative hold | Swing | +6.6 | |||
Elections in the 1900s
| Party | Candidate | Votes | % | ± | |
|---|---|---|---|---|---|
| Conservative | William Fisher | 6,541 | 60.6 | +3.9 | |
| Liberal | Edwin Cornwall | 4,247 | 39.4 | −1.8 | |
| Majority | 2,294 | 21.2 | +5.7 | ||
| Turnout | 10,788 | 65.0 | −9.6 | ||
| Registered electors | 16,600 | ||||
| Conservative hold | Swing | +2.8 | |||
| Party | Candidate | Votes | % | ± | |
|---|---|---|---|---|---|
| Liberal | Timothy Davies | 8,037 | 52.0 | +12.6 | |
| Conservative | William Fisher | 7,407 | 48.0 | −12.6 | |
| Majority | 630 | 4.0 | N/A | ||
| Turnout | 15,444 | 74.9 | +9.9 | ||
| Registered electors | 20,620 | ||||
| Liberal gain from Conservative | Swing | +12.6 | |||
Elections in the 1910s
| Party | Candidate | Votes | % | ± | |
|---|---|---|---|---|---|
| Conservative | William Fisher | 9,690 | 55.5 | +7.5 | |
| Liberal | Fitzroy Hemphill | 7,761 | 44.5 | -7.5 | |
| Majority | 1,929 | 11.0 | 15.0 | ||
| Turnout | 83.1 | +8.2 | |||
| Conservative gain from Liberal | Swing | +7.5 | |||
| Party | Candidate | Votes | % | ± | |
|---|---|---|---|---|---|
| Conservative | William Fisher | 8,252 | 55.8 | +0.3 | |
| Liberal | Sylvain Mayer | 6,526 | 44.2 | -0.3 | |
| Majority | 1,726 | 11.6 | +0.6 | ||
| Turnout | 70.3 | ||||
| Conservative hold | Swing | +0.3 | |||
| Party | Candidate | Votes | % | ± | |
|---|---|---|---|---|---|
| Unionist | William Fisher | Unopposed | |||
| Unionist hold | |||||
Elections in the 1950s
| Party | Candidate | Votes | % | ± | |
|---|---|---|---|---|---|
| Labour | Michael Stewart | 23,972 | 55.04 | ||
| Conservative | Mabel Lilian de la Motte | 19,578 | 44.96 | ||
| Majority | 4,394 | 10.09 | |||
| Turnout | 78.65 | ||||
| Labour win | |||||
| Party | Candidate | Votes | % | ± | |
|---|---|---|---|---|---|
| Labour | Michael Stewart | 21,525 | 53.67 | ||
| Conservative | Mabel Lilian de la Motte | 18,581 | 46.33 | ||
| Majority | 2,944 | 7.34 | |||
| Turnout | 77.00 | ||||
| Labour hold | Swing | ||||
Elections in the 1960s
| Party | Candidate | Votes | % | ± | |
|---|---|---|---|---|---|
| Labour | Michael Stewart | 19,788 | 57.04 | ||
| Conservative | Michael Grylls | 14,842 | 42.78 | ||
| Patriotic Party | Arthur Rossi Braybrooke | 63 | 0.18 | ||
| Majority | 4,946 | 14.26 | |||
| Turnout | 72.06 | ||||
| Labour hold | Swing | ||||
| Party | Candidate | Votes | % | ± | |
|---|---|---|---|---|---|
| Labour | Michael Stewart | 20,080 | 58.31 | ||
| Conservative | Michael Grylls | 13,094 | 38.03 | ||
| Independent Liberal | Elisa Sheriff | 716 | 2.08 | ||
| Communist | Peter Robson | 256 | 0.74 | ||
| Radical Alliance | Pat Arrowsmith | 163 | 0.47 | ||
| Patriotic Party | Arthur Rossi Braybrooke | 126 | 0.37 | ||
| Majority | 6,986 | 20.29 | |||
| Turnout | 76.38 | ||||
| Labour hold | Swing | ||||
Elections in the 1970s
| Party | Candidate | Votes | % | ± | |
|---|---|---|---|---|---|
| Labour | Michael Stewart | 16,312 | 55.01 | ||
| Conservative | Ian Mactaggart | 12,807 | 43.19 | ||
| Radical Alliance | Pat Arrowsmith | 421 | 1.42 | ||
| Anti-Election | Roger Moody | 112 | 0.38 | ||
| Majority | 3,505 | 11.82 | |||
| Turnout | 68.78 | ||||
| Labour hold | Swing | ||||
| Party | Candidate | Votes | % | ± | |
|---|---|---|---|---|---|
| Labour | Michael Stewart | 20,995 | 46.13 | ||
| Conservative | Martin Stevens | 17,446 | 38.33 | ||
| Liberal | GA Dowden | 6,105 | 13.41 | ||
| National Front | H Smithies | 966 | 2.12 | ||
| Majority | 3,549 | 7.80 | |||
| Turnout | 78.53 | ||||
| Labour hold | Swing | ||||
| Party | Candidate | Votes | % | ± | |
|---|---|---|---|---|---|
| Labour | Michael Stewart | 20,616 | 49.87 | ||
| Conservative | Martin Stevens | 15,295 | 37.00 | ||
| Liberal | GA Dowden | 4,577 | 11.07 | ||
| National Front | J Cordrey | 855 | 2.07 | ||
| Majority | 5,321 | 12.87 | |||
| Turnout | 71.44 | ||||
| Labour hold | Swing | ||||
| Party | Candidate | Votes | % | ± | |
|---|---|---|---|---|---|
| Conservative | Martin Stevens | 20,249 | 46.68 | ||
| Labour | BJ Stead | 18,750 | 43.22 | ||
| Liberal | David Rendel | 3,882 | 8.95 | ||
| National Front | R Pearce | 478 | 0.99 | ||
| Majority | 1,499 | 3.46 | |||
| Turnout | 76.05 | ||||
| Conservative gain from Labour | Swing | ||||
Elections in the 1980s
| Party | Candidate | Votes | % | ± | |
|---|---|---|---|---|---|
| Conservative | Martin Stevens | 18,204 | 46.18 | -0.52 | |
| Labour | A Powell | 13,415 | 34.03 | -9.19 | |
| Liberal | David Rendel | 9,174 | 18.25 | +9.30 | |
| Ecology | Janet Grimes | 277 | 0.70 | N/A | |
| National Front | R Pearce | 229 | 0.58 | -0.57 | |
| Independent Liberal | J Keats | 102 | 0.26 | N/A | |
| Majority | 4,798 | 12.15 | +8.69 | ||
| Turnout | 39,421 | 76.05 | -0.03 | ||
| Conservative hold | Swing | ||||
| Party | Candidate | Votes | % | ± | |
|---|---|---|---|---|---|
| Labour | Nick Raynsford | 16,451 | 43.20 | +9.17 | |
| Conservative | Matthew Carrington | 12,948 | 34.00 | -12.18 | |
| Social Democratic | Roger Liddle | 6,953 | 18.26 | +0.01 | |
| England Demands Repatriation | Jane Birdwood | 226 | 0.59 | N/A | |
| Monster Raving Loony | David Sutch | 134 | 0.35 | N/A | |
| Connoisseur Wine Party | John Creighton | 127 | 0.33 | N/A | |
| Democratic Rights for Northern Ireland | James Black | 98 | 0.26 | N/A | |
| Fellowship | Geoffrey Rolph | 39 | 0.1 | N/A | |
| Humanist | Jon Swinden | 38 | 0.1 | N/A | |
| Captain Rainbows Universal Party | Liza Duke | 37 | 0.1 | N/A | |
| All Party Anti-Common Market | Reginald Simmerson | 33 | 0.09 | N/A | |
| Majority | 3,503 | 9.2 | |||
| Turnout | 38,084 | ||||
| Labour gain from Conservative | Swing | ||||
| Party | Candidate | Votes | % | ± | |
|---|---|---|---|---|---|
| Conservative | Matthew Carrington | 21,752 | 51.78 | +5.60 | |
| Labour | Nick Raynsford | 15,430 | 36.73 | +2.70 | |
| Social Democratic | Paul Marshall | 4,365 | 10.39 | -7.86 | |
| Green | Janet Grimes | 465 | 1.11 | +0.41 | |
| Majority | 6,322 | 15.05 | +2.90 | ||
| Turnout | 42,012 | 77.09 | |||
| Conservative hold | Swing | ||||
Elections in the 1990s
| Party | Candidate | Votes | % | ± | |
|---|---|---|---|---|---|
| Conservative | Matthew Carrington | 21,438 | 53.4 | +1.6 | |
| Labour | Nick P. Moore | 14,859 | 37.0 | +0.3 | |
| Liberal Democrat | Peter M. Crystal | 3,339 | 8.3 | −2.1 | |
| Green | Elizabeth G.A. Streeter | 443 | 1.1 | 0.0 | |
| Natural Law | John V. Darby | 91 | 0.2 | +0.2 | |
| Majority | 6,579 | 16.4 | +1.3 | ||
| Turnout | 40,170 | 75.9 | −1.2 | ||
| Conservative hold | Swing | +0.7 | |||
References
- ↑ British Parliamentary Election Results 1885-1918, FWS Craig
- ↑ British Parliamentary Election Results 1885-1918, FWS Craig
- ↑ British Parliamentary Election Results 1885-1918, FWS Craig
- ↑ British Parliamentary Election Results 1885-1918, FWS Craig
- ↑ British Parliamentary Election Results 1885-1918, FWS Craig
- ↑ British Parliamentary Election Results 1885-1918, FWS Craig
- ↑ British Parliamentary Election Results 1885-1918, FWS Craig
- ↑ British Parliamentary Election Results 1885-1918, FWS Craig
- ↑ British Parliamentary Election Results 1885-1918, FWS Craig
- ↑ "Election Data 1983". Electoral Calculus. Archived from the original on 15 October 2011. Retrieved 28 June 2017.
- ↑ "Election Data 1987". Electoral Calculus. Archived from the original on 15 October 2011. Retrieved 28 June 2017.
- ↑ "Election Data 1992". Electoral Calculus. Archived from the original on 15 October 2011. Retrieved 28 June 2017.
- ↑ "Politics Resources". Election 1992. Politics Resources. 9 April 1992. Retrieved 6 Dec 2010.
- Leigh Rayment's Historical List of MPs – Constituencies beginning with "F"
- British Parliamentary Election Results 1885-1918, compiled and edited by F.W.S. Craig (Macmillan Press 1974)
- Debrett’s Illustrated Heraldic and Biographical House of Commons and the Judicial Bench 1886
- Debrett’s House of Commons and the Judicial Bench 1901
- Debrett’s House of Commons and the Judicial Bench 1918