Simcoe North
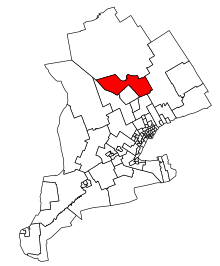 Simcoe North in relation to southern Ontario ridings (2003 boundaries) | |||
| Federal electoral district | |||
| Legislature | House of Commons | ||
| MP |
Conservative | ||
| District created | 1867 | ||
| First contested | 1867 | ||
| Last contested | 2015 | ||
| District webpage | profile, map | ||
| Demographics | |||
| Population (2011)[1] | 108,672 | ||
| Electors (2015) | 85,156 | ||
| Area (km²)[2] | 1,894 | ||
| Pop. density (per km²) | 57.4 | ||
| Census divisions | Simcoe County | ||
| Census subdivisions | Midland, Orillia, Oro-Medonte, Penetanguishene, Tay, Tiny, Christian Island 30, Christian Island 30A, Severn, Ramara, Mnjikaning First Nation | ||
Simcoe North (French: Simcoe-Nord) is a federal electoral district in central Ontario, Canada. It was established as a federal riding in 1867.
Demographics
- According to the Canada 2011 Census; 2013 representation[3][4]
Ethnic groups: 87.8% White, 9.6% Aboriginal
Languages: 90.2% English, 4.0% French, 1.4% German
Religions: 71.6% Christian (29.4% Catholic, 12.3% United Church, 10.0% Anglican, 5.2% Presbyterian, 2.9% Baptist, 1.2% Lutheran, 1.1% Pentecostal, 9.6% Other Christian), 26.9% None.
Median income: $28,203 (2010)
Average income: $36,463 (2010)
Geography
The district includes all of the north and eastern parts of Simcoe County. Municipalities and Indian reserves include Midland, Orillia, Penetanguishene, Tay, Tiny, Christian Island 30, Christian Island 30A, Severn, Ramara, Oro-Medonte (part) and Mnjikaning First Nation The area is 1,984 km2.
History
The electoral district was created in 1867 by the British North America Act. In 1867, it included the townships of Nottawasaga, Sunnidale, Vespra, Flos, Oro, Medonte, Orillia and Matchedash, Tiny and Tay, Balaklava and Robinson, and the Towns of Barrie and Collingwood. In 1882, it lost Oro, Medonte, Orillia and Matchedash, Tiny and Tay, and Balaklava and Robinson. In 1903, it gained Oro, but lost Barrie. In 1947, it lost Oro and gained Barrie. In 1966, it lost Nottawasaga, Sunnidale and Flos and gained Penetanguishene, Matchedash, Medonte, Orillia, Oro, and Tay. In 1976, it gained the townships of Mara, Rama and Tiny but Lost Barrie and Vespra. In 1987, it gained Flos Township, only to lose it again in the 1996 redistribution. In the 2003 redistribution, its southern boundary was altered slightly to follow the boundary of the new municipality of Springwater in neighbouring Simcoe—Grey with the municipalities of Oro-Medonte, Tiny and Tay in Simcoe North. In 2013, the riding lost all of Oro-Medonte west of 9 Line.
Riding associations
Riding associations are the local branches of the national political parties:
| Party | Association Name | CEO | HQ Address | HQ City | |
| Christian Heritage Party of Canada | Simcoe North Riding Association CHP | Adrian Kooger | 201-390 Sundial Drive | Orillia | |
| Conservative Party of Canada | Simcoe North Conservative Association | Marnie MacDougall | 352 Tiny Beaches Road South | Perkinsfield | |
| Liberal Party of Canada | Simcoe North Federal Liberal Association | Ryan Douglas Barber | 520 Harvie Settlement Road | Orillia | |
| New Democratic Party | Simcoe North Federal NDP Riding Association | Darin Kennedy | 1684 Quarry Rd RR1 | Coldwater | |
| Green | Simcoe North Federal Green Party Association | Alec Adams | 309-30 Museum Drive | Orillia | |
Members of Parliament
Simcoe North has elected the following Members of Parliament to represent it in the House of Commons of Canada:
Election results
| Canadian federal election, 2015 | ||||||||
|---|---|---|---|---|---|---|---|---|
| Party | Candidate | Votes | % | ±% | Expenditures | |||
| Conservative | Bruce Stanton | 24,836 | 43.52 | -10.36 | $91,741.02 | |||
| Liberal | Liz Riley | 22,718 | 39.81 | +20.56 | $74,044.17 | |||
| New Democratic | Richard Banigan | 6,037 | 10.58 | -9.85 | $3,879.75 | |||
| Green | Peter Stubbins | 2,543 | 4.46 | -1.4 | $11,996.03 | |||
| No affiliation1 | Jacob Kearey-Moreland | 618 | 1.08 | – | $2,744.47 | |||
| Christian Heritage | Scott Whittaker | 319 | 0.56 | -0.02 | $2,753.34 | |||
| Total valid votes/Expense limit | 57,071 | 100.0 | $224,845.90 | |||||
| Total rejected ballots | 189 | – | – | |||||
| Turnout | 57,260 | – | – | |||||
| Eligible voters | 86,859 | |||||||
| Source: Elections Canada[5][6] 1 Cooperative Interdependent | ||||||||
| 2011 federal election redistributed results[7] | |||
|---|---|---|---|
| Party | Vote | % | |
| Conservative | 27,796 | 53.88 | |
| New Democratic | 10,540 | 20.43 | |
| Liberal | 9,932 | 19.25 | |
| Green | 3,021 | 5.86 | |
| Christian Heritage | 301 | 0.58 | |
| Canadian federal election, 2011 | ||||||||
|---|---|---|---|---|---|---|---|---|
| Party | Candidate | Votes | % | ±% | Expenditures | |||
| Conservative | Bruce Stanton | 31,581 | 54.5 | +4.8 | – | |||
| New Democratic | Richard Banigan | 11,515 | 19.9 | +8.2 | – | |||
| Liberal | Steve Clarke | 11,090 | 19.1 | -8.6 | – | |||
| Green | Valerie Powell | 3,489 | 6.0 | -5.0 | – | |||
| Christian Heritage | Adrian Kooger | 322 | 0.6 | – | – | |||
| Total valid votes/Expense limit | 57,997 | 100.0 | ||||||
| Total rejected ballots | 161 | 0.3 | – | |||||
| Turnout | 58,158 | 64.9 | – | |||||
| Eligible voters | 89,588 | – | – | |||||
| Canadian federal election, 2008 | ||||||||
|---|---|---|---|---|---|---|---|---|
| Party | Candidate | Votes | % | ±% | Expenditures | |||
| Conservative | Bruce Stanton | 26,328 | 49.7 | +9.3 | $84,616 | |||
| Liberal | Steve Clarke | 14,670 | 27.7 | -10.7 | $87,766 | |||
| New Democratic | Richard Banigan | 6,207 | 11.7 | -2.4 | $6,265 | |||
| Green | Valerie Powell | 5,820 | 11.0 | +5.0 | $26,424 | |||
| Total valid votes/Expense limit | 53,025 | 100.0 | $90,754 | |||||
Note: Results are preliminary as of 18 October 2008.
| Canadian federal election, 2006 | ||||||||
|---|---|---|---|---|---|---|---|---|
| Party | Candidate | Votes | % | ±% | ||||
| Conservative | Bruce Stanton | 23,266 | 40.4 | +2.7 | ||||
| Liberal | Karen Graham | 22,078 | 38.4 | -5.0 | ||||
| New Democratic | Jen Hill | 8,132 | 14.1 | +2.8 | ||||
| Green | Sandy Agnew | 3,451 | 6.0 | -0.4 | ||||
| Christian Heritage | Adrian Kooger | 617 | 1.1 | +0.1 | ||||
| Total valid votes | 57,544 | 100.0 | ||||||
| Canadian federal election, 2004 | ||||||||
|---|---|---|---|---|---|---|---|---|
| Party | Candidate | Votes | % | ±% | ||||
| Liberal | Paul Devillers | 23,664 | 43.4 | -7.4 | ||||
| Conservative | Peter Stock | 20,570 | 37.7 | -6.2 | ||||
| New Democratic | Jen Hill | 6,162 | 11.3 | +6.6 | ||||
| Green | Mary Lou Kirby | 3,486 | 6.4 | |||||
| Christian Heritage | Adrian Kooger | 544 | 1.0 | +0.4 | ||||
| Canadian Action | Ian Woods | 145 | 0.3 | |||||
| Total valid votes | 54,571 | 100.0 | ||||||
Note: Conservative vote is compared to the total of the Canadian Alliance vote and Progressive Conservative vote in 2000 election.
| Canadian federal election, 2000 | ||||||||
|---|---|---|---|---|---|---|---|---|
| Party | Candidate | Votes | % | ±% | ||||
| Liberal | Paul Devillers | 24,510 | 50.8 | +6.4 | ||||
| Alliance | Peter Stock | 14,283 | 29.6 | +1.6 | ||||
| Progressive Conservative | Lucy Stewart | 6,914 | 14.3 | -6.8 | ||||
| New Democratic | Ann Billings | 2,272 | 4.7 | -0.1 | ||||
| Independent | Adrian P. Kooger | 305 | 0.6 | |||||
| Total valid votes | 48,284 | 100.0 | ||||||
Note: Canadian Alliance vote is compared to the Reform vote in 1997 election.
| Canadian federal election, 1997 | ||||||||
|---|---|---|---|---|---|---|---|---|
| Party | Candidate | Votes | % | ±% | ||||
| Liberal | Paul Devillers | 22,775 | 44.4 | +3.9 | ||||
| Reform | Peter Stock | 14,363 | 28.0 | -2.8 | ||||
| Progressive Conservative | Sharon Henry | 10,849 | 21.1 | -2.0 | ||||
| New Democratic | Ann Billings | 2,488 | 4.8 | +1.4 | ||||
| Green | Adam Mazzara | 388 | 0.8 | |||||
| Natural Law | Peter Cameron | 230 | 0.4 | -0.1 | ||||
| Canadian Action | Gloria Earl | 213 | 0.4 | |||||
| Total valid votes | 51,306 | 100.0 | ||||||
| Canadian federal election, 1993 | ||||||||
|---|---|---|---|---|---|---|---|---|
| Party | Candidate | Votes | % | ±% | ||||
| Liberal | Paul Devillers | 23,047 | 40.5 | +2.7 | ||||
| Reform | Ray Lyons | 17,498 | 30.8 | |||||
| Progressive Conservative | Doug Lewis | 13,145 | 23.1 | -20.9 | ||||
| New Democratic | Marsha Mitzak | 1,958 | 3.4 | -14.7 | ||||
| National | Brian Stewart | 845 | 1.5 | |||||
| Natural Law | Garry Foster | 300 | 0.5 | |||||
| Abolitionist | Bobby-Joe Edwards | 67 | 0.1 | |||||
| Total valid votes | 56,860 | 100.0 | ||||||
| Canadian federal election, 1988 | ||||||||
|---|---|---|---|---|---|---|---|---|
| Party | Candidate | Votes | % | ±% | ||||
| Progressive Conservative | Doug Lewis | 21,847 | 44.0 | -10.9 | ||||
| Liberal | Alan Martin | 18,755 | 37.8 | +11.2 | ||||
| New Democratic | Mike McMurter | 8,995 | 18.1 | +1.0 | ||||
| Total valid votes | 49,597 | 100.0 | ||||||
| Canadian federal election, 1984 | ||||||||
|---|---|---|---|---|---|---|---|---|
| Party | Candidate | Votes | % | ±% | ||||
| Progressive Conservative | Doug Lewis | 24,887 | 55.0 | +18.5 | ||||
| Liberal | Alan Martin | 12,062 | 26.6 | -9.6 | ||||
| New Democratic | Tim Tynan | 7,742 | 17.1 | -10.2 | ||||
| Green | John Brandon Letts | 362 | 0.8 | |||||
| Libertarian | Ian Mcteer | 229 | 0.5 | |||||
| Total valid votes | 45,282 | 100.0 | ||||||
| Canadian federal election, 1980 | ||||||||
|---|---|---|---|---|---|---|---|---|
| Party | Candidate | Votes | % | ±% | ||||
| Progressive Conservative | Doug Lewis | 14,874 | 36.4 | -10.0 | ||||
| Liberal | Alan Martin | 14,808 | 36.3 | +9.7 | ||||
| New Democratic | Fayne Bullen | 11,139 | 27.3 | +0.3 | ||||
| Total valid votes | 40,821 | 100.0 | ||||||
| Canadian federal election, 1979 | ||||||||
|---|---|---|---|---|---|---|---|---|
| Party | Candidate | Votes | % | ±% | ||||
| Progressive Conservative | Doug Lewis | 19,388 | 46.4 | +6.2 | ||||
| New Democratic | Fayne Bullen | 11,284 | 27.0 | +4.7 | ||||
| Liberal | Walter Connell | 11,099 | 26.6 | +4.3 | ||||
| Total valid votes | 41,771 | 100.0 | ||||||
| Canadian federal election, 1974 | ||||||||
|---|---|---|---|---|---|---|---|---|
| Party | Candidate | Votes | % | ±% | ||||
| Progressive Conservative | P.B. Rynard | 18,950 | 40.2 | -7.7 | ||||
| Liberal | Janice Laking | 17,068 | 36.2 | +3.7 | ||||
| New Democratic | Fayne Bullen | 10,502 | 22.3 | +2.8 | ||||
| Independent | Stephen Ridley | 330 | 0.7 | |||||
| Social Credit | Bruce Arnold | 267 | 0.6 | |||||
| Total valid votes | 47,117 | 100.0 | ||||||
| Canadian federal election, 1972 | ||||||||
|---|---|---|---|---|---|---|---|---|
| Party | Candidate | Votes | % | ±% | ||||
| Progressive Conservative | P.B. Rynard | 22,145 | 47.9 | +2.1 | ||||
| Liberal | Bruce Owen | 15,038 | 32.6 | -8.6 | ||||
| New Democratic | Rich Partridge | 9,016 | 19.5 | +6.5 | ||||
| Total valid votes | 46,199 | 100.0 | ||||||
| Canadian federal election, 1968 | ||||||||
|---|---|---|---|---|---|---|---|---|
| Party | Candidate | Votes | % | ±% | ||||
| Progressive Conservative | P.B. Rynard | 16,619 | 45.8 | +0.3 | ||||
| Liberal | Bill A. Bell | 14,936 | 41.2 | 0.0 | ||||
| New Democratic | Charles Perrie Rintoul | 4,730 | 13.0 | +5.0 | ||||
| Total valid votes | 36,285 | 100.0 | ||||||
| Canadian federal election, 1965 | ||||||||
|---|---|---|---|---|---|---|---|---|
| Party | Candidate | Votes | % | ±% | ||||
| Progressive Conservative | Heber Smith | 9,513 | 45.5 | -0.4 | ||||
| Liberal | Bill Bell | 8,590 | 41.1 | +3.3 | ||||
| New Democratic | Ed Genge | 1,677 | 8.0 | -0.8 | ||||
| Social Credit | Mel Rowat | 1,109 | 5.3 | -3.6 | ||||
| Total valid votes | 20,889 | 100.0 | ||||||
| Canadian federal election, 1963 | ||||||||
|---|---|---|---|---|---|---|---|---|
| Party | Candidate | Votes | % | ±% | ||||
| Progressive Conservative | Heber Smith | 10,157 | 45.9 | -12.2 | ||||
| Liberal | Ralph Snelgrove | 8,374 | 37.8 | +7.1 | ||||
| Social Credit | Williard Kinzie | 1,961 | 8.9 | -2.4 | ||||
| New Democratic | Russell Pogue | 963 | 4.4 | |||||
| Independent Conservative | Jack Browne | 678 | 3.1 | |||||
| Total valid votes | 22,133 | 100.0 | ||||||
| Canadian federal election, 1962 | ||||||||
|---|---|---|---|---|---|---|---|---|
| Party | Candidate | Votes | % | ±% | ||||
| Progressive Conservative | Heber Smith | 11,728 | 58.1 | -12.1 | ||||
| Liberal | Hank Howard | 6,210 | 30.7 | +0.9 | ||||
| New Democratic | Russell Pogue | 2,265 | 11.2 | |||||
| Total valid votes | 20,203 | 100.0 | ||||||
| Canadian federal election, 1958 | ||||||||
|---|---|---|---|---|---|---|---|---|
| Party | Candidate | Votes | % | ±% | ||||
| Progressive Conservative | Heber Smith | 13,855 | 70.2 | +7.7 | ||||
| Liberal | William S. Campbell | 5,890 | 29.8 | -7.7 | ||||
| Total valid votes | 19,745 | 100.0 | ||||||
| Canadian federal election, 1957 | ||||||||
|---|---|---|---|---|---|---|---|---|
| Party | Candidate | Votes | % | ±% | ||||
| Progressive Conservative | Heber Smith | 11,437 | 62.5 | +10.9 | ||||
| Liberal | William Seymour Campbell | 6,860 | 37.5 | -10.9 | ||||
| Total valid votes | 18,297 | 100.0 | ||||||
| Canadian federal election, 1953 | ||||||||
|---|---|---|---|---|---|---|---|---|
| Party | Candidate | Votes | % | ±% | ||||
| Progressive Conservative | Julian Harcourt Ferguson | 8,316 | 51.6 | +1.6 | ||||
| Liberal | Ralph Trapnell Snelgrove | 7,796 | 48.4 | +5.2 | ||||
| Total valid votes | 16,112 | 100.0 | ||||||
| Canadian federal election, 1949 | ||||||||
|---|---|---|---|---|---|---|---|---|
| Party | Candidate | Votes | % | ±% | ||||
| Progressive Conservative | Julian Harcourt Ferguson | 7,658 | 50.0 | -3.0 | ||||
| Liberal | J. Gladstone Currie | 6,613 | 43.2 | +2.7 | ||||
| Co-operative Commonwealth | Reginald Edward Ayres | 1,053 | 6.9 | +0.3 | ||||
| Total valid votes | 15,324 | 100.0 | ||||||
| Canadian federal election, 1945 | ||||||||
|---|---|---|---|---|---|---|---|---|
| Party | Candidate | Votes | % | ±% | ||||
| Progressive Conservative | Julian Harcourt Ferguson | 8,251 | 52.9 | +7.0 | ||||
| Liberal | Duncan Fletcher McCuaig | 6,309 | 40.5 | -13.6 | ||||
| Co-operative Commonwealth | Arthur Eric Cresswell | 1,027 | 6.6 | |||||
| Total valid votes | 15,587 | 100.0 | ||||||
Note: Progressive Conservative vote is compared to "National Government" vote in 1940 election.
| Canadian federal election, 1940 | ||||||||
|---|---|---|---|---|---|---|---|---|
| Party | Candidate | Votes | % | ±% | ||||
| Liberal | Duncan Fletcher McCuaig | 7,096 | 54.1 | +4.0 | ||||
| National Government | Frederick Aylsworth Brock | 6,030 | 45.9 | +9.4 | ||||
| Total valid votes | 13,126 | 100.0 | ||||||
Note: "National Government" vote is compared to Conservative vote in 1935 election.
| Canadian federal election, 1935 | ||||||||
|---|---|---|---|---|---|---|---|---|
| Party | Candidate | Votes | % | ±% | ||||
| Liberal | Duncan Fletcher McCuaig | 7,244 | 50.1 | |||||
| Conservative | John Thomas Simpson | 5,290 | 36.6 | -16.5 | ||||
| Reconstruction | Herbert James Crawford | 1,324 | 9.2 | |||||
| Co-operative Commonwealth | Seymour Cornwall Cooper | 608 | 4.2 | |||||
| Total valid votes | 14,466 | 100.0 | ||||||
| Canadian federal election, 1930 | ||||||||
|---|---|---|---|---|---|---|---|---|
| Party | Candidate | Votes | % | ±% | ||||
| Conservative | John Thomas Simpson | 7,295 | 53.0 | +2.3 | ||||
| Progressive | Ernest Charles Drury | 6,459 | 47.0 | -2.3 | ||||
| Total valid votes | 13,754 | 100.0 | ||||||
| Canadian federal election, 1926 | ||||||||
|---|---|---|---|---|---|---|---|---|
| Party | Candidate | Votes | % | ±% | ||||
| Conservative | William Alves Boys | 7,058 | 50.7 | -1.5 | ||||
| Progressive | Ernest Charles Drury | 6,865 | 49.3 | +1.5 | ||||
| Total valid votes | 13,923 | 100.0 | ||||||
| Canadian federal election, 1925 | ||||||||
|---|---|---|---|---|---|---|---|---|
| Party | Candidate | Votes | % | ±% | ||||
| Conservative | William Alves Boys | 6,885 | 52.2 | +8.7 | ||||
| Progressive | Ernest Drury | 6,295 | 47.8 | -3.6 | ||||
| Total valid votes | 13,180 | 100.0 | ||||||
| Canadian federal election, 1921 | ||||||||
|---|---|---|---|---|---|---|---|---|
| Party | Candidate | Votes | % | ±% | ||||
| Progressive | Thomas Edwin Ross | 5,298 | 51.4 | |||||
| Conservative | John Allister Currie | 4,489 | 43.5 | -21.4 | ||||
| Independent | William John Holden | 527 | 5.1 | |||||
| Total valid votes | 10,314 | 100.0 | ||||||
Note: Conservative vote is compared to Government vote in 1917 election.
| Canadian federal election, 1917 | ||||||||
|---|---|---|---|---|---|---|---|---|
| Party | Candidate | Votes | % | ±% | ||||
| Government (Unionist) | John Allister Currie | 4,240 | 64.9 | +13.2 | ||||
| Opposition (Laurier Liberals) | Ernest Drury | 2,293 | 35.1 | -13.2 | ||||
| Total valid votes | 6,533 | 100.0 | ||||||
Note: Government vote is compared to Conservative vote in 1911 election, and Opposition vote is compared to Liberal vote.
| Canadian federal election, 1911 | ||||||||
|---|---|---|---|---|---|---|---|---|
| Party | Candidate | Votes | % | ±% | ||||
| Conservative | John Allister Currie | 2,648 | 51.7 | +1.2 | ||||
| Liberal | Leighton Goldie McCarthy | 2,476 | 48.3 | -1.2 | ||||
| Total valid votes | 5,124 | 100.0 | ||||||
| Canadian federal election, 1908 | ||||||||
|---|---|---|---|---|---|---|---|---|
| Party | Candidate | Votes | % | ±% | ||||
| Conservative | John Allister Currie | 2,756 | 50.5 | +0.9 | ||||
| Liberal | Daniel Wilson | 2,705 | 49.5 | |||||
| Total valid votes | 5,461 | 100.0 | ||||||
| Canadian federal election, 1904 | ||||||||
|---|---|---|---|---|---|---|---|---|
| Party | Candidate | Votes | % | ±% | ||||
| Independent | Leighton Goldie McCarthy | 2,486 | 50.4 | -6.2 | ||||
| Conservative | John Allister Currie | 2,444 | 49.6 | +6.2 | ||||
| Total valid votes | 4,930 | 100.0 | ||||||
| Canadian federal election, 1900 | ||||||||
|---|---|---|---|---|---|---|---|---|
| Party | Candidate | Votes | % | ±% | ||||
| Independent | Leighton Goldie McCarthy | 2,524 | 56.6 | |||||
| Conservative | Charles Cameron | 1,936 | 43.4 | +25.2 | ||||
| Total valid votes | 4,460 | 100.0 | ||||||
Note: popular vote compared to vote in 1896 general election.
| By-election on 14 December 1898
On Mr. McCarthy's death, 11 May 1898 | |||||
| Party | Candidate | Votes | |||
|---|---|---|---|---|---|
| Independent | Leighton Goldie McCarthy | elected | |||
| Canadian federal election, 1896 | ||||||||
|---|---|---|---|---|---|---|---|---|
| Party | Candidate | Votes | % | ±% | ||||
| McCarthyite | Dalton McCarthy | 2,517 | 52.4 | -0.8 | ||||
| Liberal | Elihu Stewart | 1,410 | 29.4 | -17.4 | ||||
| Conservative | Houghton Lennox | 875 | 18.2 | |||||
| Total valid votes | 4,802 | 100.0 | ||||||
| Canadian federal election, 1891 | ||||||||
|---|---|---|---|---|---|---|---|---|
| Party | Candidate | Votes | % | ±% | ||||
| Independent | Dalton McCarthy | 2,417 | 53.3 | -0.4 | ||||
| Liberal | Herman Henry Cook | 2,121 | 46.7 | +0.5 | ||||
| Total valid votes | 4,538 | 100.0 | ||||||
| Canadian federal election, 1887 | ||||||||
|---|---|---|---|---|---|---|---|---|
| Party | Candidate | Votes | % | ±% | ||||
| Conservative | Dalton McCarthy | 2,362 | 53.7 | -0.1 | ||||
| Liberal | Timothy Warren Anglin | 2,033 | 46.3 | |||||
| Total valid votes | 4,395 | 100.0 | ||||||
| Canadian federal election, 1882 | ||||||||
|---|---|---|---|---|---|---|---|---|
| Party | Candidate | Votes | % | ±% | ||||
| Conservative | Dalton McCarthy | 1,761 | 53.8 | +3.4 | ||||
| Independent | Charles Drury | 1,511 | 46.2 | |||||
| Total valid votes | 3,272 | 100.0 | ||||||
| Canadian federal election, 1878 | ||||||||
|---|---|---|---|---|---|---|---|---|
| Party | Candidate | Votes | % | ±% | ||||
| Conservative | Dalton McCarthy | 2,943 | 50.4 | +1.2 | ||||
| Liberal | Herman Henry Cook | 2,893 | 49.6 | -1.2 | ||||
| Total valid votes | 5,836 | 100.0 | ||||||
| Canadian federal by-election, 26 December 1874 | ||||||||
|---|---|---|---|---|---|---|---|---|
| Party | Candidate | Votes | % | ±% | ||||
| On Mr. Cook being unseated on petition, 11 November 1874 | ||||||||
| Liberal | Herman Henry Cook | 2,355 | 50.8 | -1.0 | ||||
| Conservative | Dalton McCarthy | 2,281 | 49.2 | +1.0 | ||||
| Total valid votes | 4,636 | 100.0 | ||||||
| Canadian federal election, 1874 | ||||||||
|---|---|---|---|---|---|---|---|---|
| Party | Candidate | Votes | % | ±% | ||||
| Liberal | Herman Henry Cook | 2,279 | 51.7 | +1.0 | ||||
| Conservative | Dalton McCarthy | 2,125 | 48.3 | -1.0 | ||||
| Total valid votes | 4,404 | 100.0 | ||||||
| Canadian federal election, 1872 | ||||||||
|---|---|---|---|---|---|---|---|---|
| Party | Candidate | Votes | % | |||||
| Liberal | Herman Henry Cook | 1,908 | 50.7 | |||||
| Conservative | Dalton McCarthy | 1,852 | 49.3 | |||||
| Total valid votes | 3,760 | 100.0 | ||||||
| Canadian federal election, 1867 | ||||||||
|---|---|---|---|---|---|---|---|---|
| Party | Candidate | Votes | ||||||
| Liberal | Thomas David McConkey | acclaimed | ||||||
See also
References
- "(Code 35086) Census Profile". 2011 census. Statistics Canada. 2012. Retrieved 2011-03-03.
- Riding history from the Library of Parliament
- 2011 results from Elections Canada
- Campaign expense data from Elections Canada
Notes
- ↑ Statistics Canada: 2011
- ↑ Statistics Canada: 2011
- ↑ http://www12.statcan.gc.ca/nhs-enm/2011/dp-pd/prof/details/page.cfm?Lang=E&Geo1=FED2013&Code1=35100&Data=Count&SearchText=Simcoe%20North&SearchType=Begins&SearchPR=01&A1=All&B1=All&Custom=&TABID=1
- ↑ http://www12.statcan.gc.ca/nhs-enm/2011/dp-pd/prof/details/page.cfm?Lang=E&Geo1=FED2013&Code1=35100&Data=Count&SearchText=Simcoe%20North&SearchType=Begins&SearchPR=01&A1=All&B1=All&Custom=&TABID=1#tabs2
- ↑ Elections Canada – Confirmed candidates for Simcoe North, 30 September 2015
- ↑ Elections Canada – Preliminary Election Expenses Limits for Candidates
- ↑ Pundits' Guide to Canadian Elections