Waterloo (electoral district)
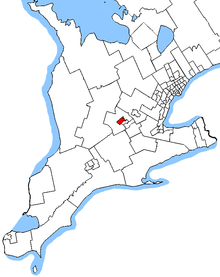 Waterloo in relation to southern Ontario ridings (2013 boundaries) | |||
| Coordinates: | 43°29′N 80°31′W / 43.48°N 80.52°WCoordinates: 43°29′N 80°31′W / 43.48°N 80.52°W | ||
| Federal electoral district | |||
| Legislature | House of Commons | ||
| MP |
Liberal | ||
| District created | 1966 | ||
| First contested | 1968 | ||
| Last contested | 2015 | ||
| District webpage | profile, map | ||
| Demographics | |||
| Population (2016)[1] | 110,134 | ||
| Electors (2015) | 77,312 | ||
| Area (km²)[1] | 78 | ||
| Pop. density (per km²) | 1,412 | ||
| Census divisions | Waterloo | ||
| Census subdivisions | Waterloo, Kitchener | ||
Waterloo is a federal electoral district in the Waterloo Region of Ontario, Canada, that was represented in the House of Commons of Canada from 1968 to 1997 (from 1973 to 1976, it was known as Waterloo—Cambridge) and that is again represented in the House of Commons since the 2015 federal election as a result of the Canadian federal electoral redistribution, 2012.[2]
Geography
The Waterloo electoral district contains all of the city of Waterloo plus the Bridgeport neighbourhood of Kitchener.
History
1966–1973
The Waterloo electoral district was created in 1966 from parts of Waterloo North and Waterloo South electoral districts. It initially comprised the City of Galt (now part of Cambridge), the City of Waterloo and the Townships of North Dumfries and Waterloo.[3]
1973–1976
After the amalgamation of the City of Galt with the Towns of Preston and Hespeler into the City of Cambridge in 1973, the name of the electoral district was changed to Waterloo—Cambridge. The boundaries of the district were not changed.[4]
1976–1996
In 1976, Waterloo—Cambridge was abolished when it was redistributed among Cambridge, Kitchener, and a new Waterloo electoral district.
The new Waterloo electoral district was created from parts of the Kitchener, Perth—Wilmot, Waterloo—Cambridge, and Wellington—Grey—Dufferin—Waterloo electoral districts. It comprised the Townships of Wellesley, Wilmot and Woolwich, the City of Waterloo, and parts of the City of Kitchener.[5]
In 1987, the Waterloo electoral district was redefined to comprise the City of Waterloo, the northern part of the City of Kitchener, and the Township of Woolwich. The Townships of Wellesley and Wilmot were redistributed to the Perth—Wellington—Waterloo district.[6]
The Waterloo electoral district was abolished in 1996 when it was redistributed between the Kitchener—Waterloo[7] and Waterloo—Wellington[8] electoral districts.
2013–present
Following the 2011 Census and a Canadian Parliament decision to increase the number of Federal electoral districts from 308 to 338, Elections Canada conducted a redistribution process that began with the establishment of Electoral Boundaries Commissions for each province in 2012. As a result of the work of the Electoral Boundaries Commission for the Province of Ontario, which was concluded in July 2013, a revived Waterloo was created out of 80% of the old Kitchener—Waterloo.[2] The revived riding comprised virtually all of the western portion of the old Kitchener—Waterloo, including all of Waterloo and a sliver of Kitchener lying north of the Canadian National Railway and northeast of Conestoga Parkway.
Members of Parliament
This riding has elected the following members of the House of Commons of Canada:
| Parliament | Years | Member | Party | |
|---|---|---|---|---|
| Waterloo Riding created from Waterloo North and Waterloo South |
||||
| 28th | 1968–1972 | Max Saltsman | New Democratic | |
| 29th | 1972–1974 | |||
| Waterloo—Cambridge | ||||
| 30th | 1974–1979 | Max Saltsman | New Democratic | |
| Waterloo | ||||
| 31st | 1979–1980 | Walter McLean | Progressive Conservative | |
| 32nd | 1980–1984 | |||
| 33rd | 1984–1988 | |||
| 34th | 1988–1993 | |||
| 35th | 1993–1997 | Andrew Telegdi | Liberal | |
| Riding dissolved into Kitchener—Waterloo and Waterloo—Wellington | ||||
| Riding re-created from Kitchener—Waterloo | ||||
| 42nd | 2015–Present | Bardish Chagger | Liberal | |
Electoral history
Waterloo, 2015–present
| Canadian federal election, 2015 | ||||||||
|---|---|---|---|---|---|---|---|---|
| Party | Candidate | Votes | % | ±% | Expenditures | |||
| Liberal | Bardish Chagger | 29,752 | 49.7 | +11.38 | $140,131.74 | |||
| Conservative | Peter Braid | 19,318 | 32.3 | -9.08 | $148,370.13 | |||
| New Democratic | Diane Freeman | 8,928 | 14.9 | -0.04 | $96,964.67 | |||
| Green | Richard Walsh | 1,713 | 2.9 | -1.78 | – | |||
| Animal Alliance | Emma Hawley-Yan | 138 | 0.2 | – | $4,066.17 | |||
| Total valid votes/Expense limit | 59,849 | 100.0 | $212,120.63 | |||||
| Total rejected ballots | 198 | – | – | |||||
| Turnout | 60,047 | – | – | |||||
| Eligible voters | 77,312 | |||||||
| Source: Elections Canada[9][10] | ||||||||
| 2011 federal election redistributed results[11] | |||
|---|---|---|---|
| Party | Vote | % | |
| Conservative | 22,193 | 41.38 | |
| Liberal | 20,551 | 38.32 | |
| New Democratic | 8,014 | 14.94 | |
| Green | 2,508 | 4.68 | |
| Others | 366 | 0.68 | |
Waterloo, 1976–1996
| Canadian federal election, 1993 | ||||||||
|---|---|---|---|---|---|---|---|---|
| Party | Candidate | Votes | % | ±% | ||||
| Liberal | Andrew Telegdi | 25,689 | 42.06 | +5.71 | ||||
| Reform | Mike Connolly | 15,549 | 25.46 | |||||
| Progressive Conservative | Lynne Woolstencroft | 14,882 | 24.37 | –20.74 | ||||
| New Democratic | Scott Piatkowski | 2,779 | 4.55 | –12.89 | ||||
| Christian Heritage | Ted Kryn | 920 | 1.51 | |||||
| Libertarian | Rita Huschka-Sprague | 473 | 0.77 | –0.34 | ||||
| Natural Law | Blaine P. Watson | 456 | 0.75 | |||||
| Independent | Don Philip Faithful | 329 | 0.54 | |||||
| Total valid votes | 61,077 | 100.00 | ||||||
| Liberal gain from Progressive Conservative | Swing | –9.88 | ||||||
| Canadian federal election, 1988 | ||||||||
|---|---|---|---|---|---|---|---|---|
| Party | Candidate | Votes | % | ±% | ||||
| Progressive Conservative | Walter McLean | 26,949 | 45.11 | –11.24 | ||||
| Liberal | Steve Woodworth | 21,715 | 36.35 | +11.78 | ||||
| New Democratic | Scott Piatkowski | 10,418 | 17.44 | –0.71 | ||||
| Libertarian | Rita Huschka-Sprague | 663 | 1.11 | +0.18 | ||||
| Total valid votes | 59,745 | 100.0 | ||||||
| Progressive Conservative hold | Swing | –11.51 | ||||||
| Canadian federal election, 1984 | ||||||||
|---|---|---|---|---|---|---|---|---|
| Party | Candidate | Votes | % | ±% | ||||
| Progressive Conservative | Walter McLean | 31,898 | 56.35 | +16.36 | ||||
| Liberal | Lynn Myers | 13,911 | 24.57 | –15.13 | ||||
| New Democratic | Bob Needham | 10,275 | 18.15 | –0.91 | ||||
| Libertarian | Layne E. Kulchecki | 525 | 0.93 | +0.49 | ||||
| Total valid votes | 56,609 | 100.0 | ||||||
| Progressive Conservative hold | Swing | +15.74 | ||||||
| Canadian federal election, 1980 | ||||||||
|---|---|---|---|---|---|---|---|---|
| Party | Candidate | Votes | % | ±% | ||||
| Progressive Conservative | Walter McLean | 20,609 | 39.99 | –6.07 | ||||
| Liberal | Frank Epp | 20,455 | 39.70 | +4.59 | ||||
| New Democratic | Bob Needham | 9,819 | 19.06 | +0.94 | ||||
| Rhinoceros | Rick Nigol | 330 | 0.64 | |||||
| Libertarian | Colin McLorg | 229 | 0.44 | –0.03 | ||||
| Marxist–Leninist | Brian Erdman | 87 | 0.17 | –0.07 | ||||
| Total valid votes | 51,529 | 100.0 | ||||||
| Progressive Conservative hold | Swing | –5.33 | ||||||
| Canadian federal election, 1979 | ||||||||
|---|---|---|---|---|---|---|---|---|
| Party | Candidate | Votes | % | ±% | ||||
| Progressive Conservative | Walter McLean | 23,837 | 46.06 | +17.68 | ||||
| Liberal | Frank Epp | 18,172 | 35.11 | +5.68 | ||||
| New Democratic | Mike Makarchuk | 9,375 | 18.12 | –23.46 | ||||
| Libertarian | Bonne Willy Posma | 241 | 0.47 | |||||
| Marxist–Leninist | Brian Erdman | 125 | 0.24 | +0.04 | ||||
| Total valid votes | 51,750 | 100.0 | ||||||
| Progressive Conservative gain from New Democratic | Swing | +6.00 | ||||||
Waterloo—Cambridge, 1973–1976
| Canadian federal election, 1974 | ||||||||
|---|---|---|---|---|---|---|---|---|
| Party | Candidate | Votes | % | ±% | ||||
| New Democratic | Max Saltsman | 25,479 | 41.58 | +1.10 | ||||
| Liberal | Brian Goff | 18,034 | 29.43 | +3.39 | ||||
| Progressive Conservative | Glenn Carroll | 17,394 | 28.38 | –4.77 | ||||
| Social Credit | John H. Long | 253 | 0.41 | +0.17 | ||||
| Marxist–Leninist | Richard E. Rathwell | 122 | 0.20 | |||||
| Total valid votes | 61,282 | 100.0 | ||||||
| New Democratic hold | Swing | –1.14 | ||||||
Waterloo, 1966–1973
| Canadian federal election, 1972 | ||||||||
|---|---|---|---|---|---|---|---|---|
| Party | Candidate | Votes | % | ±% | ||||
| New Democratic | Max Saltsman | 24,197 | 40.48 | +6.48 | ||||
| Progressive Conservative | Glenn E. Carroll | 19,817 | 33.15 | +0.63 | ||||
| Liberal | Lou Breithaupt | 15,570 | 26.04 | –7.07 | ||||
| Social Credit | Régent G. Gervais | 143 | 0.24 | –0.13 | ||||
| Unknown | Jules W.P. Grajower | 55 | 0.09 | |||||
| Total valid votes | 59,782 | 100.0 | ||||||
| New Democratic hold | Swing | +2.92 | ||||||
| Canadian federal election, 1968 | ||||||||
|---|---|---|---|---|---|---|---|---|
| Party | Candidate | Votes | % | |||||
| New Democratic | Max Saltsman | 15,231 | 34.00 | |||||
| Liberal | Herbert Epp | 14,835 | 33.11 | |||||
| Progressive Conservative | Liam S. O'Brian | 14,568 | 32.52 | |||||
| Social Credit | Régent Gervais | 167 | 0.37 | |||||
| Total valid votes | 44,801 | 100.0 | ||||||
| This riding was created from parts of Waterloo North and Waterloo South, which elected a Liberal and a Progressive Conservative, respectively, in the last election. | ||||||||
See also
Notes
- 1 2 Statistics Canada: 2016
- 1 2 Elections Canada. "Report of the Federal Electoral Boundaries Commission for the Province of Ontario". Retrieved 2014-09-17.
- ↑ Parliament of Canada. "HISTORY OF FEDERAL RIDINGS SINCE 1867 - WATERLOO, Ontario (1968 - 1973)". Retrieved 2014-09-17.
- ↑ Parliament of Canada. "HISTORY OF FEDERAL RIDINGS SINCE 1867 - WATERLOO--CAMBRIDGE, Ontario (1973 - 1976)". Retrieved 2014-09-17.
- ↑ Parliament of Canada. "HISTORY OF FEDERAL RIDINGS SINCE 1867 - WATERLOO, Ontario (1976 - 1996)". Retrieved 2014-09-17.
- ↑ Parliament of Canada. "HISTORY OF FEDERAL RIDINGS SINCE 1867 - PERTH--WELLINGTON--WATERLOO, Ontario (1987 - 1996)". Retrieved 2014-09-17.
- ↑ Parliament of Canada. "HISTORY OF FEDERAL RIDINGS SINCE 1867 - KITCHENER--WATERLOO, Ontario (1996 - )". Retrieved 2014-09-17.
- ↑ Parliament of Canada. "HISTORY OF FEDERAL RIDINGS SINCE 1867 - WATERLOO--WELLINGTON, Ontario (1996 - 2003)". Retrieved 2014-09-17.
- ↑ Elections Canada – Confirmed candidates for Waterloo, 30 September 2015
- ↑ Elections Canada – Preliminary Election Expenses Limits for Candidates
- ↑ Pundits' Guide to Canadian Elections
External links
- Website of the Parliament of Canada
- Waterloo Conservative Electoral District Association
- Green Party of Canada - Kitchener-Waterloo
- Waterloo Federal Liberal Electoral District Association
- Kitchener-Waterloo NDP Federal Electoral District Association