Canadian federal election, 1908
|
| ||||||||||||||||||||||||||||||||||
| ||||||||||||||||||||||||||||||||||
221 seats in the 11th Canadian Parliament 111 seats needed for a majority | ||||||||||||||||||||||||||||||||||
|---|---|---|---|---|---|---|---|---|---|---|---|---|---|---|---|---|---|---|---|---|---|---|---|---|---|---|---|---|---|---|---|---|---|---|
| ||||||||||||||||||||||||||||||||||
 | ||||||||||||||||||||||||||||||||||
_-_tight_crop.jpg)
The Canadian federal election of 1908 was held on October 26 to elect members of the House of Commons of Canada of the 11th Parliament of Canada. Prime Minister Sir Wilfrid Laurier's Liberal Party of Canada was re-elected for a fourth consecutive term in government with a majority government. The Liberals lost four seats and a small share of the popular vote.
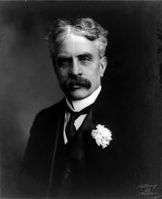
Sir Robert Borden's Conservatives and Liberal-Conservatives won ten additional seats.
This was the first election in which Alberta and Saskatchewan voted as provinces. Following their creation in 1905, the two new provinces continued to be represented by MP's initially elected under the old Northwest Territories riding boundaries, some of which straddled the new provincial border. The remainder of the Northwest Territories that previously had Parliamentary representation (all of what comprises the present-day NWT plus parts of present-day Nunavut) lost it - a seat would not be created for the NWT again until 1949.
Voter turnout was 70.3%.[1]
National results

| ↓ | ||||
| 133 | 85 | 3 | ||
| Liberal | Conservative | O | ||
| Party | Party leader | # of candidates |
Seats | Popular vote | |||||
|---|---|---|---|---|---|---|---|---|---|
| 1904 | Elected | Change | # | % | Change | ||||
| Liberal | Wilfrid Laurier | 213 | 137 | 133 | -2.9% | 570,311 | 48.87% | -2.01pp | |
| Conservative | Robert Borden | 207 | 70 | 82 | +17.1% | 524,641 | 44.95% | +0.55pp | |
| Liberal-Conservative | 4 | 5 | 3 | -40.0% | 14,733 | 1.26% | -0.27pp | ||
| Independent | 15 | 1 | 1 | - | 16,903 | 1.45% | +0.45pp | ||
| Labour | 3 | - | 1 | 10,400 | 0.89% | +0.68pp | |||
| Unknown | 7 | - | - | - | 13,478 | 1.15% | +0.02pp | ||
| Socialist | 5 | - | - | - | 6,071 | 0.52% | +0.35pp | ||
| Independent Conservative | 2 | 1 | 1 | -100% | 5,314 | 0.46% | -0.04pp | ||
| Independent Liberal | 5 | - | - | - | 5,191 | 0.44% | +0.41pp | ||
| Total | 461 | 214 | 221 | +2.8% | 1,167,042 | 100% | |||
| Sources: http://www.elections.ca -- History of Federal Ridings since 1867 | |||||||||
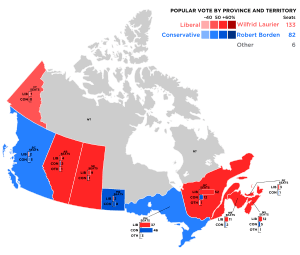
Results by province
| Party | BC | AB | SK | MB | ON | QC | NB | NS | PE | YK | Total | ||
|---|---|---|---|---|---|---|---|---|---|---|---|---|---|
| Liberal | Seats: | 2 | 4 | 9 | 2 | 37 | 52 | 11 | 12 | 3 | 1 | 133 | |
| Popular vote (%): | 35.9 | 50.2 | 56.6 | 45.4 | 45.0 | 53.0 | 56.2 | 51.0 | 50.4 | 40.2 | 48.9 | ||
| Conservative | Seats: | 5 | 2 | 1 | 8 | 46 | 12 | 2 | 5 | 1 | - | 82 | |
| Vote (%): | 46.8 | 38.1 | 36.8 | 51.5 | 49.2 | 39.5 | 43.8 | 44.5 | 49.6 | 10.8 | 45.0 | ||
| Liberal-Conservative | Seats: | 1 | 1 | 1 | 3 | ||||||||
| Vote (%): | 6.4 | 1.5 | 4.5 | 1.3 | |||||||||
| Independent | Seats: | - | - | - | - | 1 | - | 1 | |||||
| Vote (%): | 8.9 | 3.7 | 0.6 | 0.1 | 1.8 | 1.1 | 1.5 | ||||||
| Labour | Seats: | - | 1 | 1 | |||||||||
| Vote (%): | 0.7 | 2.6 | 0.9 | ||||||||||
| Independent Conservative | Seats: | - | 1 | 1 | |||||||||
| Vote (%): | 5.9 | 0.4 | 0.5 | ||||||||||
| Total seats | 7 | 7 | 10 | 10 | 86 | 65 | 13 | 18 | 4 | 1 | 221 | ||
| Parties that won no seats: | |||||||||||||
| Unknown | Vote (%): | 1.3 | 1.4 | 1.9 | 49.0 | 1.2 | |||||||
| Socialist | Vote (%): | 7.1 | 1.6 | 2.9 | 0.2 | 0.5 | |||||||
| Independent Liberal | Vote (%): | 0.1 | 1.8 | 0.4 | |||||||||