Kitchener—Waterloo (electoral district)
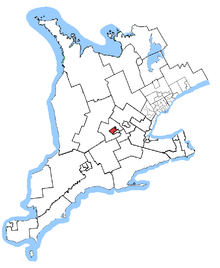 Kitchener—Waterloo in relation to southern Ontario ridings (2003) | |
| Defunct federal electoral district | |
| Legislature | House of Commons |
| District created | 1996 |
| District abolished | 2013 |
| First contested | 1997 |
| Last contested | 2011 |
| District webpage | profile, map |
| Demographics | |
| Population (2011)[1] | 130,162 |
| Electors (2011) | 97,511 |
| Area (km²)[1] | 84.95 |
| Census divisions | Waterloo |
| Census subdivisions | Waterloo, Kitchener |
Kitchener—Waterloo was a federal electoral district in Ontario, Canada, that was represented in the House of Commons of Canada from 1997 to 2015.
Geography
The district consisted of the City of Waterloo and the northern part of the City of Kitchener.
History
The electoral district was created in 1996 from part of Waterloo riding.
It consisted initially of the City of Waterloo and the part of the City of Kitchener lying north of a line drawn from west to east along Highland Road West, Lawrence Avenue and Victoria Street.
In 2003, the Kitchener part of the riding was redefined to be the part of the city lying north of a line drawn from west to east along Highland Road West, Fischer Hallman Road and the Canadian National Railway situated north of Shadeland Crescent.
Following the 2011 Census and a Canadian Parliament decision to increase the number of Federal electoral districts from 308 to 338, Elections Canada conducted a redistribution beginning in 2012 that was concluded on October 1, 2013. As a result, Kitchener—Waterloo was dissolved. The bulk of the riding, including all of Waterloo and a tiny sliver of the riding's share of Kitchener, became a revived Waterloo. The rest of the Kitchener portion was split between Kitchener Centre and Kitchener—Conestoga.[2]
Members of Parliament
| Parliament | Years | Member | Party | |
|---|---|---|---|---|
| Kitchener—Waterloo Riding created from Waterloo |
||||
| 36th | 1997–2000 | Andrew Telegdi | Liberal | |
| 37th | 2000–2004 | |||
| 38th | 2004–2006 | |||
| 39th | 2006–2008 | |||
| 40th | 2008–2011 | Peter Braid | Conservative | |
| 41st | 2011–2015 | |||
| Riding dissolved into Waterloo, Kitchener Centre and Kitchener—Conestoga |
||||
Election results
| Canadian federal election, 2011 | ||||||||
|---|---|---|---|---|---|---|---|---|
| Party | Candidate | Votes | % | ±% | Expenditures | |||
| Conservative | Peter Braid | 27,039 | 40.85 | +4.79 | $90,641.15 | |||
| Liberal | Andrew Telegdi | 24,895 | 37.62 | +1.59 | – | |||
| New Democratic | Bill Brown | 10,606 | 16.03 | +1.31 | $21,334.44 | |||
| Green | Cathy MacLellan | 3,158 | 4.77 | -7.33 | – | |||
| Pirate | Steven Bradley Scott | 245 | 0.37 | – | – | |||
| Independent | Richard Walsh-Bowers | 174 | 0.26 | – | – | |||
| Marxist–Leninist | Julian Ichim | 66 | 0.10 | – | none listed | |||
| Total valid votes | 66,183 | 100.00 | – | |||||
| Total rejected ballots | 216 | 0.33 | -0.05 | |||||
| Turnout | 66,399 | 70.17 | +7.86 | |||||
| Eligible voters | 94,624 | – | – | |||||
| Canadian federal election, 2008 | ||||||||
|---|---|---|---|---|---|---|---|---|
| Party | Candidate | Votes | % | ±% | Expenditures | |||
| Conservative | Peter Braid | 21,830 | 36.06 | +7.75 | $93,455 | |||
| Liberal | Andrew Telegdi | 21,813 | 36.03 | -10.82 | $71,443 | |||
| New Democratic | Cindy Jacobsen | 8,915 | 14.72 | -3.16 | $34,713 | |||
| Green | Cathy MacLellan | 7,326 | 12.10 | +5.64 | $19,781 | |||
| Libertarian | Jason Cousineau | 333 | 0.55 | – | $0 | |||
| Independent | Mark Corbiere | 107 | 0.17 | – | ||||
| Communist | Ramon Portillo | 105 | 0.17 | – | $373 | |||
| Canadian Action | Kyle Huntingdon | 105 | 0.17 | – | $203 | |||
| Total valid votes/Expense limit | 60,534 | 100.00 | $95,412 | |||||
| Total rejected ballots | 229 | 0.38 | – | |||||
| Turnout | 60,763 | 62.31 | -8.08 | |||||
| Canadian federal election, 2006 | ||||||||
|---|---|---|---|---|---|---|---|---|
| Party | Candidate | Votes | % | ±% | ||||
| Liberal | Andrew Telegdi | 31,136 | 46.85 | -1.2 | ||||
| Conservative | Ajmer Mandur | 18,817 | 28.31 | -1.1 | ||||
| New Democratic | Edwin Laryea | 11,889 | 17.88 | +1.9 | ||||
| Green | Pauline Richards | 4,298 | 6.46 | +0.9 | ||||
| Independent | Ciprian Mihalcea | 173 | 0.26 | -0.4 | ||||
| Marxist–Leninist | Julian Ichim | 144 | 0.21 | |||||
| Total valid votes | 66,457 | 100.0 | ||||||
| Total rejected ballots | 240 | 0.38 | ||||||
| Turnout | 66,697 | 70.39 | ||||||
| Canadian federal election, 2004 | ||||||||
|---|---|---|---|---|---|---|---|---|
| Party | Candidate | Votes | % | ±% | ||||
| Liberal | Andrew Telegdi | 28,015 | 48.1 | -2.2 | ||||
| Conservative | Steve Strauss | 17,155 | 29.5 | -9.5 | ||||
| New Democratic | Edwin Laryea | 9,267 | 15.9 | +7.8 | ||||
| Green | Pauline Richards | 3,277 | 5.6 | +4.1 | ||||
| Christian Heritage | Frank Ellis | 379 | 0.7 | |||||
| Independent | Ciprian Mihalcea | 124 | 0.2 | |||||
| Total valid votes | 58,217 | 100.0 | ||||||
Note: Conservative vote is compared to the total of the Canadian Alliance vote and Progressive Conservative vote in 2000 election.
| Canadian federal election, 2000 | ||||||||
|---|---|---|---|---|---|---|---|---|
| Party | Candidate | Votes | % | ±% | ||||
| Liberal | Andrew Telegdi | 27,130 | 50.3 | +2.6 | ||||
| Alliance | Joshua Doig | 12,406 | 23.0 | +3.1 | ||||
| Progressive Conservative | Brian Bourke | 8,601 | 16.0 | -6.1 | ||||
| New Democratic | Richard Walsh-Bowers | 4,397 | 8.2 | -0.8 | ||||
| Green | Jack MacAulay | 809 | 1.5 | |||||
| Canadian Action | Robert E. Cormier | 273 | 0.5 | 0.0 | ||||
| Marxist–Leninist | Christine Nugent | 164 | 0.3 | 0.0 | ||||
| Independent | Frank Ellis | 105 | 0.2 | |||||
| Total valid votes | 53,885 | 100.0 | ||||||
| Canadian federal election, 1997 | ||||||||
|---|---|---|---|---|---|---|---|---|
| Party | Candidate | Votes | % | |||||
| Liberal | Andrew Telegdi | 25,111 | 47.7 | |||||
| Progressive Conservative | Lynne Woolstencroft | 11,613 | 22.1 | |||||
| Reform | Mike Connolly | 10,502 | 20.0 | |||||
| New Democratic | Ted Martin | 4,725 | 9.0 | |||||
| Independent | Steve King | 265 | 0.5 | |||||
| Canadian Action | Monte Dennis | 260 | 0.5 | |||||
| Marxist–Leninist | Helmut Braun | 153 | 0.3 | |||||
| Total valid votes | 52,629 | 100.0 | ||||||
See also
References
Notes
- 1 2 Statistics Canada: 2011
- ↑ Elections Canada. "Report of the Federal Electoral Boundaries Commission for the Province of Ontario". Retrieved 2013-07-31.
External links
- Kitchener-Waterloo NDP Federal Electoral District Association
- Waterloo Federal Liberal Electoral District Association
- Waterloo Conservative Electoral District Association
- Green Party of Canada - Kitchener-Waterloo