Canadian federal election, 1904
|
| ||||||||||||||||||||||||||||||||||
| ||||||||||||||||||||||||||||||||||
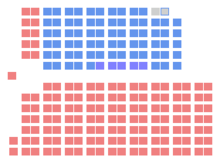
214 seats in the 10th Canadian Parliament 108 seats needed for a majority | ||||||||||||||||||||||||||||||||||
|---|---|---|---|---|---|---|---|---|---|---|---|---|---|---|---|---|---|---|---|---|---|---|---|---|---|---|---|---|---|---|---|---|---|---|
| ||||||||||||||||||||||||||||||||||
 | ||||||||||||||||||||||||||||||||||
_-_tight_crop.jpg)
The Canadian federal election of 1904 was held on November 3 to elect members of the House of Commons of Canada of the 10th Parliament of Canada. Prime Minister Sir Wilfrid Laurier led the Liberal Party of Canada to a third term in government, with an increased majority, and over half of the popular vote.
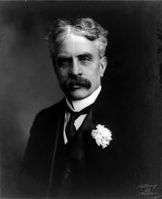
Sir Robert Borden's Conservatives and Liberal-Conservatives were unable to challenge the Liberals effectively, and lost a small portion of their popular vote, along with four seats, including his own. Borden re-entered parliament the next year in a by-election.
This was the last election until 1949 in which parts of the Northwest Territories were granted representation. Most of the settled regions of the NWT entered Confederation as the provinces of Alberta and Saskatchewan on 1 September 1905, although its MP's continued to sit as representatives of the old ridings until the 10th Parliament's dissolution.
Voter turnout: 71.6%.[1]
National results
| ↓ | ||||
| 137 | 75 | 2 | ||
| Liberal | Conservative | O | ||
| Party | Party leader | # of candidates |
Seats | Popular vote | |||||
|---|---|---|---|---|---|---|---|---|---|
| 1900 | Elected | Change | # | % | Change | ||||
| Liberal | Wilfrid Laurier | 208 | 128 | 137 | +7.0% | 521,041 | 50.88% | +0.63pp | |
| Conservative | Robert Borden | 199 | 69 | 70 | +1.4% | 454693 | 44.40% | +1.18pp | |
| Liberal-Conservative | 6 | 10 | 5 | -50.0% | 15,737 | 1.54% | -1.34pp | ||
| Independent | 6 | 3 | 1 | -66.7% | 10,205 | 1.00% | -0.40pp | ||
| Independent Conservative | 2 | 1 | 1 | - | 5,039 | 0.49% | -0.57pp | ||
| Unknown | 13 | - | - | - | 11,659 | 1.14% | +1.14pp | ||
| Labour | 2 | - | - | - | 2,159 | 0.21% | -0.10pp | ||
| Socialist | 3 | * | - | * | 1,794 | 0.18% | * | ||
| Nationalist | 1 | * | - | * | 1,429 | 0.14% | * | ||
| Independent Liberal | 3 | 1 | - | -100% | 309 | 0.03% | -0.48pp | ||
| Total | 443 | 213 | 214 | +0.5% | 1,024,065 | 100% | |||
| Sources: http://www.elections.ca -- History of Federal Ridings since 1867 | |||||||||
Note:
* Party did not nominate candidates in the previous election.
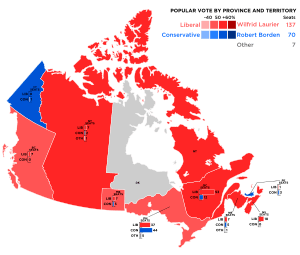
Results by province
| Party | BC | NW | MB | ON | QC | NB | NS | PE | YK | Total | |||
|---|---|---|---|---|---|---|---|---|---|---|---|---|---|
| Liberal | Seats: | 7 | 7 | 7 | 37 | 53 | 7 | 18 | 1 | - | 137 | ||
| Popular Vote (%): | 49.5 | 58.4 | 49.7 | 47.5 | 55.1 | 51.0 | 52.9 | 49.1 | 41.4 | 50.9 | |||
| Conservative | Seats: | - | 2 | 3 | 44 | 12 | 5 | - | 3 | 1 | 70 | ||
| Vote (%): | 38.8 | 37.8 | 41.8 | 46.3 | 43.0 | 42.0 | 44.5 | 50.9 | 58.6 | 44.4 | |||
| Liberal-Conservative | Seats: | 1 | 3 | 1 | 5 | ||||||||
| Vote (%): | 3.8 | 2.1 | 6.8 | 1.5 | |||||||||
| Independent | Seats: | - | - | 1 | - | - | 1 | ||||||
| Vote (%): | xx | 5.8 | 0.6 | 1.3 | 1.6 | 1.0 | |||||||
| Independent Conservative | Seats: | 1 | 1 | ||||||||||
| Vote (%): | 1.2 | 0.5 | |||||||||||
| Total seats | 7 | 10 | 10 | 86 | 65 | 13 | 18 | 4 | 1 | 214 | |||
| Parties that won no seats: | |||||||||||||
| Unknown | Vote (%): | 4.6 | 2.4 | xx | 1.1 | ||||||||
| Labour | Vote (%): | 2.7 | 0.7 | 0.8 | 0.2 | ||||||||
| Socialist | Vote (%): | 7.1 | 0.2 | ||||||||||
| Nationalist | Vote (%): | 0.6 | 0.5 | ||||||||||
| Independent Liberal | Vote (%): | xx | 0.2 | 0.1 | xx | ||||||||
xx - indicates less than 0.05% of the popular vote.