Thornhill (electoral district)
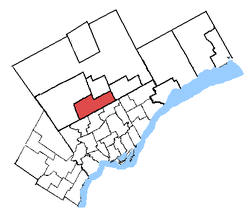
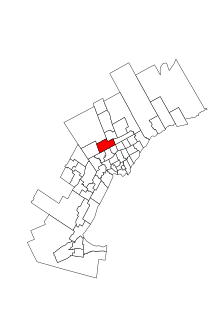 Thornhill in relation to other Greater Toronto ridings | |||
| Federal electoral district | |||
| Legislature | House of Commons | ||
| MP |
Conservative | ||
| District created | 1996 | ||
| First contested | 1997 | ||
| Last contested | 2015 | ||
| District webpage | profile, map | ||
| Demographics | |||
| Population (2011)[1] | 110,427 | ||
| Electors (2015) | 80,288 | ||
| Area (km²)[2] | 66 | ||
| Pop. density (per km²) | 1,673.1 | ||
| Census divisions | York | ||
| Census subdivisions | Markham, Vaughan | ||
.png)
Thornhill is a federal electoral district in Ontario, Canada, that has been represented in the House of Commons of Canada since 1997.
It covers the Thornhill neighbourhood, which is split between Vaughan and Markham, and was created in 1996 from parts of Markham—Whitchurch—Stouffville and York North ridings.
It consists of the part of the city of Vaughan that is east of Highway 400 and south of Rutherford Road, and the part of the city of Markham west of Bayview Avenue.
It is one of only two ridings in Canada with a Jewish plurality (the other being Mount Royal in Quebec). 32.8% of the population is Jewish, the highest in Canada.[3] Thornhill also has the highest percentage of Russians (12.9%) of all Canadian ridings (implying the presence of a strong community of Russian Jews[4]).
The Thornhill riding has the highest percentage of population with an educational attainment of "University certificate or diploma above bachelor level" (i.e. above-bachelor-level certificate or diploma other than doctorate, master, or medicine etc. degrees) with 5.0%.[5]
The riding lost all of its territory east of Bayview Avenue to Markham-Thornhill, and gained a small fraction from York Centre in the 2012 redistribution.
Demographics
- According to the Canada 2011 Census; 2013 representation[6][7]
Ethnic groups: 68.2% White, 7.6% Chinese, 6.5% South Asian, 4.6% Filipino, 3.7% Korean, 3.3% West Asian, 1.9% Black, 1.1% Southeast Asian
Languages: 49.9% English, 13.0% Russian, 6.2% Chinese, 3.1% Persian, 3.2% Korean, 3.7% Hebrew, 3.0% Italian, 2.2% Tagalog, 1.7% Spanish 1.4% French, 1.0% Gujarati
Religions: 37.5% Christian (18.8% Catholic, 6.2% Christian Orthodox, 2.0% Presbyterian, 1.6% Anglican, 1.5% United Church, 7.3% Other Christian), 37.1% Jewish, 4.3% Muslim, 3.4% Hindu, 2.0% Buddhist, 14.7% None.
Median income: $30,798 (2010)
Average income: $47,097 (2010)
Members of Parliament
This riding has elected the following members of the House of Commons of Canada:
| Parliament | Years | Member | Party | |
|---|---|---|---|---|
| Thornhill Riding created from Markham—Whitchurch—Stouffville and York North |
||||
| 36th | 1997–2000 | Elinor Caplan | Liberal | |
| 37th | 2000–2004 | |||
| 38th | 2004–2006 | Susan Kadis | ||
| 39th | 2006–2008 | |||
| 40th | 2008–2011 | Peter Kent | Conservative | |
| 41st | 2011–2015 | |||
| 42nd | 2015–Present | |||
Election results
| Canadian federal election, 2015 | ||||||||
|---|---|---|---|---|---|---|---|---|
| Party | Candidate | Votes | % | ±% | Expenditures | |||
| Conservative | Peter Kent | 31,911 | 58.60 | -4.59 | $123,230.74 | |||
| Liberal | Nancy Coldham | 18,395 | 33.80 | +11.31 | $55,910.58 | |||
| New Democratic | Lorne Cherry | 2,814 | 5.20 | -6.29 | $6,832.09 | |||
| Green | Josh Rachlis | 627 | 1.20 | -1.28 | – | |||
| Libertarian | Gene Balfour | 587 | 1.10 | – | $202.00 | |||
| Seniors | Margaret Leigh Fairbairn | 157 | 0.30 | – | $4,584.13 | |||
| Total valid votes/Expense limit | 54,491 | 100.0 | $216,565.52 | |||||
| Total rejected ballots | 324 | – | – | |||||
| Turnout | 67.20 | – | – | |||||
| Eligible voters | 81,106 | |||||||
| Source: Elections Canada[8][9] | ||||||||
| 2011 federal election redistributed results[10] | |||
|---|---|---|---|
| Party | Vote | % | |
| Conservative | 29,140 | 63.19 | |
| Liberal | 10,373 | 22.49 | |
| New Democratic | 5,299 | 11.49 | |
| Green | 1,142 | 2.48 | |
| Others | 160 | 0.35 | |
| Canadian federal election, 2011 | ||||||||
|---|---|---|---|---|---|---|---|---|
| Party | Candidate | Votes | % | ±% | Expenditures | |||
| Conservative | Peter Kent | 36,629 | 61.38 | +12.37 | $85,817.95 | |||
| Liberal | Karen Mock | 14,125 | 23.67 | -15.76 | $89,258.36 | |||
| New Democratic | Simon Strelchik | 7,141 | 11.97 | +5.35 | $5,397.91 | |||
| Green | Norbert Koehl | 1,562 | 2.62 | -2.32 | $11,470.40 | |||
| Animal Alliance | Liz White | 215 | 0.36 | – | $7,002.05 | |||
| Total valid votes/Expense limit | 59,672 | 100.00 | – | $99,784.20 | ||||
| Total rejected ballots | 275 | 0.46 | – | |||||
| Turnout | 59,947 | 60.98 | – | |||||
| Eligible voters | 98,312 | – | – | |||||
| Canadian federal election, 2008 | ||||||||
|---|---|---|---|---|---|---|---|---|
| Party | Candidate | Votes | % | ±% | Expenditures | |||
| Conservative | Peter Kent | 26,660 | 49.01 | +15.30 | $91,400 | |||
| Liberal | Susan Kadis | 21,448 | 39.43 | -13.67 | $62,484 | |||
| New Democratic | Simon Strelchik | 3,601 | 6.62 | -1.19 | $4,835 | |||
| Green | Norbert Koehl | 2,686 | 4.94 | +1.51 | $7,314 | |||
| Total valid votes/Expense limit | 54,395 | 100.00 | – | $95,547 | ||||
| Canadian federal election, 2006 | ||||||||
|---|---|---|---|---|---|---|---|---|
| Party | Candidate | Votes | % | ±% | ||||
| Liberal | Susan Kadis | 29,934 | 53.10 | -1.48 | ||||
| Conservative | Anthony Reale | 19,005 | 33.71 | -0.75 | ||||
| New Democratic | Simon Strelchik | 4,405 | 7.81 | +0.83 | ||||
| Green | Lloyd Helferty | 1,934 | 3.43 | +0.35 | ||||
| Progressive Canadian | Mark Abramowitz | 1,094 | 1.94 | |||||
| Total valid votes | 56,372 | 100.00 | ||||||
Source: CBC Ridings Results
| Canadian federal election, 2004 | ||||||||
|---|---|---|---|---|---|---|---|---|
| Party | Candidate | Votes | % | ±% | ||||
| Liberal | Susan Kadis | 28,709 | 54.58 | -10.01 | ||||
| Conservative | Josh Cooper | 18,125 | 34.46 | +3.58 | ||||
| New Democratic | Rick Morelli | 3,671 | 6.98 | +3.05 | ||||
| Green | Lloyd Helferty | 1,622 | 3.08 | |||||
| Independent | Benjamin Fitzerman | 241 | 0.46 | |||||
| Independent | Simion Iron | 233 | 0.44 | |||||
| Total valid votes | 52,601 | 100.00 | ||||||
Note: Conservative vote is compared to the total of the Canadian Alliance vote and Progressive Conservative vote in 2000 election.
| Canadian federal election, 2000 | ||||||||
|---|---|---|---|---|---|---|---|---|
| Party | Candidate | Votes | % | ±% | ||||
| Liberal | Elinor Caplan | 27,152 | 64.59 | +5.59 | ||||
| Alliance | Robert Goldin | 6,643 | 15.80 | +7.91 | ||||
| Progressive Conservative | Lou Watson | 6,338 | 15.08 | -11.31 | ||||
| New Democratic | Nathan Rotman | 1,653 | 3.93 | -0.67 | ||||
| Canadian Action | Art Jaszczyk | 254 | 0.60 | |||||
| Total valid votes | 42,040 | 100.00 | ||||||
Note: Canadian Alliance vote is compared to the Reform vote in 1997 election.
| Canadian federal election, 1997 | ||||||||
|---|---|---|---|---|---|---|---|---|
| Party | Candidate | Votes | % | |||||
| Liberal | Elinor Caplan | 25,747 | 59.00 | |||||
| Progressive Conservative | Bill Fisch | 11,517 | 26.39 | |||||
| Reform | Aurel David | 3,441 | 7.89 | |||||
| New Democratic | Helen Breslauer | 2,008 | 4.60 | |||||
| Independent | Rick Levine | 303 | 0.69 | |||||
| Natural Law | Linda Martin | 261 | 0.60 | |||||
| Independent | Sid Soban | 238 | 0.55 | |||||
| Independent | Shel Bergson | 124 | 0.28 | |||||
| Total valid votes | 43,639 | 100.00 | ||||||
See also
References
- "(Code 35089) Census Profile". 2011 census. Statistics Canada. 2012. Retrieved 2011-03-03.
Notes
- ↑ Statistics Canada: 2011
- ↑ Statistics Canada: 2011
- ↑ http://www12.statcan.gc.ca/nhs-enm/2011/dp-pd/prof/details/page.cfm?Lang=E&Geo1=FED&Code1=35089&Data=Count&SearchText=Thornhill&SearchType=Begins&SearchPR=01&A1=All&B1=All&Custom=&TABID=1
- ↑ http://www2.kolel.org/home.do;jsessionid=382A7EA91B61739609208258AB0A89AF?ch=events&state=organizationSearch&Submit=show&organization=1761
- ↑ "2006 Census of Canada: Topic-based tabulations | Highest Certificate, Diploma or Degree (14), Location of Study (5), Major Field of Study - Classification of Instructional Programs, 2000 (14), Age Groups (10A) and Sex (3) for the Population 15 Years and Over of Canada, Provinces, Territories and Federal Electoral Districts (2003 Representation Order), 2006 Census - 20% Sample Data". 2.statcan.gc.ca. Retrieved 2012-11-16.
- ↑ http://www12.statcan.gc.ca/nhs-enm/2011/dp-pd/prof/details/page.cfm?Lang=E&Geo1=FED2013&Code1=35104&Data=Count&SearchText=Thornhill&SearchType=Begins&SearchPR=01&A1=All&B1=All&Custom=&TABID=1
- ↑ http://www12.statcan.gc.ca/nhs-enm/2011/dp-pd/prof/details/page.cfm?Lang=E&Geo1=FED2013&Code1=35104&Data=Count&SearchText=Thornhill&SearchType=Begins&SearchPR=01&A1=All&B1=All&Custom=&TABID=1#tabs2
- ↑ Elections Canada – Confirmed candidates for Thornhill, 30 September 2015
- ↑ Elections Canada – Preliminary Election Expenses Limits for Candidates
- ↑ Pundits' Guide to Canadian Elections
Sources
- Riding history from the Library of Parliament
- 2011 results from Elections Canada
- [www.elections.ca Campaign expense data from Elections Canada]