Carleton (Ontario electoral district)
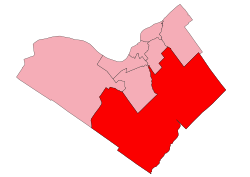 Carleton in relation to other electoral districts in Ottawa | |||
| Federal electoral district | |||
| Legislature | House of Commons | ||
| MP |
Conservative | ||
| District created | 1867 | ||
| First contested | 1867 | ||
| Last contested | 2015 | ||
| District webpage | profile, map | ||
| Demographics | |||
| Population (2016)[1] | 102,918 | ||
| Electors (2015) | 71,947 | ||
| Area (km²)[1] | 1,229 | ||
| Pop. density (per km²) | 83.7 | ||
| Census divisions | Ottawa | ||
| Census subdivisions | Ottawa | ||
Carleton is a federal electoral district in Ontario, Canada, represented in the House of Commons of Canada from 1867 to 1968 and since 2015. It was represented in the Legislative Assembly of Upper Canada from 1821 to 1840 and in the Legislative Assembly of the Province of Canada from 1841 until 1866.
The original riding was created by the British North America Act of 1867. However, the riding had existed since 1821 in the Parliament of Upper Canada and the Parliament of the Province of Canada. It originally consisted of Carleton County. In 1966, it was redistributed into the new electoral districts of Grenville—Carleton, Lanark and Renfrew, Ottawa Centre, Ottawa West and Ottawa—Carleton.
This riding was re-created by the 2012 electoral redistribution from parts of Nepean—Carleton (59%), Carleton—Mississippi Mills (41%) and a small portion of Ottawa South. It was contested in the 2015 federal election.
Demographics
- According to the Canada 2011 Census[2]
Ethnic groups: 86.1% White, 3.4% Indigenous, 2.0% Chinese, 2.0% South Asian, 1.8% Arab, 1.6% Black, 3.1% Other
Languages: 81.4% English, 7.6% French, 1.3% Arabic, 1.0% Italian, 8.7% Other
Religions: 76.0% Christian, 2.1% Muslim, 2.1% Other, 19.8% None
Median income: $47,616 (2010)
Average income: $57,190 (2010)
Riding history
The federal riding consisted initially of Carleton County. In 1882, it was redefined to consist of the townships of Nepean, North Gower, Marlboro, March, Torbolton and Goulbourn, and the village of Richmond. In 1903, it was redefined to consist of the county of Carleton, excluding the city of Ottawa and the townships of Gloucester and Osgoode.
In 1914, it was redefined to include parts of the city of Ottawa not included in either the electoral district of Ottawa or Rideau Ward of Ottawa.
In 1924, it was redefined as consisting of the county of Carleton, excluding the townships of Gloucester and Osgoode and that part of the city of Ottawa lying east of a line drawn from south to north along the Canadian Pacific Railway line, Somerset Street, Bayswater Avenue, Bayview Road, and Mason Street to the Ottawa River.
In 1933, it was redefined as consisting of the county of Carleton, excluding the township of Gloucester, the town of Eastview, the village of Rockcliffe Park and the part of the city of Ottawa lying east of Parkdale Avenue.
In 1947, it was redefined as consisting of the county of Carleton, excluding the township of Gloucester, the town of Eastview and the village of Rockcliffe Park, and including the parts of Victoria and Elmdale wards in the city of Ottawa west of Parkdale Avenue, the part of Dalhousie ward south of Carling Avenue, the part of Capital ward south of Carling Avenue and Linden Terrace, and the part of Riverdale ward south of Riverdale Avenue and west of Main Street.
In 1952, it was redefined as consisting of the county of Carleton (excluding the township of Gloucester, the town of Eastview and the village of Rockcliffe Park), and the part of the city of Ottawa west of a line drawn from north to south along Parkdale Avenue, east along Carling Avenue, north along O'Connor Street, east along Linden Terrace to the Rideau Canal, south along the canal, east along Echo Drive, northeast along Riverdale Avenue, south along Main Street, southwest along the Rideau River.
The electoral district was abolished in 1966 when it was redistributed between Grenville—Carleton, Lanark and Renfrew, Ottawa Centre, Ottawa West and Ottawa—Carleton ridings.
The riding is set to be recreated in 2015 by the 2012 federal electoral boundaries redistribution and was legally defined in the 2013 representation order. Initially, the riding was known as Rideau—Carleton. 40.58% of the riding comes from the riding of Carleton—Mississippi Mills, 59.37% from Nepean—Carleton and 0.04% from Ottawa South. It will come into effect upon the call of the next federal election, currently scheduled for October 2015.
Members of Parliament of Upper Canada
- (returned two members from 1831 to 1840)
- William Morris (1821–1825)
- George Thew Burke (1825–1829)
- Thomas Mabon Radenhurst (1829–1831)
- Hamnett Kirkes Pinhey (1831) and John Bower Lewis (1831–1840)
- George Lyon (1831–1835)
- Edward Malloch (1835–1840)
Members of Parliament of the Province of Canada
- James Johnston, Reformer (1841–1846)
- George Lyon, Conservative (1846–1848)
- Edward Malloch (1848–1854)
- William F. Powell, Conservative (1854–1866)
Members of Parliament
This riding has elected the following Members of Parliament:
Election results
Carleton, 2015–present
| Canadian federal election, 2015 | ||||||||
|---|---|---|---|---|---|---|---|---|
| Party | Candidate | Votes | % | ±% | Expenditures | |||
| Conservative | Pierre Poilievre | 27,762 | 46.86 | -14.81 | $166,805.35 | |||
| Liberal | Chris Rodgers | 25,913 | 43.74 | +22.88 | $101,336.54 | |||
| New Democratic | KC Larocque | 3,632 | 6.13 | -7.22 | $17,692.44 | |||
| Green | Deborah Coyne | 1,932 | 3.26 | -0.86 | $15,632.31 | |||
| Total valid votes/Expense limit | 59,239 | 100.00 | $206,141.87 | |||||
| Total rejected ballots | 196 | 0.33 | – | |||||
| Turnout | 59,435 | 80.95 | – | |||||
| Eligible voters | 73,418 | |||||||
| Conservative hold | Swing | -18.84 | ||||||
| 2011 federal election redistributed results[3] | |||
|---|---|---|---|
| Party | Vote | % | |
| Conservative | 28,928 | 61.67 | |
| Liberal | 9,786 | 20.86 | |
| New Democratic | 6,262 | 13.35 | |
| Green | 1,932 | 4.11 | |
Carleton, 1867–1968
| Canadian federal election, 1965 | ||||||||
|---|---|---|---|---|---|---|---|---|
| Party | Candidate | Votes | % | ±% | ||||
| Progressive Conservative | Dick Bell | 32,456 | 43.90 | –2.39 | ||||
| Liberal | Lloyd Francis | 31,523 | 42.64 | –5.37 | ||||
| New Democratic | Donald V. Stirling | 9,953 | 13.46 | +8.79 | ||||
| Total valid votes | 73,932 | 100.0 | ||||||
| Progressive Conservative gain from Liberal | Swing | +1.49 | ||||||
| Canadian federal election, 1963 | ||||||||
|---|---|---|---|---|---|---|---|---|
| Party | Candidate | Votes | % | ±% | ||||
| Liberal | Lloyd Francis | 32,325 | 48.01 | +6.02 | ||||
| Progressive Conservative | Dick Bell | 31,168 | 46.29 | –5.40 | ||||
| New Democratic | Lewis Hanley | 3,144 | 4.67 | –0.19 | ||||
| Social Credit | Harold Herbert Splett | 699 | 1.04 | –0.44 | ||||
| Total valid votes | 67,336 | 100.0 | ||||||
| Liberal gain from Progressive Conservative | Swing | +5.71 | ||||||
| Canadian federal election, 1962 | ||||||||
|---|---|---|---|---|---|---|---|---|
| Party | Candidate | Votes | % | ±% | ||||
| Progressive Conservative | Dick Bell | 32,125 | 51.66 | –15.81 | ||||
| Liberal | Lloyd Francis | 26,109 | 41.99 | +13.86 | ||||
| New Democratic | Lewis Hanley | 3,024 | 4.86 | +1.20 | ||||
| Social Credit | Harold Herbert Splett | 922 | 1.48 | +0.75 | ||||
| Total valid votes | 62,180 | 100.0 | ||||||
| Progressive Conservative hold | Swing | –14.84 | ||||||
| Canadian federal election, 1958 | ||||||||
|---|---|---|---|---|---|---|---|---|
| Party | Candidate | Votes | % | ±% | ||||
| Progressive Conservative | Dick Bell | 32,741 | 67.47 | +5.69 | ||||
| Liberal | George Humble | 13,652 | 28.13 | –5.79 | ||||
| Co-operative Commonwealth | Stewart I. Crawford | 1,777 | 3.66 | +0.70 | ||||
| Social Credit | Grace Gough | 355 | 0.73 | –0.62 | ||||
| Total valid votes | 48,525 | 100.0 | ||||||
| Progressive Conservative hold | Swing | +5.74 | ||||||
| Canadian federal election, 1957 | ||||||||
|---|---|---|---|---|---|---|---|---|
| Party | Candidate | Votes | % | ±% | ||||
| Progressive Conservative | Dick Bell | 27,865 | 61.78 | +6.53 | ||||
| Liberal | Frank Egan Dunlap | 15,298 | 33.92 | –6.34 | ||||
| Co-operative Commonwealth | Stewart I. Crawford | 1,334 | 2.96 | +0.01 | ||||
| Social Credit | Eric Kingsley Fallis | 607 | 1.35 | –0.19 | ||||
| Total valid votes | 45,104 | 100.0 | ||||||
| Progressive Conservative hold | Swing | +6.44 | ||||||
| Canadian federal election, 1953 | ||||||||
|---|---|---|---|---|---|---|---|---|
| Party | Candidate | Votes | % | ±% | ||||
| Progressive Conservative | George Drew | 20,137 | 55.25 | +2.26 | ||||
| Liberal | John H. McDonald | 14,676 | 40.26 | –0.45 | ||||
| Co-operative Commonwealth | Stewart I. Crawford | 1,075 | 2.95 | –3.35 | ||||
| Social Credit | Eric Kingsley Fallis | 562 | 1.54 | |||||
| Total valid votes | 36,450 | 100.0 | ||||||
| Progressive Conservative hold | Swing | +1.36 | ||||||
| Canadian federal election, 1949 | ||||||||
|---|---|---|---|---|---|---|---|---|
| Party | Candidate | Votes | % | ±% | ||||
| Progressive Conservative | George Drew | 18,141 | 52.99 | –23.28 | ||||
| Liberal | John H. McDonald | 13,937 | 40.71 | |||||
| Co-operative Commonwealth | Eugene Forsey | 2,155 | 6.30 | –14.63 | ||||
| Total valid votes | 34,233 | 100.0 | ||||||
| Progressive Conservative hold | Swing | –32.00 | ||||||
| Canadian federal by-election, 20 December 1948 On the resignation of G. Russell Boucher, 1 November 1948 | ||||||||
|---|---|---|---|---|---|---|---|---|
| Party | Candidate | Votes | % | ±% | ||||
| Progressive Conservative | George Drew | 12,284 | 76.27 | +14.01 | ||||
| Co-operative Commonwealth | Eugene Forsey | 3,371 | 20.93 | +13.46 | ||||
| Social Credit | J. Nelson McCracken | 451 | 2.80 | |||||
| Total valid votes | 16,106 | 100.0 | ||||||
| Progressive Conservative hold | Swing | +0.28 | ||||||
| Canadian federal election, 1945 | ||||||||
|---|---|---|---|---|---|---|---|---|
| Party | Candidate | Votes | % | ±% | ||||
| Progressive Conservative | G. Russell Boucher | 10,916 | 62.26 | –18.04 | ||||
| Liberal | Leonard Anthony Davis | 5,309 | 30.28 | |||||
| Co-operative Commonwealth | Douglas D. Irwin | 1,309 | 7.47 | |||||
| Total valid votes | 17,534 | 100.0 | ||||||
| Progressive Conservative hold | Swing | –24.16 | ||||||
| Canadian federal by-election, 19 August 1940 On the death of Alonzo Hyndman, 9 April 1940 | ||||||||
|---|---|---|---|---|---|---|---|---|
| Party | Candidate | Votes | % | ±% | ||||
| Conservative | George Russell Boucher | 6,045 | 80.30 | +26.40 | ||||
| New Democracy | John Nelson McCracken | 1,483 | 19.70 | |||||
| Total valid votes | 7,528 | 100.0 | ||||||
| Conservative hold | Swing | |||||||
| Canadian federal election, 1940 | ||||||||
|---|---|---|---|---|---|---|---|---|
| Party | Candidate | Votes | % | ±% | ||||
| National Government | Alonzo Bowen Hyndman | 7,736 | 53.90 | +11.54 | ||||
| Liberal | Herbert Samuel Arkell | 6,617 | 46.10 | +9.61 | ||||
| Total valid votes | 14,353 | 100.0 | ||||||
| National Government hold | Swing | +0.96 | ||||||
| Canadian federal election, 1935 | ||||||||
|---|---|---|---|---|---|---|---|---|
| Party | Candidate | Votes | % | ±% | ||||
| Conservative | Alonzo Bowen Hyndman | 6,872 | 42.36 | –1.42 | ||||
| Liberal | Herbert Samuel Arkell | 5,919 | 36.49 | –5.56 | ||||
| Reconstruction | Herman Ralph James | 3,431 | 21.15 | |||||
| Total valid votes | 16,222 | 100.0 | ||||||
| Conservative hold | Swing | +2.07 | ||||||
| Canadian federal election, 1930 | ||||||||
|---|---|---|---|---|---|---|---|---|
| Party | Candidate | Votes | % | ±% | ||||
| Conservative | William Foster Garland | 7,317 | 43.78 | –12.57 | ||||
| Liberal | Mortimer Newton Cummings | 7,027 | 42.05 | –1.60 | ||||
| Independent Conservative | Robert Ormond Morris | 2,369 | 14.17 | |||||
| Total valid votes | 16,713 | 100.0 | ||||||
| Conservative hold | Swing | –5.48 | ||||||
| Canadian federal election, 1926 | ||||||||
|---|---|---|---|---|---|---|---|---|
| Party | Candidate | Votes | % | ±% | ||||
| Conservative | William Foster Garland | 7,415 | 56.35 | –1.09 | ||||
| Liberal | Mortimer Newton Cummings | 5,744 | 43.65 | +1.09 | ||||
| Total valid votes | 13,159 | 100.0 | ||||||
| Conservative hold | Swing | –1.09 | ||||||
| Canadian federal election, 1925 | ||||||||
|---|---|---|---|---|---|---|---|---|
| Party | Candidate | Votes | % | ±% | ||||
| Conservative | William Foster Garland | 7,757 | 57.44 | +16.15 | ||||
| Liberal | Mortimer Newton Cummings | 5,748 | 42.56 | +11.67 | ||||
| Total valid votes | 13,505 | 100.0 | ||||||
| Conservative hold | Swing | +2.24 | ||||||
| Canadian federal election, 1921 | ||||||||
|---|---|---|---|---|---|---|---|---|
| Party | Candidate | Votes | % | ±% | ||||
| Conservative | William Foster Garland | 5,537 | 41.29 | –25.18 | ||||
| Liberal | William Lochead Gourlay | 4,142 | 30.89 | –2.64 | ||||
| Progressive | Bower Henry | 3,474 | 25.91 | |||||
| Independent | Edward Hill Good | 257 | 1.92 | |||||
| Total valid votes | 13,410 | 100.0 | ||||||
| Conservative hold | Swing | –11.27 | ||||||
| Canadian federal election, 1917 | ||||||||
|---|---|---|---|---|---|---|---|---|
| Party | Candidate | Votes | % | ±% | ||||
| Government (Unionist) | George Boyce | 5,290 | 66.47 | +0.33 | ||||
| Opposition (Laurier Liberals) | Frederick Henry Honeywell | 2,669 | 33.53 | –0.33 | ||||
| Total valid votes | 7,959 | 100.0 | ||||||
| Government (Unionist) hold | Swing | +0.33 | ||||||
| Canadian federal by-election, 30 October 1912 On the death of Edward Kidd, 16 September 1912 | ||||||||
|---|---|---|---|---|---|---|---|---|
| Party | Candidate | Votes | ||||||
| Conservative | William Foster Garland | acclaimed | ||||||
| Canadian federal election, 1911 | ||||||||
|---|---|---|---|---|---|---|---|---|
| Party | Candidate | Votes | % | ±% | ||||
| Conservative | Edward Kidd | 2,616 | 66.14 | –1.14 | ||||
| Liberal | Donald Hector MacLean | 1,339 | 33.86 | +1.14 | ||||
| Total valid votes | 3,955 | 100.0 | ||||||
| Conservative hold | Swing | –1.14 | ||||||
| Canadian federal by-election, 22 February 1909 On the election of Robert Borden to Halifax and Carleton, and his choosing to sit for Halifax, 25 January 1909 | ||||||||
|---|---|---|---|---|---|---|---|---|
| Party | Candidate | Votes | ||||||
| Conservative | Edward Kidd | acclaimed | ||||||
| Canadian federal election, 1908 | ||||||||
|---|---|---|---|---|---|---|---|---|
| Party | Candidate | Votes | % | ±% | ||||
| Conservative | Robert Laird Borden | 2,667 | 67.28 | +3.72 | ||||
| Liberal | James Ernest Caldwell | 1,297 | 32.72 | –3.72 | ||||
| Total valid votes | 3,964 | 100.0 | ||||||
| Conservative hold | Swing | +3.72 | ||||||
| Canadian federal by-election, 4 February 1905 On the resignation of Edward Kidd, 19 January 1905 | ||||||||
|---|---|---|---|---|---|---|---|---|
| Party | Candidate | Votes | ||||||
| Conservative | Robert Laird Borden | acclaimed | ||||||
| Canadian federal election, 1904 | ||||||||
|---|---|---|---|---|---|---|---|---|
| Party | Candidate | Votes | % | ±% | ||||
| Conservative | Edward Kidd | 2,055 | 63.56 | –1.01 | ||||
| Liberal | James E. Caldwell | 1,178 | 36.44 | +1.01 | ||||
| Total valid votes | 3,233 | 100.0 | ||||||
| Conservative hold | Swing | –1.01 | ||||||
| Canadian federal election, 1900 | ||||||||
|---|---|---|---|---|---|---|---|---|
| Party | Candidate | Votes | % | ±% | ||||
| Conservative | Edward Kidd | 1,611 | 64.57 | +17.06 | ||||
| Liberal | John McKellar | 884 | 35.43 | –4.66 | ||||
| Total valid votes | 2,495 | 100.0 | ||||||
| Conservative hold | Swing | +10.86 | ||||||
| Canadian federal election, 1896 | ||||||||
|---|---|---|---|---|---|---|---|---|
| Party | Candidate | Votes | % | ±% | ||||
| Conservative | William T. Hodgins | 1,337 | 47.51 | –3.22 | ||||
| Liberal | John McKellar | 1,128 | 40.09 | |||||
| Independent | J.S. Hendricks | 299 | 10.63 | |||||
| McCarthyite | Thomas Butler | 50 | 1.78 | |||||
| Total valid votes | 2,814 | 100.0 | ||||||
| Conservative hold | Swing | |||||||
| Canadian federal election, 1891 | ||||||||
|---|---|---|---|---|---|---|---|---|
| Party | Candidate | Votes | % | ±% | ||||
| Conservative | William Thomas Hodgins | 1,494 | 50.73 | |||||
| Conservative | George Lemuel Dickinson | 1,451 | 49.27 | –12.30 | ||||
| Total valid votes | 2,945 | 100.0 | ||||||
| Conservative hold | Swing | |||||||
| Canadian federal by-election, 1 February 1888 On the election of John A. Macdonald to sit for Kingston | ||||||||
|---|---|---|---|---|---|---|---|---|
| Party | Candidate | Votes | % | ±% | ||||
| Conservative | George Lemuel Dickinson | 1,524 | 61.57 | |||||
| Unknown | W. F. Powell | 951 | 38.42 | |||||
| Total valid votes | 2,475 | 100.0 | ||||||
| Conservative gain from Liberal–Conservative | Swing | |||||||
| Canadian federal election, 1887 | ||||||||
|---|---|---|---|---|---|---|---|---|
| Party | Candidate | Votes | % | ±% | ||||
| Liberal–Conservative | John A. Macdonald | 1,691 | 73.62 | +24.87 | ||||
| Liberal | John K. Stewart | 606 | 26.38 | |||||
| Total valid votes | 2,297 | 100.0 | ||||||
| Liberal–Conservative hold | Swing | |||||||
| Canadian federal election, 1882 | ||||||||
|---|---|---|---|---|---|---|---|---|
| Party | Candidate | Votes | % | ±% | ||||
| Liberal–Conservative | John A. Macdonald | 1,185 | 48.75 | |||||
| Unknown | John May | 629 | 25.87 | |||||
| Unknown | Erskine Henry Bronson | 617 | 25.38 | |||||
| Total valid votes | 2,431 | 100.0 | ||||||
| Liberal–Conservative gain from Conservative | Swing | |||||||
| Canadian federal election, 1878 | ||||||||
|---|---|---|---|---|---|---|---|---|
| Party | Candidate | Votes | % | ±% | ||||
| Conservative | John Rochester | 1,282 | 49.73 | +2.65 | ||||
| Unknown | John May | 1,196 | 46.39 | |||||
| Unknown | J. A. Grant | 86 | 3.34 | |||||
| Unknown | Nicholas Sparks, Jr. | 14 | 0.54 | |||||
| Total valid votes | 2,578 | 100.0 | ||||||
| Conservative hold | Swing | |||||||
| Canadian federal election, 1874 | ||||||||
|---|---|---|---|---|---|---|---|---|
| Party | Candidate | Votes | % | ±% | ||||
| Conservative | John Rochester | 870 | 47.08 | –5.89 | ||||
| Unknown | John Holmes | 631 | 34.15 | –12.46 | ||||
| Unknown | J. Wallace | 347 | 18.78 | |||||
| Total valid votes | 1,848 | 100.0 | ||||||
| Conservative hold | Swing | +3.28 | ||||||
| Canadian federal election, 1872 | ||||||||
|---|---|---|---|---|---|---|---|---|
| Party | Candidate | Votes | % | ±% | ||||
| Conservative | John Rochester | 1,024 | 52.97 | +4.91 | ||||
| Unknown | John Holmes | 901 | 46.61 | –5.33 | ||||
| Unknown | William Montgomery | 6 | 0.31 | |||||
| Unknown | J. Mills | 2 | 0.10 | |||||
| Total valid votes | 1,933 | 100.0 | ||||||
| Conservative gain from Liberal–Conservative | Swing | +5.12 | ||||||
| Canadian federal election, 1867 | ||||||||
|---|---|---|---|---|---|---|---|---|
| Party | Candidate | Votes | % | |||||
| Liberal–Conservative | John Holmes | 1,087 | 51.94 | |||||
| Conservative | John Rochester | 1,006 | 48.06 | |||||
| Total valid votes | 2,093 | 100.0 | ||||||