Kingston and the Islands
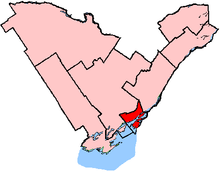 Kingston and the Islands shown within the Eastern Ontario region | |||
| Federal electoral district | |||
| Legislature | House of Commons | ||
| MP |
Liberal | ||
| District created | 1966 | ||
| First contested | 1968 | ||
| Last contested | 2015 | ||
| District webpage | profile, map | ||
| Demographics | |||
| Population (2011)[1] | 116,996 | ||
| Electors (2015) | 87,460 | ||
| Area (km²)[2] | 434 | ||
| Pop. density (per km²) | 269.6 | ||
| Census divisions | Frontenac | ||
| Census subdivisions | Frontenac Islands, Kingston | ||
Kingston and the Islands (French: Kingston et les Îles) is a federal electoral district in Ontario, Canada, that has been represented in the House of Commons of Canada since 1968.
It covers part of the city of Kingston, Ontario and the sparsely populated Frontenac Islands in the St. Lawrence River.
It has been represented since the 2015 federal election by Liberal Mark Gerretsen.
Demographics
- Average family income: $68,494[3] (2001)
- Median household income: $46,310[4]
- Unemployment: 7.4%
- Language, Mother Tongue: English 84%, French 3%, Other 13%
- Religion: No Religious Affiliation 30%, Catholic 28%, Protestant 27%, Orthodox Christian 1%, Other Christian 10%, Muslim 2%, Jewish 1%, Other 1%[5]
- Visible Minority: Black 1%, Chinese 1%, South Asian 1%, Others 2%
History
The riding was created in 1966 from Kingston and parts of Hastings—Frontenac—Lennox and Addington and Prince Edward—Lennox.
In 1966, it was defined to consist of the City of Kingston, the Townships of Howe Island, Kingston and Wolfe Island, and the southwest part of the Township of Pittsburg, in the County of Frontenac; and the Township of Amherst Island in the County of Lennox and Addington.
In 1996, the Township of Pittsburgh portion of the riding was redefined to consist of the part of the township lying to the south of Highway 401.
In 2003, it was redefined to consist of the Township of Frontenac Islands and the City of Kingston in the County of Frontenac.
In 2013, the riding's borders were adjusted to remove the area north of Highway 401 from the riding, which will become part of the new district of Lanark—Frontenac—Kingston. These new borders came into effect for the 2015 federal election, scheduled for 19 October.
Members of Parliament
This riding has elected the following Members of Parliament:
| Parliament | Years | Member | Party | |
|---|---|---|---|---|
| Kingston and the Islands Riding created from Kingston, Hastings—Frontenac—Lennox and Addington and Prince Edward—Lennox |
||||
| 28th | 1968–1972 | Edgar Benson | Liberal | |
| 29th | 1972–1974 | Flora MacDonald | Progressive Conservative | |
| 30th | 1974–1979 | |||
| 31st | 1979–1980 | |||
| 32nd | 1980–1984 | |||
| 33rd | 1984–1988 | |||
| 34th | 1988–1993 | Peter Milliken | Liberal | |
| 35th | 1993–1997 | |||
| 36th | 1997–2000 | |||
| 37th | 2000–2004 | |||
| 38th | 2004–2006 | |||
| 39th | 2006–2008 | |||
| 40th | 2008–2011 | |||
| 41st | 2011–2015 | Ted Hsu | ||
| 42nd | 2015–Present | Mark Gerretsen | ||
Election results
| Canadian federal election, 2015 | ||||||||
|---|---|---|---|---|---|---|---|---|
| Party | Candidate | Votes | % | ±% | Expenditures | |||
| Liberal | Mark Gerretsen | 36,421 | 55.37 | +15.35 | $146,934.43 | |||
| Conservative | Andy Brooke | 14,928 | 22.70 | -11.36 | $97,596.78 | |||
| New Democratic | Daniel Beals | 11,185 | 17.01 | -4.61 | $44,779.89 | |||
| Green | Nathan Townend | 2,933 | 4.46 | +0.15 | $7,750.70 | |||
| Libertarian | Luke McAllister | 305 | 0.46 | – | – | |||
| Total valid votes/Expense limit | 65,772 | 100.00 | $230,365.62 | |||||
| Total rejected ballots | 242 | 0.37 | – | |||||
| Turnout | 66,014 | 73.36 | – | |||||
| Eligible voters | 89,990 | |||||||
| Liberal hold | Swing | +13.36 | ||||||
| Source: Elections Canada[6][7] | ||||||||
| 2011 federal election redistributed results[8] | |||
|---|---|---|---|
| Party | Vote | % | |
| Liberal | 22,666 | 40.02 | |
| Conservative | 19,289 | 34.06 | |
| New Democratic | 12,243 | 21.62 | |
| Green | 2,438 | 4.30 | |
| Canadian federal election, 2011 | ||||||||
|---|---|---|---|---|---|---|---|---|
| Party | Candidate | Votes | % | ±% | ||||
| Liberal | Ted Hsu | 23,842 | 39.31 | +0.16 | ||||
| Conservative | Alicia Gordon | 21,189 | 34.93 | +2.39 | ||||
| New Democratic | Daniel Beals | 13,065 | 21.54 | +4.05 | ||||
| Green | Eric Walton | 2,561 | 4.22 | −6.60 | ||||
| Total valid votes | 60,657 | 100.00 | ||||||
| Total rejected ballots | 219 | 0.36 | +0.01 | |||||
| Turnout | 60,876 | 63.90 | +1.90 | |||||
| Eligible voters | 95,265 | |||||||
| Canadian federal election, 2008 | ||||||||
|---|---|---|---|---|---|---|---|---|
| Party | Candidate | Votes | % | ±% | Expenditures | |||
| Liberal | Peter Milliken | 22,734 | 39.15 | −6.8 | $58,470 | |||
| Conservative | Brian Abrams | 18,895 | 32.54 | +6.5 | $89,566 | |||
| New Democratic | Rick Downes | 10,158 | 17.49 | −1.7 | $31,946 | |||
| Green | Eric Walton | 6,282 | 10.82 | +2.8 | $28,227 | |||
| Total valid votes/Expense limit | 58,069 | 100.00 | $94,357 | |||||
| Total rejected ballots | 205 | 0.35 | ||||||
| Turnout | 58,274 | 62.0 | ||||||
| Canadian federal election, 2006 | ||||||||
|---|---|---|---|---|---|---|---|---|
| Party | Candidate | Votes | % | ±% | Expenditures | |||
| Liberal | Peter Milliken | 28,548 | 45.9 | −6.5 | $51,251 | |||
| Conservative | Lou Grimshaw | 16,230 | 26.1 | +3.0 | $60,915 | |||
| New Democratic | Rob Hutchison | 11,946 | 19.2 | +2.8 | $28,094 | |||
| Green | Eric Walton | 5,006 | 8.0 | +1.9 | $18,532 | |||
| Independent | Karl Eric Walker | 296 | 0.5 | +0.1 | $0 | |||
| Canadian Action | Don Rogers | 222 | 0.4 | 0.0 | $6,360 | |||
| Total valid votes/Expense limit | 62,248 | 100.0 | ||||||
| Total rejected ballots | 240 | |||||||
| Turnout | 62,488 | 65.97 | ||||||
| Electors on the lists | 94,720 | |||||||
| Sources: Official Results, Elections Canada and Financial Returns, Elections Canada. | ||||||||
| Canadian federal election, 2004 | ||||||||
|---|---|---|---|---|---|---|---|---|
| Party | Candidate | Votes | % | ±% | Expenditures | |||
| Liberal | Peter Milliken | 28,544 | 52.3 | +0.6 | $45,543.70 | |||
| Conservative | Blair MacLean | 12,582 | 23.1 | −10.4 | $83,209.34 | |||
| New Democratic | Rob Hutchison | 8,964 | 16.4 | +6.8 | $18,440.27 | |||
| Green | Janina Fisher Balfour | 3,339 | 6.1 | +0.9 | $14,087.39 | |||
| Christian Heritage | Terry Marshall | 481 | 0.9 | – | $1,652.04 | |||
| Independent | Rosie the Clown Elston | 237 | 0.4 | – | $134.54 | |||
| Canadian Action | Don Rogers | 179 | 0.3 | – | $6,285.00 | |||
| Independent | Karl Eric Walker | 100 | 0.4 | – | $670.21 | |||
| Total valid votes | 54,563 | 100.00 | ||||||
| Total rejected ballots | 175 | |||||||
| Turnout | 54,601 | 60.32 | ||||||
| Electors on the lists | 90,523 | |||||||
| Percentage change figures are factored for redistribution. Conservative Party percentages are contrasted with the combined Canadian Alliance and Progressive Conservative percentages from the 2000 election. | ||||||||
| Sources: Official Results, Elections Canada and Financial Returns, Elections Canada. | ||||||||
| Canadian federal election, 2000 | ||||||||
|---|---|---|---|---|---|---|---|---|
| Party | Candidate | Votes | % | ±% | Expenditures | |||
| Liberal | Peter Milliken | 26,457 | 51.7 | +2.2 | $38,161.64 | |||
| Progressive Conservative | Blair MacLean | 9,222 | 18.0 | −3.8 | $58,975.69 | |||
| Alliance | Kevin Goligher | 7,904 | 15.4 | +2.4 | $28,534.05 | |||
| New Democratic | Gary Wilson | 4,951 | 9.7 | −2.8 | $27,262.77 | |||
| Green | Chris Milburn | 2,652 | 5.2 | +3.4 | $4,200.19 | |||
| Total valid votes | 51,186 | 100.0 | ||||||
| Total rejected ballots | 203 | |||||||
| Turnout | 51,389 | 58.53 | ||||||
| Electors on the lists | 87,793 | |||||||
| Note: Canadian Alliance vote is compared to the Reform vote in 1997 election. | ||||||||
| Sources: Official Results, Elections Canada and Financial Returns, Elections Canada. | ||||||||
| Canadian federal election, 1997 | ||||||||
|---|---|---|---|---|---|---|---|---|
| Party | Candidate | Votes | % | ±% | ||||
| Liberal | Peter Milliken | 25,632 | 49.5 | −7.2 | $39,224 | |||
| Progressive Conservative | Helen Cooper | 11,296 | 21.8 | +3.0 | $44,719 | |||
| Reform | Dave Clarke | 6,761 | 13.1 | +0.5 | $33,384 | |||
| New Democratic | Gary Wilson | 6,433 | 12.4 | +5.5 | $28,694 | |||
| Green | Chris Walker | 902 | 1.7 | – | $1,748 | |||
| Christian Heritage | Terry Marshall | 751 | 1.5 | +0.2 | $127 | |||
| Total valid votes | 51,775 | 100.0 | ||||||
| Total rejected ballots | 239 | |||||||
| Turnout | 52,014 | 62.77 | ||||||
| Electors on the lists | 82,869 | |||||||
| Sources: Official Results, Elections Canada and Financial Returns, Elections Canada. | ||||||||
| Canadian federal election, 1993 | ||||||||
|---|---|---|---|---|---|---|---|---|
| Party | Candidate | Votes | % | Expenditures | ||||
| Liberal | Peter Milliken | 32,372 | 56.46 | $45,912 | ||||
| Progressive Conservative | Barry Gordon | 10,935 | 19.07 | $54,157 | ||||
| Reform | Sean McAdam | 7,175 | 12.51 | $32,259 | ||||
| New Democratic | Mary Ann Higgs | 4,051 | 7.06 | $22,979 | ||||
| National | Chris Papadopoulos | 1,768 | 3.08 | $8,171 | ||||
| Christian Heritage | Terry Marshall | 663 | 1.16 | $1,442 | ||||
| Natural Law | Chris Wilson | 376 | 0.66 | $0 | ||||
| Total valid votes | 57,340 | 100.00 | ||||||
| Total rejected ballots | 369 | |||||||
| Turnout | 57,709 | 60.65 | ||||||
| Electors on the lists | 95,154 | |||||||
| Source: Thirty-fifth General Election, 1993: Official Voting Results, Published by the Chief Electoral Officer of Canada. Financial figures taken from official contributions and expenses provided by Elections Canada. | ||||||||
| Canadian federal election, 1988 | ||||||||
|---|---|---|---|---|---|---|---|---|
| Party | Candidate | Votes | % | ±% | ||||
| Liberal | Peter Milliken | 23,121 | 40.6 | +12.9 | $38,348 | |||
| Progressive Conservative | Flora MacDonald | 20,409 | 35.9 | −19.2 | $46,265 | |||
| New Democratic | Len Johnson | 11,442 | 20.1 | +7.5 | $47,572 | |||
| Christian Heritage | Terry Marshall | 1,646 | 2.9 | – | $15,262 | |||
| Libertarian | John Hayes | 301 | 0.5 | 0.0 | $1,295 | |||
| Total valid votes | 56,919 | 100.0 | ||||||
| Turnout | 57,188 | 74.26 | ||||||
| Electors on the lists | 77,014 | |||||||
| Canadian federal election, 1984 | ||||||||
|---|---|---|---|---|---|---|---|---|
| Party | Candidate | Votes | % | ±% | ||||
| Progressive Conservative | Flora MacDonald | 25,997 | 55.1 | +13.3 | ||||
| Liberal | George Speal | 13,087 | 27.7 | -11.5 | ||||
| New Democratic | Andrew Currie | 5,950 | 12.6 | -5.4 | ||||
| Independent | Daniel Eardley ("Pro-Life Party") | 1,410 | 3.0 | |||||
| Green | Ted Bond | 478 | 1.0 | |||||
| Libertarian | Ian Murray | 258 | 0.5 | |||||
| Total valid votes | 47,180 | 100.0 | ||||||
| Canadian federal election, 1980 | ||||||||
|---|---|---|---|---|---|---|---|---|
| Party | Candidate | Votes | % | ±% | ||||
| Progressive Conservative | Flora MacDonald | 18,146 | 41.8 | -5.9 | ||||
| Liberal | John Coleman | 17,039 | 39.3 | +6.0 | ||||
| New Democratic | Stephen Foster | 7,830 | 18.0 | -0.9 | ||||
| Rhinoceros | Edward Sharp | 373 | 0.9 | |||||
| Total valid votes | 43,388 | 100.0 | ||||||
| Canadian federal election, 1979 | ||||||||
|---|---|---|---|---|---|---|---|---|
| Party | Candidate | Votes | % | ±% | ||||
| Progressive Conservative | Flora MacDonald | 21,277 | 47.7 | +1.5 | ||||
| Liberal | Peter Beeman | 14,866 | 33.3 | -2.8 | ||||
| New Democratic | Stephen Foster | 8,472 | 19.0 | +1.2 | ||||
| Total valid votes | 44,615 | 100.0 | ||||||
| Canadian federal election, 1974 | ||||||||
|---|---|---|---|---|---|---|---|---|
| Party | Candidate | Votes | % | ±% | ||||
| Progressive Conservative | Flora MacDonald | 17,839 | 46.2 | -7.3 | ||||
| Liberal | Peter Watson | 13,943 | 36.1 | +3.1 | ||||
| New Democratic | Lars Thompson | 6,870 | 17.8 | +4.2 | ||||
| Total valid votes | 38,652 | 100.0 | ||||||
| Canadian federal election, 1972 | ||||||||
|---|---|---|---|---|---|---|---|---|
| Party | Candidate | Votes | % | ±% | ||||
| Progressive Conservative | Flora MacDonald | 22,824 | 53.4 | +17.3 | ||||
| Liberal | John Hazlett | 14,079 | 33.0 | -16.7 | ||||
| New Democratic | Lars Thompson | 5,807 | 13.6 | -0.6 | ||||
| Total valid votes | 42,710 | 100.0 | ||||||
| Canadian federal election, 1968 | ||||||||
|---|---|---|---|---|---|---|---|---|
| Party | Candidate | Votes | % | |||||
| Liberal | Edgar Benson | 16,234 | 49.7 | |||||
| Progressive Conservative | Boggart Trumpour | 11,799 | 36.1 | |||||
| New Democratic | Brendan McConnell | 4,636 | 14.2 | |||||
| Total valid votes | 32,669 | 100.0 | ||||||
See also
References
- "(Code 35036) Census Profile". 2011 census. Statistics Canada. 2012. Retrieved 2011-03-03.
- Federal riding history from the Library of Parliament
- 2011 Results from Elections Canada
- Campaign expense data from Elections Canada
Notes
- ↑ Statistics Canada: 2011
- ↑ Statistics Canada: 2011
- ↑ "143 Kingston and the Islands". Canada Votes. CBC.ca. Archived from the original on 16 June 2004. Retrieved 30 March 2015.
- ↑ "Election 2006". CTV.ca. Retrieved 2 September 2010.
- ↑ "NHS Profile, Kingston and the Islands, Ontario, 2011". 2011 Census. Statistics Canada. Retrieved 4 August 2018.
- ↑ Elections Canada – Confirmed candidates for Kingston and the Islands, 30 September 2015
- ↑ Elections Canada – Preliminary Election Expenses Limits for Candidates Archived 2015-08-15 at the Wayback Machine.
- ↑ Pundits' Guide to Canadian Elections