Ottawa Centre
Coordinates: 45°25′N 75°42′W / 45.417°N 75.700°W
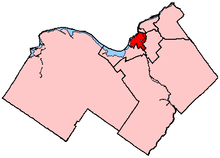 Ottawa Centre in relation to other electoral districts in Ottawa (2003 boundaries) | |||
| Federal electoral district | |||
| Legislature | House of Commons | ||
| MP |
Liberal | ||
| District created | 1966 | ||
| First contested | 1968 | ||
| Last contested | 2015 | ||
| District webpage | profile, map | ||
| Demographics | |||
| Population (2011)[1] | 113,619 | ||
| Electors (2015) | 89,360 | ||
| Area (km²)[2] | 35 | ||
| Pop. density (per km²) | 3,246.3 | ||
| Census divisions | Ottawa | ||
| Census subdivisions | Ottawa | ||
Ottawa Centre (French: Ottawa-Centre) is an urban federal electoral district in Ontario, Canada, that has been represented in the House of Commons of Canada since 1968. While the riding's boundaries (mainly to the south and west as the north and east borders have remained the Ottawa River and Rideau River, respectively) have changed over the years to account for population changes, the riding has always comprised the central areas of Ottawa, the nation's capital.
History
The riding was created in 1966 from Carleton, Ottawa West and Ottawa East ridings. It initially consisted of that part of Ottawa north of the Rideau River, west of a line following the Rideau Canal to the Canadian Pacific Railway line (currently about where Nicholas Street is), and generally east of Bayswater Road (now Ave.), and south of that the CRP line where the O-Train currently is.
The 1976 redistribution saw significant changes to the riding. It lost territory around Mechanicsville (north of Wellington Street West, west of the current O-Train) and Old Ottawa East (north of Clegg St), while gaining all of the Civic Hospital and Hintonburg neighbourhoods east of Holland Avenue and south of Wellington, Carleton Heights, Riverside Park and the Hunt Club area west of the current O-Train line.
The 1987 redistribution saw the riding expand westward to Island Park Drive, while losing all of its territory south of the Rideau River. Additionally, the riding gained back all of Old Ottawa East south of The Queensway.
The 1996 redistribution saw the riding expand further westward to Sherburne Road / Maitland Avenue north of the Queensway, as well as gaining the eastern half of Carlington (east of Merivale Road). Also, the area of Old Ottawa East north of the Queensway was added back to the riding.
The riding did not change its boundaries in 2003. Following the Canadian federal electoral redistribution, 2012, there was a minor change in the riding's southwestern boundary, which was moved from the former city limits to Baseline Road and Fisher Avenue.
Members of Parliament
The riding was won in the 1984 election by New Democrat Mike Cassidy. The riding was subsequently won by Liberal Mac Harb in the 1988 election who held it until 2003 when he was appointed to the Senate. The riding was left vacant by Prime Minister Paul Martin until the 2004 election when Ed Broadbent, a former leader of the NDP, defeated Liberal Richard Mahoney, a high-profile lawyer and Liberal strategist and long-time ally of former Prime Minister Paul Martin. The other candidates in 2004 were Mike Murphy of the Conservatives, David Chernushenko of the Greens, Louis Lang of the Marxist-Leninists, Michael Foster, Stuart Ryan of the Communists, Robert Gauthier, and Carla Marie Dancey. Paul Dewar, son of former Ottawa mayor, Marion Dewar, held the riding from 2006 until 2015. Notably, Dewar won the riding with 52 percent of ballots cast in the 2011 federal election.
Ottawa Centre is represented in the House of Commons of Canada by Catherine McKenna from the Liberal Party of Canada.
| Parliament | Years | Member | Party | |
|---|---|---|---|---|
| Ottawa Centre Riding created from Carleton, Ottawa West and Ottawa East |
||||
| 28th | 1968–1972 | George McIlraith | Liberal | |
| 29th | 1972–1974 | Hugh Poulin | ||
| 30th | 1974–1978 | |||
| 1978–1979 | Robert de Cotret | Progressive Conservative | ||
| 31st | 1979–1980 | John Leslie Evans | Liberal | |
| 32nd | 1980–1984 | |||
| 33rd | 1984–1988 | Michael Cassidy | New Democratic | |
| 34th | 1988–1993 | Mac Harb | Liberal | |
| 35th | 1993–1997 | |||
| 36th | 1997–2000 | |||
| 37th | 2000–2003 | |||
| 38th | 2004–2006 | Ed Broadbent | New Democratic | |
| 39th | 2006–2008 | Paul Dewar | ||
| 40th | 2008–2011 | |||
| 41st | 2011–2015 | |||
| 42nd | 2015–Present | Catherine McKenna | Liberal | |
Geography
The riding covers most of downtown Ottawa, including the Parliament Buildings. From the Rideau River, the riding stretches west encompassing the neighbourhoods of Downtown, Centretown (Centretown West which includes Little Italy is usually considered a distinct neighbourhood), LeBreton Flats, Mechanicsville, Hintonburg and Westboro. The riding encompasses additional neighbourhoods south of downtown, including The Glebe, Old Ottawa South, Lees Avenue, Old Ottawa East and others.
Many public sector workers live in the riding. The northern part of the riding contains many government office buildings, including Parliament Hill. The riding also includes Carleton University and Saint Paul University's (where many UOttawa students have residence) campuses and residences.
Demographics
- According to the Canada 2011 Census; 2013 representation[3][4]
Ethnic groups: 78.4% White, 4.2% Chinese, 4.0% Black, 2.8% South Asian, 2.3% Aboriginal, 2.1% Arab, 1.8% Southeast Asian, 1.2% Latin American
Languages: 71.2% English, 11.2% French, 3.3% Chinese, 1.8% Arabic, 1.5% Italian, 1.3% Spanish
Religions: 54.6% Christian (29.4% Catholic, 6.5% Anglican, 5.8% United Church, 1.9% Christian Orthodox, 1.4% Presbyterian, 1.0% Lutheran, 8.5% Other), 4.1% Muslim, 2.3% Jewish, 1.7% Buddhist, 35.2% No religion
Median income (2010): $39,769
Average income (2010): $53,940
The Ottawa Centre riding has the highest percentage of master's degree holders in all of Canada (12.7%)[5]
In the 2015 election, the riding had the highest turnout in the country with just over 82% of electors casting a ballot in the election.[6]
Election results
2015 federal election
Ottawa Centre lost a sliver of territory to Ottawa West—Nepean, as its southwestern border moved from the former Ottawa City limits to Fisher Avenue and Baseline Road. The total population of this area lost (2011 Census) was 424.[7]
Ottawa Centre saw the highest turnout in the entire country in the 2015 election.
| Canadian federal election, 2015 | ||||||||
|---|---|---|---|---|---|---|---|---|
| Party | Candidate | Votes | % | ±% | Expenditures | |||
| Liberal | Catherine McKenna | 32,111 | 42.66 | +22.54 | $192,865.14 | |||
| New Democratic | Paul Dewar | 29,098 | 38.54 | -13.62 | $196,692.80 | |||
| Conservative | Damian Konstantinakos | 10,943 | 14.49 | -7.14 | $74,191.60 | |||
| Green | Tom Milroy | 2,246 | 2.97 | -2.06 | $5,564.56 | |||
| Libertarian | Dean T. Harris | 551 | 0.73 | – | – | |||
| Rhinoceros | Conrad Lukawski | 167 | 0.22 | – | $2.96 | |||
| Marijuana | John Andrew Omowole Akpata | 160 | 0.21 | – | – | |||
| Communist | Stuart Ryan | 124 | 0.16 | – | – | |||
| Total valid votes/Expense limit | 75,500 | 100.00 | $233,540.54 | |||||
| Total rejected ballots | 386 | 0.51 | – | |||||
| Turnout | 75,886 | 82.82 | – | |||||
| Eligible voters | 91,625 | |||||||
| Liberal gain from New Democratic | Swing | +18.08 | ||||||
| Source: Elections Canada[8][9][10] | ||||||||
| 2011 federal election redistributed results[11] | |||
|---|---|---|---|
| Party | Vote | % | |
| New Democratic | 33,737 | 52.16 | |
| Conservative | 13,992 | 21.63 | |
| Liberal | 13,014 | 20.12 | |
| Green | 3,256 | 5.03 | |
| Others | 685 | 1.06 | |
2011 federal election
| Canadian federal election, 2011 | ||||||||
|---|---|---|---|---|---|---|---|---|
| Party | Candidate | Votes | % | ±% | ||||
| New Democratic | Paul Dewar | 33,805 | 52.11 | +12.37 | ||||
| Conservative | Damian Konstantinakos | 14,063 | 21.68 | -1.89 | ||||
| Liberal | Scott Bradley | 13,049 | 20.12 | -5.90 | ||||
| Green | Jen Hunter | 3,262 | 5.03 | -4.89 | ||||
| Marijuana | John Andrew Akpata | 326 | 0.50 | -0.09 | ||||
| Independent | Romeo Bellai | 210 | 0.32 | – | ||||
| Communist | Stuart Ryan | 109 | 0.17 | – | ||||
| Marxist–Leninist | Pierre Soublière | 44 | 0.07 | -0.08 | ||||
| Total valid votes/Expense limit | 64,868 | 100.00 | ||||||
| Total rejected ballots | 267 | 0.41 | 0.00 | |||||
| Turnout | 65,135 | 74.96 | +5.85 | |||||
| Eligible voters | 86,898 | |||||||
2008 federal election
| Canadian federal election, 2008 | ||||||||
|---|---|---|---|---|---|---|---|---|
| Party | Candidate | Votes | % | ±% | Expenditures | |||
| New Democratic | Paul Dewar | 25,399 | 39.74 | +2.81 | $74,532 | |||
| Liberal | Penny Collenette | 16,633 | 26.02 | −3.18 | $85,082 | |||
| Conservative | Brian McGarry | 15,065 | 23.57 | +0.87 | $85,487 | |||
| Green | Jen Hunter | 6,348 | 9.93 | −0.22 | $41,577 | |||
| Marijuana | John Akpata | 378 | 0.59 | +0.01 | none listed | |||
| Marxist–Leninist | Pierre Soublière | 95 | 0.15 | +0.05 | none listed | |||
| Total valid votes/Expenditure limit | 63,918 | 100.00 | – | $91,849 | ||||
| Total rejected ballots | 266 | 0.41 | ||||||
| Turnout | 64,184 | 69.11 | ||||||
| Electors on the lists | 92,877 | |||||||
| New Democratic hold | Swing | +3.0 | ||||||
2006 federal election
Broadbent announced in 2005 that he would not run for re-election so he could devote more time to care for his ailing wife, Lucille. Richard Mahoney was again the Liberal candidate, hoping that, without an opposing star candidate, such as Broadbent, he would be elected this time. The NDP nominated Paul Dewar, a teacher and son of former mayor Marion Dewar. As the Liberal national numbers declined over the course of the campaign, it seemed more likely that the NDP could retain the seat. Mahoney went on the offensive late in the campaign, claiming a vote for Paul Dewar would help the Conservatives. Dewar retained most of Broadbent's voters and won by over 5000 votes. The riding also gave the Green Party of Canada one of its best performances nationwide with over 6,500 votes, over 10%.
| Canadian federal election, 2006 | ||||||||
|---|---|---|---|---|---|---|---|---|
| Party | Candidate | Votes | % | ±% | ||||
| New Democratic | Paul Dewar | 24,611 | 36.93 | -4.12 | ||||
| Liberal | Richard Mahoney | 19,458 | 29.20 | -1.87 | ||||
| Conservative | Keith Fountain | 15,126 | 22.70 | +3.67 | ||||
| Green | David Chernushenko | 6,766 | 10.15 | +2.61 | ||||
| Marijuana | John Akpata | 386 | 0.58 | -0.14 | ||||
| Independent | Anwar Syed | 121 | 0.18 | |||||
| Communist | Stuart Ryan | 102 | 0.15 | +0.01 | ||||
| Marxist–Leninist | Christian Legeais | 68 | 0.10 | -0.02 | ||||
| Total valid votes | 66,638 | 100.00 | ||||||
| New Democratic Party hold | Swing | -1.1 | ||||||
2006 nomination contests
| New Democratic Party | ||
| Candidate | Residence | June 22, 2005 |
|---|---|---|
| Tiffani Murray | Ottawa | |
| Jamey Heath | Ottawa | |
| Paul Dewar | Ottawa | X |
| Shannon Lee Mannion | Ottawa | |
| Liberal Party of Canada | ||
| Candidate | Residence | May 17, 2005 |
|---|---|---|
| Richard Mahoney | Ottawa | X |
| Conservative Party of Canada | ||
| Candidate | Residence | May 15, 2005 |
|---|---|---|
| Keith A. Fountain | Ottawa | X |
| Guy Dufort | Ottawa | |
| Idris Ben-Tahir | Ottawa | |
2004 federal election
The 2004 election was an unusual campaign in Ottawa Centre. The seat was vacated in September 2003 when Liberal incumbent Mac Harb received his long-awaited patronage appointment to the Senate of Canada from outgoing Prime Minister Jean Chrétien.[12] Paul Martin loyalist Richard Mahoney won the Liberal nomination and expected to win the riding.
Former NDP leader and widely respected statesman Ed Broadbent came out of political retirement to win the NDP nomination in January. As the seat was vacant, a by-election was expected to fill the seat and campaigning began in early 2004. However, Prime Minister Paul Martin delayed calling the by-election, in the expectation that a general election would soon be called.
In May 2004, a federal election was called, pre-empting the by-election. Broadbent was increasingly favoured to win, a mid-campaign poll showed him ahead. In addition to Broadbent's personal popularity, the NDP under new leader Jack Layton had greatly increased its popularity, especially in urban Ontario. The campaign was still hard-fought. In the end, Broadbent won a strong victory, and subsequently announced his retirement the following year, in April 2005.
| Canadian federal election, 2004 | ||||||||
|---|---|---|---|---|---|---|---|---|
| Party | Candidate | Votes | % | Expenditures | ||||
| New Democratic | Ed Broadbent | 25,734 | 41.05 | $75,600.35 | ||||
| Liberal | Richard Mahoney | 19,478 | 31.07 | $77,325.72 | ||||
| Conservative | Mike Murphy | 11,933 | 19.03 | $37,895.42 | ||||
| Green | David Chernushenko | 4,730 | 7.54 | $24,313.40 | ||||
| Marijuana | Michael Foster | 455 | 0.72 | – | ||||
| Independent | Robert Gauthier | 121 | 0.19 | – | ||||
| Communist | Stuart Ryan | 90 | 0.14 | $379.63 | ||||
| Canadian Action | Carla Marie Dancey | 76 | 0.12 | – | ||||
| Marxist–Leninist | Louis Lang | 67 | 0.10 | – | ||||
| Total valid votes | 62,684 | 100.00 | ||||||
| Total rejected ballots | 270 | |||||||
| Turnout | 62,954 | 70.35 | ||||||
2004 nomination contests
| New Democratic Party | ||
| Candidate | Residence | January 20, 2004 |
|---|---|---|
| Ed Broadbent | Ottawa | X |
| Paul Dewar | Ottawa | |
| Conservative Party of Canada | ||
| Candidate | Residence | March 29, 2004 |
|---|---|---|
| Mark P. Donnelly | Ottawa | |
| Michael J. Murphy | Ottawa | X |
Previous elections
| Canadian federal election, 2000 | ||||||||
|---|---|---|---|---|---|---|---|---|
| Party | Candidate | Votes | % | ±% | ||||
| Liberal | Mac Harb | 22,710 | 40.00 | -5.19 | ||||
| New Democratic | Heather-Jane Robertson | 13,516 | 23.81 | +0.08 | ||||
| Alliance | David Brown | 10,167 | 17.91 | +6.34 | ||||
| Progressive Conservative | Beverly Mitchell | 7,505 | 13.22 | -3.11 | ||||
| Green | Chris Bradshaw | 1,531 | 2.70 | +1.21 | ||||
| Marijuana | Brad Powers | 813 | 1.43 | |||||
| Canadian Action | Carla Marie Dancey | 210 | 0.37 | -0.04 | ||||
| Communist | Marvin Glass | 139 | 0.24 | |||||
| Natural Law | Neil Paterson | 111 | 0.20 | |||||
| Marxist–Leninist | Mistahi Corkill | 66 | 0.12 | -0.14 | ||||
| Total valid votes | 56,768 | 100.00 | ||||||
Note: Canadian Alliance vote is compared to the Reform vote in 1997 election.
| Canadian federal election, 1997 | ||||||||
|---|---|---|---|---|---|---|---|---|
| Party | Candidate | Votes | % | ±% | ||||
| Liberal | Mac Harb | 25,987 | 45.19 | -6.71 | ||||
| New Democratic | Jamey Heath | 13,646 | 23.73 | +1.07 | ||||
| Progressive Conservative | Peter Annis | 9,391 | 16.33 | +4.45 | ||||
| Reform | John Perocchio | 6,651 | 11.57 | +2.03 | ||||
| Green | Frank de Jong | 855 | 1.49 | +0.30 | ||||
| Canadian Action | Howard Bertram | 236 | 0.41 | |||||
| Natural Law | Neil Paterson | 211 | 0.37 | -0.34 | ||||
| Independent | Susan Cumby | 190 | 0.33 | |||||
| Marxist–Leninist | Hardial Bains | 150 | 0.26 | +0.07 | ||||
| Independent | Malek Khouri | 92 | 0.16 | |||||
| Independent | Ray Joseph Cormier | 91 | 0.16 | |||||
| Total valid votes | 57,500 | 100.00 | ||||||
| Canadian federal election, 1993 | ||||||||
|---|---|---|---|---|---|---|---|---|
| Party | Candidate | Votes | % | ±% | ||||
| Liberal | Mac Harb | 23,816 | 51.90 | +15.44 | ||||
| New Democratic | Marion Dewar | 10,398 | 22.66 | -12.26 | ||||
| Progressive Conservative | Ian R. Lee | 5,453 | 11.88 | -14.60 | ||||
| Reform | Len Tucker | 4,380 | 9.54 | |||||
| National | John Foster | 740 | 1.61 | |||||
| Green | Frank Thompson | 546 | 1.19 | +0.59 | ||||
| Natural Law | Neil Paterson | 328 | 0.71 | |||||
| Marxist–Leninist | Hardial Bains | 86 | 0.19 | +0.06 | ||||
| Independent | Clayoquot Keith Ashdown | 71 | 0.15 | |||||
| Abolitionist | Pauline G. Morrissette | 36 | 0.08 | |||||
| Commonwealth of Canada | Marie-Thérèse Costisella | 34 | 0.07 | +0.01 | ||||
| Independent | Vic Wilczur | 0 | 0 | |||||
| Total valid votes | 45,888 | 100.00 | ||||||
| Canadian federal election, 1988 | ||||||||
|---|---|---|---|---|---|---|---|---|
| Party | Candidate | Votes | % | ±% | ||||
| Liberal | Mac Harb | 18,096 | 36.46 | +6.84 | ||||
| New Democratic | Mike Cassidy | 17,334 | 34.92 | +0.55 | ||||
| Progressive Conservative | Bob Plamondon | 13,142 | 26.48 | −7.78 | ||||
| Green | John W. Dodson | 300 | 0.60 | +0.05 | ||||
| Rhinoceros | Leapin Liz Johnson | 292 | 0.59 | −0.15 | ||||
| Independent | John Turmel | 152 | 0.31 | |||||
| Independent | Michael K.B. Hahn | 115 | 0.23 | |||||
| Libertarian | Rudolph Shally | 111 | 0.22 | |||||
| Independent | Hardial Bains | 66 | 0.13 | |||||
| Commonwealth of Canada | Istvan Kovach | 30 | 0.06 | |||||
| Total valid votes | 49,638 | 100.00 | ||||||
Source(s)
"History of Federal Ridings — General Elections — OTTAWA CENTRE, Ontario (1966- )". Parliament of Canada. Retrieved May 28, 2014.
| ||||||||
| Canadian federal election, 1984 | ||||||||
|---|---|---|---|---|---|---|---|---|
| Party | Candidate | Votes | % | ±% | ||||
| New Democratic | Mike Cassidy | 17,844 | 34.37 | +18.41 | ||||
| Progressive Conservative | Dan Chilcott | 17,790 | 34.26 | −2.15 | ||||
| Liberal | John Evans | 15,380 | 29.62 | −16.28 | ||||
| Rhinoceros | Barry J. Heidt | 382 | 0.74 | −0.02 | ||||
| Green | Gordon Scott McLeod | 285 | 0.55 | |||||
| Communist | Marvin Glass | 93 | 0.18 | −0.07 | ||||
| Independent | Ray Joseph Cormier | 71 | 0.14 | |||||
| Independent | Rodger L. James | 45 | 0.09 | |||||
| Independent | Marc Gauvin | 29 | 0.06 | |||||
| Total valid votes | 51,919 | 100.00 | ||||||
Source(s)
"History of Federal Ridings — General Elections — OTTAWA CENTRE, Ontario (1966- )". Parliament of Canada. Retrieved May 28, 2014.
| ||||||||
| Canadian federal election, 1980 | ||||||||
|---|---|---|---|---|---|---|---|---|
| Party | Candidate | Votes | % | ±% | ||||
| Liberal | John Evans | 21,659 | 45.90 | +5.87 | ||||
| Progressive Conservative | Jean Pigott | 17,181 | 36.41 | -1.53 | ||||
| New Democratic | John Smart | 7,529 | 15.96 | -4.73 | ||||
| Rhinoceros | David Langille | 358 | 0.76 | |||||
| National | Robin Mathews | 170 | 0.36 | -0.25 | ||||
| Communist | Marvin Glass | 116 | 0.25 | -0.09 | ||||
| Independent | John Turmel | 62 | 0.13 | |||||
| Marxist–Leninist | Robin Collins | 44 | 0.09 | |||||
| Independent | Iqbal Ben-Tahir | 36 | 0.08 | |||||
| Independent | Ernest Bouchard | 32 | 0.07 | |||||
| Total valid votes | 47,187 | 100.00 | ||||||
| Canadian federal election, 1979 | ||||||||
|---|---|---|---|---|---|---|---|---|
| Party | Candidate | Votes | % | ±% | ||||
| Liberal | John Evans | 19,758 | 40.03 | +12.53 | ||||
| Progressive Conservative | Robert de Cotret | 18,728 | 37.94 | -6.52 | ||||
| New Democratic | John Smart | 10,213 | 20.69 | -6.81 | ||||
| Independent | Robin Mathews | 302 | 0.61 | |||||
| Independent | Michael John Charette | 191 | 0.39 | |||||
| Communist | Marvin Glass | 166 | 0.34 | |||||
| Total valid votes | 27,163 | 100.00 | ||||||
| By-election on October 16, 1978 | ||||||
| Party | Candidate | Votes | % | ±% | ||
|---|---|---|---|---|---|---|
| Progressive Conservative | Robert de Cotret | 12,078 | 44.46 | +10.10 | ||
| New Democratic | Steven W. Langdon | 7,470 | 27.50 | +8.42 | ||
| Liberal | Bryce Mackasey | 7,361 | 27.10 | -16.23 | ||
| Independent | Michael John Houlton | 254 | 0.94 | |||
| Total valid votes | 27,163 | 100.00 | ||||
| Canadian federal election, 1974 | ||||||||
|---|---|---|---|---|---|---|---|---|
| Party | Candidate | Votes | % | ±% | ||||
| Liberal | Hugh Poulin | 15,308 | 43.33 | +4.81 | ||||
| Progressive Conservative | Hugh Segal | 12,138 | 34.36 | -0.87 | ||||
| New Democratic | Irving Greenberg | 6,739 | 19.08 | -6.04 | ||||
| Independent | Bela Egyed | 877 | 2.48 | |||||
| Social Credit | John Graham | 139 | 0.39 | -0.26 | ||||
| Independent | Ray Quann | 63 | 0.18 | |||||
| Marxist–Leninist | Phil Sarazen | 62 | 0.18 | |||||
| Total valid votes | 35,326 | 100.00 | ||||||
| Canadian federal election, 1972 | ||||||||
|---|---|---|---|---|---|---|---|---|
| Party | Candidate | Votes | % | ±% | ||||
| Liberal | Hugh Poulin | 14,101 | 38.52 | -19.22 | ||||
| Progressive Conservative | Hugh Segal | 12,899 | 35.23 | +1.01 | ||||
| New Democratic | Irving Greenberg | 9,195 | 25.12 | +17.07 | ||||
| Social Credit | Rocco Zavarella | 237 | 0.65 | |||||
| Independent | Paul Herman | 177 | 0.48 | |||||
| Total valid votes | 36,609 | 100.00 | ||||||
| Canadian federal election, 1968 | ||||||||
|---|---|---|---|---|---|---|---|---|
| Party | Candidate | Votes | % | |||||
| Liberal | George McIlraith | 19,578 | 57.74 | |||||
| Progressive Conservative | Murray A. Heit | 11,602 | 34.22 | |||||
| New Democratic | June B. Ralph | 2,729 | 8.05 | |||||
| Total valid votes | 33,909 | 100.00 | ||||||
See also
References
- "(Code 35062) Census Profile". 2011 census. Statistics Canada. 2012. Retrieved 2011-03-03.
Notes
- ↑ Statistics Canada: 2011
- ↑ Statistics Canada: 2011
- ↑ http://www12.statcan.gc.ca/nhs-enm/2011/dp-pd/prof/details/page.cfm?Lang=E&Geo1=FED2013&Code1=35075&Data=Count&SearchText=ottawa%20centre&SearchType=Begins&SearchPR=01&A1=All&B1=All&Custom=&TABID=1
- ↑ http://www12.statcan.gc.ca/nhs-enm/2011/dp-pd/prof/details/page.cfm?Lang=E&Geo1=FED2013&Code1=35075&Data=Count&SearchText=ottawa%20centre&SearchType=Begins&SearchPR=01&A1=All&B1=All&Custom=&TABID=1#tabs2
- ↑ "2006 Census of Canada: Topic-based tabulations | Highest Certificate, Diploma or Degree (14), Location of Study (5), Major Field of Study - Classification of Instructional Programs, 2000 (14), Age Groups (10A) and Sex (3) for the Population 15 Years and Over of Canada, Provinces, Territories and Federal Electoral Districts (2003 Representation Order), 2006 Census - 20% Sample Data". 2.statcan.gc.ca. Retrieved 2012-11-16.
- ↑ http://www.cbc.ca/news/canada/ottawa/ottawa-high-voter-turnout-1.3280527. Missing or empty
|title=(help) - ↑ Population calculated by combining Census Blocks 3506183106, 3506183109, 3506183506, 3506053506, 3506053303, 3506053308, 3506053106, 3506053105, 3506053107
- ↑ Elections Canada – Confirmed candidates for Ottawa Centre, 30 September 2015
- ↑ Elections Canada – Preliminary Election Expenses Limits for Candidates
- ↑
- ↑ Pundits' Guide to Canadian Elections
- ↑ http://www.ctv.ca/servlet/ArticleNews/story/CTVNews/1063157926495_41/?hub=Canada