Halton (electoral district)
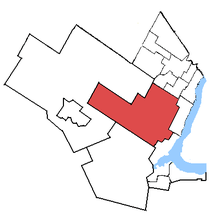 Halton, 2003-2015, in relation to other Ontario electoral districts | |
| Defunct federal electoral district | |
| Legislature | House of Commons |
| District created | 1996 |
| District abolished | 2013 |
| First contested | 1997 |
| Last contested | 2011 |
| District webpage | profile, map |
| Demographics | |
| Population (2011)[1] | 203,437 |
| Electors (2011) | 115,255 |
| Area (km²)[2] | 537.47 |
| Census divisions | Halton |
| Census subdivisions | Burlington, Milton, Oakville |
Halton was a federal electoral district in Ontario, Canada, represented in the House of Commons of Canada from 1867 to 1988 before being abolished in an electoral district redistribution, and again from 1997 to 2015, when it was again abolished in another electoral district redistribution. When it was last contested in 2011, its population was 203,437, of whom 115,255 were eligible electors.
Electoral district
1867-1966
Halton riding was created by British North America Act in 1867, and defined as Halton County.
1966-1976
In 1966, the riding was redefined to consist of the Towns of Milton and Oakville and the Township of Esquesing in the County of Halton, and the Township of Erin in the County of Wellington.
1976-1987
In 1976, it was redefined to consist of the Towns of Milton and Oakville, and the southern part of the Town of Halton Hills.
The electoral district was abolished in 1987 when it was redistributed between Halton—Peel and Oakville—Milton ridings.
1996-2015
In 1996, the riding was re-created to include the Town of Milton and the northern parts of the Town of Oakville and the City of Burlington, defined as:
- the Town of Milton,
- the part of the Town of Oakville lying northwest of a line drawn from northeast to southwest along Dundas Street West, southeaster along Eighth Line, and southwest along Upper Middle Road, and
- the part of the City of Burlington lying northwest of a line drawn from northeast to southwest along the Queen Elizabeth Way, northwest along Walkers Line, southwest along Upper Middle Road, northwest along Guelph Line, and southwest along Dundas Street.
In 2015, the riding of Halton was abolished and redistributed between Milton, Oakville North—Burlington, Burlington, Mississauga—Streetsville and Mississauga—Erin Mills.
Members of Parliament
This riding elected the following Members of Parliament:
Election results
1997 - 2015
| Canadian federal election, 2011 | ||||||||
|---|---|---|---|---|---|---|---|---|
| Party | Candidate | Votes | % | ±% | Expenditures | |||
| Conservative | Lisa Raitt | 44,206 | 54.4 | +6.9 | ||||
| Liberal | Connie Laurin-Bowie | 20,903 | 25.8 | -10.4 | ||||
| New Democratic | Patricia Heroux | 12,960 | 16.0 | +7.2 | ||||
| Green | Judi Remigio | 2,778 | 3.4 | -3.6 | ||||
| Christian Heritage | Tony Rodrigues | 249 | 0.3 | -0.2 | ||||
| Total valid votes | 81,096 | 100.0 | ||||||
| Total rejected ballots | 290 | 0.4 | +0.1 | |||||
| Turnout | 81,394 | 62.4 | +1.9 | |||||
| Eligible voters | 130,026 | – | – | |||||
| Canadian federal election, 2008 | ||||||||
|---|---|---|---|---|---|---|---|---|
| Party | Candidate | Votes | % | ±% | Expenditures | |||
| Conservative | Lisa Raitt | 32,986 | 47.5 | +3.5 | $106,182 | |||
| Liberal | Garth Turner | 25,136 | 36.2 | -5.2 | $51,972 | |||
| New Democratic | Robert Wagner | 6,118 | 8.8 | 0.0 | $3,421 | |||
| Green | Amy Collard | 4,872 | 7.0 | +1.4 | $4,509 | |||
| Christian Heritage | Tony Rodrigues | 337 | 0.5 | – | $2,108 | |||
| Total valid votes/Expense limit | 69,449 | 100.0 | $107,026 | |||||
| Total rejected ballots | 225 | 0.3 | ||||||
| Turnout | 69,674 | 60.5 | ||||||
| Canadian federal election, 2006 | ||||||||
|---|---|---|---|---|---|---|---|---|
| Party | Candidate | Votes | % | ±% | ||||
| Conservative | Garth Turner | 30,578 | 44.2 | +5.3 | ||||
| Liberal | Gary Carr | 28,498 | 41.4 | -6.9 | ||||
| New Democratic | Anwar Naqvi | 6,110 | 8.8 | +0.6 | ||||
| Green | Kyle Grice | 4,026 | 5.6 | +0.5 | ||||
| Total valid votes | 69,212 | 100.0 | ||||||
| Conservative gain from Liberal | Swing | -6.1 | ||||||
| Canadian federal election, 2004 | ||||||||
|---|---|---|---|---|---|---|---|---|
| Party | Candidate | Votes | % | ±% | ||||
| Liberal | Gary Carr | 27,362 | 48.3 | +1.1 | ||||
| Conservative | Dean Martin | 21,704 | 38.8 | -8.3 | ||||
| New Democratic | Anwar Naqvi | 4,642 | 8.2 | +3.8 | ||||
| Green | Frank Marchetti | 2,889 | 5.1 | +3.4 | ||||
| Total valid votes | 56,597 | 100.0 | ||||||
Note: Conservative vote is compared to the total of the Canadian Alliance vote and Progressive Conservative vote in 2000 election.
| Canadian federal election, 2000 | ||||||||
|---|---|---|---|---|---|---|---|---|
| Party | Candidate | Votes | % | ±% | ||||
| Liberal | Julian Reed | 28,168 | 47.3 | 0.0 | ||||
| Alliance | Tim Dobson | 15,656 | 26.3 | +4.1 | ||||
| Progressive Conservative | Tom Kilmer | 12,114 | 20.3 | -4.7 | ||||
| New Democratic | Brenda Dolling | 2,633 | 4.4 | 0.0 | ||||
| Green | Tom Adams | 1,018 | 1.7 | +0.6 | ||||
| Total valid votes | 59,589 | 100.0 | ||||||
Note: Canadian Alliance vote is compared to the Reform vote in 1997 election.
| Canadian federal election, 1997 | ||||||||
|---|---|---|---|---|---|---|---|---|
| Party | Candidate | Votes | % | |||||
| Liberal | Julian Reed | 26,017 | 47.2 | |||||
| Progressive Conservative | Ralph Scholtens | 13,778 | 25.0 | |||||
| Reform | Richard Malboeuf | 12,221 | 22.2 | |||||
| New Democratic | Jay Jackson | 2,452 | 4.5 | |||||
| Green | Bill Champ | 600 | 1.1 | |||||
| Total valid votes | 55,068 | 100.0 | ||||||
1867-1988
| Canadian federal election, 1984 | ||||||||
|---|---|---|---|---|---|---|---|---|
| Party | Candidate | Votes | % | ±% | ||||
| Progressive Conservative | Otto Jelinek | 38,076 | 60.6 | +13.8 | ||||
| Liberal | Oriena R.M. Currie | 14,125 | 22.5 | -14.2 | ||||
| New Democratic | Kevin Flynn | 9,164 | 14.6 | -1.4 | ||||
| Green | Chris Kowalchuk | 1,494 | 2.4 | |||||
| Total valid votes | 62,859 | 100.0 | ||||||
| Canadian federal election, 1980 | ||||||||
|---|---|---|---|---|---|---|---|---|
| Party | Candidate | Votes | % | ±% | ||||
| Progressive Conservative | Otto Jelinek | 24,752 | 46.8 | -6.5 | ||||
| Liberal | Bill Perras | 19,380 | 36.6 | +4.9 | ||||
| New Democratic | Doug Black | 8,455 | 16.0 | +1.5 | ||||
| Libertarian | Karen Selick | 170 | 0.3 | +0.1 | ||||
| Independent | Robert J. Ritchie | 142 | 0.3 | 0.0 | ||||
| Marxist–Leninist | Charles Shrybman | 18 | 0.0 | 0.0 | ||||
| Total valid votes | 52,917 | 100.0 | ||||||
| Canadian federal election, 1979 | ||||||||
|---|---|---|---|---|---|---|---|---|
| Party | Candidate | Votes | % | ±% | ||||
| Progressive Conservative | Otto Jelinek | 28,850 | 53.3 | +11.7 | ||||
| Liberal | Frank A. Philbrook | 17,169 | 31.7 | -13.5 | ||||
| New Democratic | Doug Black | 7,838 | 14.5 | +1.2 | ||||
| Libertarian | Karen Selick | 144 | 0.3 | |||||
| Independent | Robert J. Ritchie | 130 | 0.2 | |||||
| Marxist–Leninist | Charles Shrybman | 23 | 0.0 | |||||
| Total valid votes | 54,154 | 100.0 | ||||||
| Canadian federal election, 1974 | ||||||||
|---|---|---|---|---|---|---|---|---|
| Party | Candidate | Votes | % | ±% | ||||
| Liberal | Frank Philbrook | 23,520 | 45.2 | +5.8 | ||||
| Progressive Conservative | Terry O'Connor | 21,609 | 41.5 | -2.2 | ||||
| New Democratic | Archibald Brown | 6,887 | 13.2 | -3.6 | ||||
| Total valid votes | 52,016 | 100.0 | ||||||
| Canadian federal election, 1972 | ||||||||
|---|---|---|---|---|---|---|---|---|
| Party | Candidate | Votes | % | ±% | ||||
| Progressive Conservative | Terry O'Connor | 22,640 | 43.7 | +9.7 | ||||
| Liberal | Rud L. Whiting | 20,419 | 39.4 | -8.7 | ||||
| New Democratic | Carolyn Holstein | 8,725 | 16.8 | -1.0 | ||||
| Total valid votes | 51,784 | 100.0 | ||||||
| Canadian federal election, 1968 | ||||||||
|---|---|---|---|---|---|---|---|---|
| Party | Candidate | Votes | % | ±% | ||||
| Liberal | Rud L. Whiting | 17,837 | 48.1 | +0.3 | ||||
| Progressive Conservative | Peter McWilliams | 12,614 | 34.0 | +2.9 | ||||
| New Democratic | Murray Kernighan | 6,606 | 17.8 | -2.6 | ||||
| Total valid votes | 37,057 | 100.0 | ||||||
| Canadian federal election, 1965 | ||||||||
|---|---|---|---|---|---|---|---|---|
| Party | Candidate | Votes | % | ±% | ||||
| Liberal | Harry C. Harley | 25,213 | 47.8 | -4.2 | ||||
| Progressive Conservative | Allan M. Masson | 16,412 | 31.1 | -1.4 | ||||
| New Democratic | Murray S. Kernighan | 10,751 | 20.4 | +6.5 | ||||
| Independent Conservative | Henry Timmins | 373 | 0.7 | -0.3 | ||||
| Total valid votes | 52,749 | 100.0 | ||||||
| Canadian federal election, 1963 | ||||||||
|---|---|---|---|---|---|---|---|---|
| Party | Candidate | Votes | % | ±% | ||||
| Liberal | Harry C. Harley | 25,482 | 52.0 | +11.2 | ||||
| Progressive Conservative | Sandy Best | 15,949 | 32.5 | -8.0 | ||||
| New Democratic | Ellis Fullerton | 6,790 | 13.8 | -3.7 | ||||
| Independent Conservative | Henry Timmins | 481 | 1.0 | |||||
| Social Credit | Irv Wilson | 330 | 0.7 | -0.5 | ||||
| Total valid votes | 49,032 | 100.0 | ||||||
| Canadian federal election, 1962 | ||||||||
|---|---|---|---|---|---|---|---|---|
| Party | Candidate | Votes | % | ±% | ||||
| Liberal | Harry C. Harley | 18,556 | 40.7 | +11.8 | ||||
| Progressive Conservative | Sandy Best | 18,458 | 40.5 | -20.5 | ||||
| New Democratic | Carl Rouleau | 8,001 | 17.6 | +7.5 | ||||
| Social Credit | Irving R. Wilson | 547 | 1.2 | |||||
| Total valid votes | 45,562 | 100.0 | ||||||
Note: NDP vote is compared to CCF vote in 1958 election.
| Canadian federal election, 1958 | ||||||||
|---|---|---|---|---|---|---|---|---|
| Party | Candidate | Votes | % | ±% | ||||
| Progressive Conservative | Charles Alexander Best | 21,056 | 61.0 | +2.2 | ||||
| Liberal | Ken Dick | 9,978 | 28.9 | -1.3 | ||||
| Co-operative Commonwealth | Jack Henry | 3,481 | 10.1 | -1.0 | ||||
| Total valid votes | 34,515 | 100.0 | ||||||
| Canadian federal election, 1957 | ||||||||
|---|---|---|---|---|---|---|---|---|
| Party | Candidate | Votes | % | ±% | ||||
| Progressive Conservative | Charles Alexander Best | 17,795 | 58.8 | +10.3 | ||||
| Liberal | Kenneth Y. Dick | 9,145 | 30.2 | -12.5 | ||||
| Co-operative Commonwealth | Jack Henry | 3,344 | 11.0 | +2.2 | ||||
| Total valid votes | 30,284 | 100.0 | ||||||
| Canadian federal election, 1953 | ||||||||
|---|---|---|---|---|---|---|---|---|
| Party | Candidate | Votes | % | ±% | ||||
| Progressive Conservative | Sybil Bennett | 9,914 | 48.4 | +6.9 | ||||
| Liberal | Murray Hunter McPhail | 8,732 | 42.7 | -6.4 | ||||
| Co-operative Commonwealth | Stan Allen | 1,819 | 8.9 | -0.5 | ||||
| Total valid votes | 20,465 | 100.0 | ||||||
| Canadian federal election, 1949 | ||||||||
|---|---|---|---|---|---|---|---|---|
| Party | Candidate | Votes | % | ±% | ||||
| Liberal | Hughes Cleaver | 9,546 | 49.0 | +2.8 | ||||
| Progressive Conservative | M. Sybil Bennett | 8,099 | 41.6 | -1.0 | ||||
| Co-operative Commonwealth | William Albert Shane | 1,829 | 9.4 | -1.8 | ||||
| Total valid votes | 19,474 | 100.0 | ||||||
| Canadian federal election, 1945 | ||||||||
|---|---|---|---|---|---|---|---|---|
| Party | Candidate | Votes | % | ±% | ||||
| Liberal | Hughes Cleaver | 7,344 | 46.3 | -9.5 | ||||
| Progressive Conservative | Allan Stanley Nicholson | 6,763 | 42.6 | -1.7 | ||||
| Co-operative Commonwealth | Carlyle C. Browne | 1,770 | 11.1 | |||||
| Total valid votes | 15,877 | 100.0 | ||||||
Note: Progressive Conservative vote is compared to "National Government" vote in 1940 election.
| Canadian federal election, 1940 | ||||||||
|---|---|---|---|---|---|---|---|---|
| Party | Candidate | Votes | % | ±% | ||||
| Liberal | Hughes Cleaver | 7,788 | 55.7 | +8.9 | ||||
| National Government | George C. Atkins | 6,184 | 44.3 | +5.3 | ||||
| Total valid votes | 13,972 | 100.0 | ||||||
Note: "National Government" vote is compared to Conservative vote in 1935 election.
| Canadian federal election, 1935 | ||||||||
|---|---|---|---|---|---|---|---|---|
| Party | Candidate | Votes | % | ±% | ||||
| Liberal | Hughes Cleaver | 6,177 | 46.8 | |||||
| Conservative | George Currie | 5,146 | 39.0 | -15.6 | ||||
| Reconstruction | Melville Marks Robinson | 1,876 | 14.2 | |||||
| Total valid votes | 13,199 | 100.0 | ||||||
| Canadian federal election, 1930 | ||||||||
|---|---|---|---|---|---|---|---|---|
| Party | Candidate | Votes | % | ±% | ||||
| Conservative | Robert King Anderson | 6,976 | 54.6 | -4.5 | ||||
| Progressive | James Waldbrook | 5,806 | 45.4 | |||||
| Total valid votes | 12,782 | 100.0 | ||||||
| Canadian federal election, 1926 | ||||||||
|---|---|---|---|---|---|---|---|---|
| Party | Candidate | Votes | % | ±% | ||||
| Conservative | Robert King Anderson | 6,222 | 59.1 | +3.6 | ||||
| Liberal | William James Laird Hampshire | 4,308 | 40.9 | -3.6 | ||||
| Total valid votes | 10,530 | 100.0 | ||||||
| Canadian federal election, 1925 | ||||||||
|---|---|---|---|---|---|---|---|---|
| Party | Candidate | Votes | % | ±% | ||||
| Conservative | Robert King Anderson | 6,775 | 55.5 | +12.2 | ||||
| Liberal | Duncan Campbell | 5,424 | 44.5 | +14.4 | ||||
| Total valid votes | 12,199 | 100.0 | ||||||
| Canadian federal election, 1921 | ||||||||
|---|---|---|---|---|---|---|---|---|
| Party | Candidate | Votes | % | ±% | ||||
| Conservative | Robert King Anderson | 5,264 | 43.3 | -26.9 | ||||
| Liberal | William Franklin Fisher | 3,649 | 30.0 | +0.3 | ||||
| Progressive | John Featherstone Ford | 3,238 | 26.6 | |||||
| Total valid votes | 12,151 | 100.0 | ||||||
Note: Conservative vote is compared to Government vote in 1917 election, and Liberal vote is compared to Opposition vote.
| Canadian federal election, 1917 | ||||||||
|---|---|---|---|---|---|---|---|---|
| Party | Candidate | Votes | % | ±% | ||||
| Government (Unionist) | Robert King Anderson | 4,802 | 70.3 | +15.9 | ||||
| Opposition (Laurier Liberals) | Walter Dymond Gregory | 2,032 | 29.7 | -15.9 | ||||
| Total valid votes | 6,834 | 100.0 | ||||||
Note: Government vote is compared to Conservative vote in 1911 election, and Opposition vote is compared to Liberal vote.
| Canadian federal election, 1911 | ||||||||
|---|---|---|---|---|---|---|---|---|
| Party | Candidate | Votes | % | ±% | ||||
| Conservative | David Henderson | 2,618 | 54.3 | +2.1 | ||||
| Liberal | Walter Harland Smith | 2,199 | 45.7 | -2.1 | ||||
| Total valid votes | 4,817 | 100.0 | ||||||
| Canadian federal election, 1908 | ||||||||
|---|---|---|---|---|---|---|---|---|
| Party | Candidate | Votes | % | ±% | ||||
| Conservative | David Henderson | 2,417 | 52.3 | +0.7 | ||||
| Liberal | William Spencer Harrison | 2,205 | 47.7 | |||||
| Total valid votes | 4,622 | 100.0 | ||||||
| Canadian federal election, 1904 | ||||||||
|---|---|---|---|---|---|---|---|---|
| Party | Candidate | Votes | % | ±% | ||||
| Conservative | David Henderson | 2,288 | 51.6 | 0.0 | ||||
| Unknown | John S. Deacon | 2,148 | 48.4 | |||||
| Total valid votes | 4,436 | 100.0 | ||||||
| Canadian federal election, 1900 | ||||||||
|---|---|---|---|---|---|---|---|---|
| Party | Candidate | Votes | % | ±% | ||||
| Conservative | David Henderson | 2,379 | 51.6 | +0.7 | ||||
| Liberal | S.F. McKinnon | 2,233 | 48.4 | -0.7 | ||||
| Total valid votes | 4,612 | 100.0 | ||||||
| Canadian federal election, 1896 | ||||||||
|---|---|---|---|---|---|---|---|---|
| Party | Candidate | Votes | % | ±% | ||||
| Conservative | David Henderson | 2,460 | 50.9 | -0.2 | ||||
| Liberal | John Waldie | 2,376 | 49.1 | +0.2 | ||||
| Total valid votes | 4,836 | 100.0 | ||||||
Note: indicates change in popular vote from to 1891 general election.
| By-election on 28 January 1892
On the election having been declared 16 November 1891 | |||||
| Party | Candidate | Votes | |||
|---|---|---|---|---|---|
| Conservative | David Henderson | acclaimed | |||
| Canadian federal election, 1891 | ||||||||
|---|---|---|---|---|---|---|---|---|
| Party | Candidate | Votes | % | ±% | ||||
| Conservative | David Henderson | 2,441 | 51.1 | +1.4 | ||||
| Liberal | John Waldie | 2,337 | 48.9 | -1.4 | ||||
| Total valid votes | 4,778 | 100.0 | ||||||
| Canadian federal by-election, 22 August 1888 | ||||||||
|---|---|---|---|---|---|---|---|---|
| Party | Candidate | Votes | % | ±% | ||||
| On Mr. Henderson being unseated for corrupt practices by agents | ||||||||
| Liberal | John Waldie | 2,042 | 50.3 | |||||
| Conservative | David Henderson | 2,018 | 49.7 | -1.4 | ||||
| Total valid votes | 4,060 | 100.0 | ||||||
| Canadian federal by-election, 7 February 1888 | ||||||||
|---|---|---|---|---|---|---|---|---|
| Party | Candidate | Votes | % | ±% | ||||
| On Mr. Waldie being unseated, 19 January 1888, for bribery by agents | ||||||||
| Conservative | David Henderson | 2,183 | 51.1 | +1.2 | ||||
| Unknown | McLeod | 2,086 | 48.9 | |||||
| Total valid votes | 4,269 | 100.0 | ||||||
| Canadian federal election, 1887 | ||||||||
|---|---|---|---|---|---|---|---|---|
| Party | Candidate | Votes | % | ±% | ||||
| Liberal | John Waldie | 2,222 | 50.1 | -1.1 | ||||
| Conservative | David Henderson | 2,213 | 49.9 | |||||
| Total valid votes | 4,435 | 100.0 | ||||||
| Canadian federal election, 1882 | ||||||||
|---|---|---|---|---|---|---|---|---|
| Party | Candidate | Votes | % | ±% | ||||
| Liberal | William McCraney | 1,822 | 51.2 | |||||
| Unknown | Geo. C. McKindsey | 1,739 | 48.8 | |||||
| Total valid votes | 3,561 | 100.0 | ||||||
| Canadian federal election, 1878 | ||||||||
|---|---|---|---|---|---|---|---|---|
| Party | Candidate | Votes | % | ±% | ||||
| Liberal–Conservative | William McDougall | 1,708 | 50.3 | +2.3 | ||||
| Liberal | William McCraney | 1,690 | 49.7 | -2.3 | ||||
| Total valid votes | 3,398 | 100.0 | ||||||
On Mr. Chisholm being unseated, on petition, 8 December 1874:
| By-election on 25 January 1875 | ||||||
| Party | Candidate | Votes | % | ±% | ||
|---|---|---|---|---|---|---|
| Liberal | William McCraney | 1,704 | 52.1 | +2.5 | ||
| Liberal–Conservative | Daniel Black Chisholm | 1,569 | 47.9 | -2.5 | ||
| Total valid votes | 3,273 | 100.0 | ||||
| Canadian federal election, 1874 | ||||||||
|---|---|---|---|---|---|---|---|---|
| Party | Candidate | Votes | % | ±% | ||||
| Liberal–Conservative | Daniel Black Chisholm | 1,464 | 50.4 | |||||
| Liberal | J. White | 1,441 | 49.6 | -2.9 | ||||
| Total valid votes | 2,905 | 100.0 | ||||||
| Canadian federal election, 1872 | ||||||||
|---|---|---|---|---|---|---|---|---|
| Party | Candidate | Votes | % | ±% | ||||
| Liberal | John White | 1,414 | 52.5 | +0.1 | ||||
| Unknown | G.C. McKindsey | 1,278 | 47.5 | |||||
| Total valid votes | 2,692 | 100.0 | ||||||
| Canadian federal election, 1867 | ||||||||
|---|---|---|---|---|---|---|---|---|
| Party | Candidate | Votes | % | |||||
| Liberal | John White | 1,422 | 52.5 | |||||
| Unknown | Mr. Chisholm | 1,289 | 47.5 | |||||
| Total valid votes | 2,711 | 100.0 | ||||||
See also
References
- "(Code 35030) Census Profile". 2011 census. Statistics Canada. 2012. Retrieved 2011-03-03.
- Federal riding history 1867 - 1987 from the Library of Parliament
- Federal riding history 1997 - 2008 from the Library of Parliament
- 2011 Results from Elections Canada
- Campaign expense data from Elections Canada
Notes
- ↑ Statistics Canada: 2012
- ↑ Statistics Canada: 2012