Bruce—Grey—Owen Sound
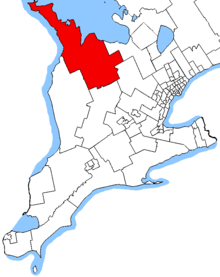 Bruce—Grey—Owen Sound in relation to other Ontario electoral districts | |||
| Federal electoral district | |||
| Legislature | House of Commons | ||
| MP |
Conservative | ||
| District created | 1933 | ||
| First contested | 1935 | ||
| Last contested | 2015 | ||
| District webpage | profile, map | ||
| Demographics | |||
| Population (2011)[1] | 106,475 | ||
| Electors (2015) | 81,389 | ||
| Area (km²)[2] | 6,447 | ||
| Pop. density (per km²) | 16.5 | ||
| Census divisions | Bruce County, Grey County | ||
| Census subdivisions |
Cities: Owen Sound Towns: Hanover Townships: Arran-Elderslie, Chatsworth, Georgian Bluffs, Grey Highlands, Meaford, Northern Bruce Peninsula, South Bruce Peninsula, Southgate, West Grey First Nations reserves: Neyaashiinigmiing, Saugeen 29 | ||
Bruce—Grey—Owen Sound (formerly known as Bruce, Bruce—Grey and Grey—Bruce—Owen Sound) is a federal electoral district that has been represented in the House of Commons of Canada since 1935.
The riding has always been a swing riding, that has become more conservative in the last 10 years. It has produced many close results over the years.
History
The district was created in 1933 from Bruce North and Bruce South and was known as "Bruce" riding. Its name was changed in 1975 to "Bruce—Grey", to "Bruce—Grey—Owen Sound" in 2000, to "Grey—Bruce—Owen Sound" in 2003, and to Bruce—Grey—Owen Sound in 2004.
This riding was left unchanged after the 2012 electoral redistribution.
Members of Parliament
This riding has elected the following Members of Parliament:
| Parliament | Years | Member | Party | |
|---|---|---|---|---|
| Bruce Riding created from Bruce North and Bruce South |
||||
| 18th | 1935–1940 | William Rae Tomlinson | Liberal | |
| 19th | 1940–1945 | |||
| 20th | 1945–1949 | Andrew Ernest Robinson | Progressive Conservative | |
| 21st | 1949–1953 | Donald Buchanan Blue | Liberal | |
| 22nd | 1953–1957 | Andrew Ernest Robinson | Progressive Conservative | |
| 23rd | 1957–1958 | |||
| 24th | 1958–1962 | |||
| 25th | 1962–1963 | |||
| 26th | 1963–1965 | John Loney | ||
| 27th | 1965–1968 | |||
| 28th | 1968–1972 | Ross Whicher | Liberal | |
| 29th | 1972–1974 | |||
| 30th | 1974–1979 | Crawford Douglas | ||
| Bruce—Grey | ||||
| 31st | 1979–1980 | Gary Gurbin | Progressive Conservative | |
| 32nd | 1980–1984 | |||
| 33rd | 1984–1988 | |||
| 34th | 1988–1993 | Gus Mitges | ||
| 35th | 1993–1997 | Ovid Jackson | Liberal | |
| 36th | 1997–2000 | |||
| 37th | 2000–2004 | |||
| Grey—Bruce—Owen Sound | ||||
| 38th | 2004–2006 | Larry Miller | Conservative | |
| Bruce—Grey—Owen Sound | ||||
| 39th | 2006–2008 | Larry Miller | Conservative | |
| 40th | 2008–2011 | |||
| 41st | 2011–2015 | |||
| 42nd | 2015–Present | |||
Election results
Bruce—Grey—Owen Sound
| Canadian federal election, 2015 | ||||||||
|---|---|---|---|---|---|---|---|---|
| Party | Candidate | Votes | % | ±% | Expenditures | |||
| Conservative | Larry Miller | 26,297 | 46.68 | -9.62 | $121,344.93 | |||
| Liberal | Kimberley Love | 21,879 | 38.84 | +22.77 | $77,135.87 | |||
| New Democratic | David McLaren | 6,270 | 11.13 | -6.51 | $28,809.26 | |||
| Green | Chris Albinati | 1,887 | 3.35 | -6.64 | $4,346.25 | |||
| Total valid votes/Expense limit | 56,333 | 100.00 | $218,310.52 | |||||
| Total rejected ballots | 212 | 0.37 | ||||||
| Turnout | 56,545 | 68.91 | ||||||
| Eligible voters | 82,056 | |||||||
| Conservative hold | Swing | -16.20 | ||||||
| Source: Elections Canada[3][4] | ||||||||
| Canadian federal election, 2011 | ||||||||
|---|---|---|---|---|---|---|---|---|
| Party | Candidate | Votes | % | ±% | Expenditures | |||
| Conservative | Larry Miller | 28,744 | 56.30 | +8.64 | – | |||
| New Democratic | Karen Gventer | 9,008 | 17.64 | +8.01 | – | |||
| Liberal | Kimberley Love | 8,203 | 16.07 | +1.77 | – | |||
| Green | Emma Jane Hogbin | 5,099 | 9.99 | -17.18 | – | |||
| Total valid votes | 51,054 | 100.00 | – | |||||
| Total rejected ballots | 227 | 0.44 | +0.02 | |||||
| Turnout | 51,281 | 65.04 | +3.68 | |||||
| Eligible voters | 78,848 | – | – | |||||
| Canadian federal election, 2008 | ||||||||
|---|---|---|---|---|---|---|---|---|
| Party | Candidate | Votes | % | ±% | Expenditures | |||
| Conservative | Larry Miller | 22,975 | 47.66 | -0.52 | $83,330 | |||
| Green | Dick Hibma | 13,095 | 27.17 | +14.26 | $63,875 | |||
| Liberal | Thomas Noble | 6,892 | 14.30 | -13.26 | $39,399 | |||
| New Democratic | Jill McIllwraith | 4,640 | 9.63 | -1.71 | $9,434 | |||
| Christian Heritage | Joel Kidd | 599 | 1.24 | * | $1,377 | |||
| Total valid votes/Expense limit | 48,201 | 100.00 | $84,478 | |||||
| Total rejected ballots | 204 | 0.42 | ||||||
| Turnout | 48,405 | 61.36 | – | |||||
| Canadian federal election, 2006 | ||||||||
|---|---|---|---|---|---|---|---|---|
| Party | Candidate | Votes | % | ±% | Expenditures | |||
| Conservative | Larry Miller | 25,133 | 48.18 | +3.2 | $72,117 | |||
| Liberal | Verona Jackson | 14,378 | 27.56 | -8.2 | $52,377 | |||
| Green | Shane Jolley | 6,735 | 12.91 | +8.7 | $17,349 | |||
| New Democratic | Jill McIllwraith | 5,918 | 11.34 | -1.7 | $11,210 | |||
| Total valid votes/Expense limit | 52,164 | 100.00 | ||||||
Grey—Bruce—Owen Sound
| Canadian federal election, 2004 | ||||||||
|---|---|---|---|---|---|---|---|---|
| Party | Candidate | Votes | % | ±% | ||||
| Conservative | Larry Miller | 22,411 | 45.0 | -6.0 | ||||
| Liberal | Ovid Jackson | 17,824 | 35.8 | -8.4 | ||||
| New Democratic | Sebastian Ostertag | 6,516 | 13.1 | +8.2 | ||||
| Green | Alex Drossos | 2,076 | 4.2 | |||||
| Christian Heritage | Steven J. Taylor | 982 | 2.0 | |||||
| Total valid votes | 49,809 | 100.0 | ||||||
Note: Conservative vote is compared to the total of the Canadian Alliance vote and Progressive Conservative vote in 2000 election.
Bruce—Grey
| Canadian federal election, 2000 | ||||||||
|---|---|---|---|---|---|---|---|---|
| Party | Candidate | Votes | % | ±% | ||||
| Liberal | Ovid Jackson | 19,822 | 44.2 | +7.4 | ||||
| Alliance | Murray Peer | 15,960 | 35.6 | +2.4 | ||||
| Progressive Conservative | Allen Wilford | 6,872 | 15.3 | -7.6 | ||||
| New Democratic | Karen Gventer | 2,166 | 4.8 | -2.3 | ||||
| Total valid votes | 44,820 | 100.0 | ||||||
Note: Canadian Alliance vote is compared to the Reform vote in 1997 election.
| Canadian federal election, 1997 | ||||||||
|---|---|---|---|---|---|---|---|---|
| Party | Candidate | Votes | % | ±% | ||||
| Liberal | Ovid Jackson | 17,896 | 36.8 | -12.3 | ||||
| Reform | Murray Peer | 16,161 | 33.2 | +8.5 | ||||
| Progressive Conservative | John Middlebro | 11,139 | 22.9 | +4.1 | ||||
| New Democratic | Colleen Anne Purdon | 3,446 | 7.1 | +2.8 | ||||
| Total valid votes | 48,642 | 100.0 | ||||||
| Canadian federal election, 1993 | ||||||||
|---|---|---|---|---|---|---|---|---|
| Party | Candidate | Votes | % | ±% | ||||
| Liberal | Ovid Jackson | 25,693 | 49.1 | +10.2 | ||||
| Reform | Alan Aston | 12,939 | 24.7 | |||||
| Progressive Conservative | Stew O'Keefe | 9,836 | 18.8 | -22.1 | ||||
| New Democratic | Cathy Hird | 2,259 | 4.3 | -14.7 | ||||
| National | Stuart Marwick | 1,001 | 1.9 | |||||
| Green | Jim Garrity | 320 | 0.6 | 0.0 | ||||
| Natural Law | John Wolter | 158 | 0.3 | |||||
| Libertarian | Ralph Hanke | 152 | 0.3 | |||||
| Total valid votes | 52,358 | 100.0 | ||||||
| Canadian federal election, 1988 | ||||||||
|---|---|---|---|---|---|---|---|---|
| Party | Candidate | Votes | % | ±% | ||||
| Progressive Conservative | Gus Mitges | 19,748 | 40.9 | -23.9 | ||||
| Liberal | Douglas M. Thompson | 18,796 | 38.9 | +15.6 | ||||
| New Democratic | Cathy Hird | 9,183 | 19.0 | +7.0 | ||||
| Green | Don Cianci | 317 | 0.7 | |||||
| Commonwealth of Canada | George Bothwell | 267 | 0.6 | |||||
| Total valid votes | 48,311 | 100.0 | ||||||
| Canadian federal election, 1984 | ||||||||
|---|---|---|---|---|---|---|---|---|
| Party | Candidate | Votes | % | ±% | ||||
| Progressive Conservative | Gary M. Gurbin | 27,611 | 64.7 | +17.4 | ||||
| Liberal | Ron Oswald | 9,931 | 23.3 | -17.3 | ||||
| New Democratic | Norma Peterson | 5,112 | 12.0 | +0.7 | ||||
| Total valid votes | 42,654 | 100.0 | ||||||
| Canadian federal election, 1980 | ||||||||
|---|---|---|---|---|---|---|---|---|
| Party | Candidate | Votes | % | ±% | ||||
| Progressive Conservative | Gary M. Gurbin | 18,326 | 47.3 | -5.1 | ||||
| Liberal | Rodger D. Schwass | 15,735 | 40.6 | +5.2 | ||||
| New Democratic | Malcolm A. Kennett | 4,391 | 11.3 | -0.3 | ||||
| Libertarian | Jim Turner | 299 | 0.8 | +0.2 | ||||
| Total valid votes | 38,751 | 100.0 | ||||||
| Canadian federal election, 1979 | ||||||||
|---|---|---|---|---|---|---|---|---|
| Party | Candidate | Votes | % | ±% | ||||
| Progressive Conservative | Gary M. Gurbin | 21,219 | 52.4 | +9.9 | ||||
| Liberal | Crawford Douglas | 14,314 | 35.4 | -12.2 | ||||
| New Democratic | John Giese | 4,723 | 11.7 | +1.7 | ||||
| Libertarian | Norman Helen Watson | 223 | 0.6 | |||||
| Total valid votes | 40,479 | 100.0 | ||||||
Bruce
| Canadian federal election, 1974 | ||||||||
|---|---|---|---|---|---|---|---|---|
| Party | Candidate | Votes | % | ±% | ||||
| Liberal | Crawford Douglas | 17,158 | 47.5 | +2.2 | ||||
| Progressive Conservative | John Loney | 15,346 | 42.5 | -0.7 | ||||
| New Democratic | Gene Kiviaho | 3,586 | 9.9 | -1.5 | ||||
| Total valid votes | 36,090 | 100.0 | ||||||
| Canadian federal election, 1972 | ||||||||
|---|---|---|---|---|---|---|---|---|
| Party | Candidate | Votes | % | ±% | ||||
| Liberal | Ross Whicher | 14,974 | 45.3 | -1.4 | ||||
| Progressive Conservative | John Loney | 14,297 | 43.3 | +0.6 | ||||
| New Democratic | Thomas Thompson | 3,772 | 11.4 | +0.8 | ||||
| Total valid votes | 33,043 | 100.0 | ||||||
| Canadian federal election, 1968 | ||||||||
|---|---|---|---|---|---|---|---|---|
| Party | Candidate | Votes | % | ±% | ||||
| Liberal | Ross Whicher | 12,775 | 46.7 | +7.1 | ||||
| Progressive Conservative | John Loney | 11,674 | 42.7 | -7.3 | ||||
| New Democratic | Eric Nelson | 2,911 | 10.6 | +0.1 | ||||
| Total valid votes | 27,360 | 100.0 | ||||||
| Canadian federal election, 1965 | ||||||||
|---|---|---|---|---|---|---|---|---|
| Party | Candidate | Votes | % | ±% | ||||
| Progressive Conservative | John Loney | 6,846 | 49.9 | -1.6 | ||||
| Liberal | Kent Lamont | 5,424 | 39.6 | -4.7 | ||||
| New Democratic | Thomas Morris | 1,443 | 10.5 | |||||
| Total valid votes | 13,713 | 100.0 | ||||||
| Canadian federal election, 1963 | ||||||||
|---|---|---|---|---|---|---|---|---|
| Party | Candidate | Votes | % | ±% | ||||
| Progressive Conservative | John Loney | 7,451 | 51.5 | -0.1 | ||||
| Liberal | John H. Mackenzie | 6,401 | 44.3 | +2.6 | ||||
| Independent | Alex Scarrow | 611 | 4.2 | |||||
| Total valid votes | 14,463 | 100.0 | ||||||
| Canadian federal election, 1962 | ||||||||
|---|---|---|---|---|---|---|---|---|
| Party | Candidate | Votes | % | ±% | ||||
| Progressive Conservative | Andrew E. Robinson | 7,604 | 51.6 | -10.7 | ||||
| Liberal | John H. Mackenzie | 6,141 | 41.7 | +4.0 | ||||
| Co-operative Commonwealth | Lorne Richards | 706 | 4.8 | |||||
| Social Credit | Sandy Macdonald | 279 | 1.9 | |||||
| Total valid votes | 14,730 | 100.0 | ||||||
| Canadian federal election, 1958 | ||||||||
|---|---|---|---|---|---|---|---|---|
| Party | Candidate | Votes | % | ±% | ||||
| Progressive Conservative | Andrew E. Robinson | 8,225 | 62.3 | +4.8 | ||||
| Liberal | Chester M. Merriam | 4,975 | 37.7 | -4.8 | ||||
| Total valid votes | 13,200 | 100.0 | ||||||
| Canadian federal election, 1957 | ||||||||
|---|---|---|---|---|---|---|---|---|
| Party | Candidate | Votes | % | ±% | ||||
| Progressive Conservative | Andrew E. Robinson | 8,225 | 57.5 | +6.3 | ||||
| Liberal | Donald B. Blue | 6,089 | 42.5 | -6.3 | ||||
| Total valid votes | 14,314 | 100.0 | ||||||
| Canadian federal election, 1953 | ||||||||
|---|---|---|---|---|---|---|---|---|
| Party | Candidate | Votes | % | ±% | ||||
| Progressive Conservative | Andrew E. Robinson | 7,132 | 51.2 | +1.0 | ||||
| Liberal | Donald B. Blue | 6,808 | 48.8 | +4.3 | ||||
| Total valid votes | 13,940 | 100.0 | ||||||
| Canadian federal election, 1949 | ||||||||
|---|---|---|---|---|---|---|---|---|
| Party | Candidate | Votes | % | ±% | ||||
| Liberal | Donald B. Blue | 7,517 | 50.1 | +5.8 | ||||
| Progressive Conservative | Andrew E. Robinson | 6,685 | 44.6 | -3.2 | ||||
| Co-operative Commonwealth | Aubrey John Mercer | 795 | 5.3 | |||||
| Total valid votes | 14,997 | 100.0 | ||||||
| Canadian federal election, 1945 | ||||||||
|---|---|---|---|---|---|---|---|---|
| Party | Candidate | Votes | % | ±% | ||||
| Progressive Conservative | Andrew E. Robinson | 6,933 | 47.8 | +6.3 | ||||
| Liberal | Carl Whicher | 6,430 | 44.3 | -14.1 | ||||
| Co-operative Commonwealth | Moffatt Jamieson | 1,137 | 7.8 | |||||
| Total valid votes | 14,500 | 100.0 | ||||||
Note: Progressive Conservative vote is compared to "National Government" vote in 1940 election.
| Canadian federal election, 1940 | ||||||||
|---|---|---|---|---|---|---|---|---|
| Party | Candidate | Votes | % | ±% | ||||
| Liberal | William Rae Tomlinson | 7,420 | 58.4 | +12.8 | ||||
| National Government | Leigh H. Snider | 5,275 | 41.6 | +7.1 | ||||
| Total valid votes | 12,695 | 100.0 | ||||||
Note: "National Government" vote is compared to Conservative vote in 1935 election.
| Canadian federal election, 1935 | ||||||||
|---|---|---|---|---|---|---|---|---|
| Party | Candidate | Votes | % | |||||
| Liberal | William Rae Tomlinson | 6,831 | 45.7 | |||||
| Conservative | Gideon H. Ruttle | 5,149 | 34.4 | |||||
| Reconstruction | William Guy Nicholson | 2,973 | 19.9 | |||||
| Total valid votes | 14,953 | 100.0 | ||||||
See also
References
- "(Code 35026) Census Profile". 2011 census. Statistics Canada. 2012. Retrieved 2012-03-01.
Notes
External links
Riding history from the Library of Parliament:
- Bruce (1933 - 1975)
- Bruce-Grey (1975 - 2000)
- Grey-Bruce-Owen Sound (2000 - 2003)
- Bruce-Grey-Owen Sound (2004 - )
- Website of the Parliament of Canada
- Campaign expense data from Elections Canada