Mississauga—Erindale
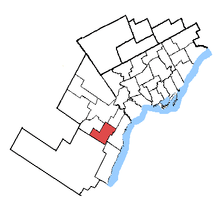 Mississauga—Erindale in relation to other Greater Toronto ridings | |
| Defunct federal electoral district | |
| Legislature | House of Commons |
| District created | 2003 |
| District abolished | 2013 |
| First contested | 2004 |
| Last contested | 2011 |
| District webpage | profile, map |
| Demographics | |
| Population (2011)[1] | 160,663 |
| Electors (2011) | 99,774 |
| Area (km²)[2] | 46.63 |
| Census divisions | Peel |
| Census subdivisions | Mississauga |
.png)
Mississauga—Erindale was a federal electoral district in Ontario, Canada, that was represented in the House of Commons of Canada from 2004 to 2015.
It was created in 2003 from parts of Mississauga Centre and Mississauga West ridings. In 2013, it was abolished into Mississauga—Erin Mills, Mississauga Centre and Mississauga—Lakeshore.
It consisted of the part of the City of Mississauga bounded by a line drawn from the southwestern city limit northeast along Britannia Road West, southeast along Erin Mills Parkway, northeast along Eglinton Avenue West, southeast along Mavis Road, southwest along the Queensway West, west along the Credit River and southwest along Dundas Street West to the city limit.
Members of Parliament
This riding has elected the following Member of Parliament:
| Parliament | Years | Member | Party | |
|---|---|---|---|---|
| Mississauga—Erindale Riding created from Mississauga Centre and Mississauga West |
||||
| 38th | 2004–2004 | Carolyn Parrish | Liberal | |
| 2004–2006 | Independent | |||
| 39th | 2006–2008 | Omar Alghabra | Liberal | |
| 40th | 2008–2011 | Bob Dechert | Conservative | |
| 41st | 2011–2015 | |||
| Riding dissolved into Mississauga—Erin Mills, Mississauga Centre and Mississauga—Lakeshore |
||||
Election results
| Canadian federal election, 2011 | ||||||||
|---|---|---|---|---|---|---|---|---|
| Party | Candidate | Votes | % | ±% | Expenditures | |||
| Conservative | Bob Dechert | 29,793 | 46.95 | +4.24 | – | |||
| Liberal | Omar Alghabra | 21,541 | 33.95 | -8.05 | – | |||
| New Democratic | Michelle Bilek | 10,327 | 16.27 | +7.73 | – | |||
| Green | John Fraser | 1,694 | 2.67 | -3.83 | – | |||
| Marxist–Leninist | Dagmar Sullivan | 99 | 0.16 | -0.07 | – | |||
| Total valid votes | 63,454 | 100.00 | – | |||||
| Total rejected ballots | 217 | 0.34 | -0.02 | |||||
| Turnout | 63,671 | 61.61 | +5.4 | |||||
| Eligible voters | 103,337 | – | – | |||||
| Canadian federal election, 2008 | ||||||||
|---|---|---|---|---|---|---|---|---|
| Party | Candidate | Votes | % | ±% | Expenditures | |||
| Conservative | Bob Dechert | 23,863 | 42.71 | +3.3 | $96,559 | |||
| Liberal | Omar Alghabra | 23,466 | 42.00 | -2.8 | $74,412 | |||
| New Democratic | Mustafa Rizvi | 4,774 | 8.54 | -2.6 | $1,330 | |||
| Green | Richard Pietro | 3,636 | 6.50 | +2.1 | ||||
| Marxist–Leninist | Dagmar Sullivan | 129 | 0.23 | -0.3 | ||||
| Total valid votes/Expense limit | 55,868 | 100.00 | $98,112 | |||||
| Total rejected ballots | 203 | 0.36 | -0.06 | |||||
| Turnout | 56,071 | 56.2 | -9.9 | |||||
| Canadian federal election, 2006 | ||||||||
|---|---|---|---|---|---|---|---|---|
| Party | Candidate | Votes | % | ±% | Expenditures | |||
| Liberal | Omar Alghabra | 26,852 | 44.81 | -9.56 | $75,892 | |||
| Conservative | Bob Dechert | 23,524 | 39.25 | +7.30 | $81,890 | |||
| New Democratic | Rupinder Brar | 6,644 | 11.08 | +1.26 | $3,459 | |||
| Green | Adam Hunter | 2,613 | 4.36 | +0.79 | $1,484 | |||
| Independent | Ronnie Amyotte | 289 | 0.48 | – | $1,249 | |||
| Total valid votes/Expense limit | 59,922 | 100.00 | $162,852 | |||||
| Total rejected ballots | 251 | 0.42 | -0.10 | |||||
| Turnout | 60,173 | 65.5 | +6.2 | |||||
| Canadian federal election, 2004 | ||||||||
|---|---|---|---|---|---|---|---|---|
| Party | Candidate | Votes | % | ±% | Expenditures | |||
| Liberal | Carolyn Parrish | 28,246 | 54.37 | $77,822 | ||||
| Conservative | Bob Dechert | 16,600 | 31.95 | – | $77,446 | |||
| New Democratic | Simon Black | 5,104 | 9.82 | – | $2,602 | |||
| Green | Jeff Brownridge | 1,855 | 3.57 | – | $2,212 | |||
| Marxist–Leninist | David Greig | 145 | 0.28 | $37.60 | ||||
| Total valid votes/Expense limit | 51,950 | 100.00 | $160,120 | |||||
| Total rejected ballots | 269 | 0.52 | ||||||
| Turnout | 52,219 | 60.3 | ||||||
See also
References
- "(Code 35049) Census Profile". 2011 census. Statistics Canada. 2012. Retrieved 2011-03-03.
- Riding history from the Library of Parliament
- 2011 Results from Elections Canada
- Campaign expense data from Elections Canada
Notes
- ↑ Statistics Canada: 2011
- ↑ Statistics Canada: 2011