Perth—Wellington
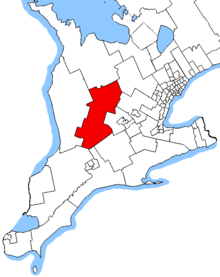 Perth—Wellington in relation to other southern Ontario ridings (2013 boundaries) | |||
| Federal electoral district | |||
| Legislature | House of Commons | ||
| MP |
Conservative | ||
| District created | 2003 | ||
| First contested | 2004 | ||
| Last contested | 2015 | ||
| District webpage | profile, map | ||
| Demographics | |||
| Population (2011)[1] | 104,912 | ||
| Electors (2015) | 75,217 | ||
| Area (km²)[2] | 3,580.14 | ||
| Pop. density (per km²) | 29.3 | ||
| Census divisions | Perth, Wellington | ||
| Census subdivisions | Minto, Wellington North, North Perth, Mapleton, West Perth, Perth East, Stratford, Perth South, St. Marys | ||
Perth—Wellington is a federal electoral district in southwestern Ontario, Canada, that has been represented in the House of Commons of Canada since 2004. The riding consists of:
- Perth County including the City of Stratford and the Town of St Marys, and
- the Town of Minto, the Townships of Mapleton and Wellington North in the County of Wellington.[3]
Demographics
| Canada census – Perth—Wellington community profile | |||
|---|---|---|---|
| 2011 | |||
| Population: | 104,912 (1.0% from 2006) | ||
| Land area: | 3,580.14 km2 (1,382.30 sq mi) | ||
| Population density: | 29.3/km2 (76/sq mi) | ||
| Median age: | 40.5 (M: 39.1, F: 41.8) | ||
| Total private dwellings: | 42,111 | ||
| Median household income: | $63,182 | ||
| Notes: NHS Profile, Statistics Canada – References: 2011[4] earlier[5] | |||
| Group | 2011 Census | |
|---|---|---|
| Population | % of total | |
| Aboriginal | 1,895 | 1.9 |
| Visible Minority | 2,070 | 2.0 |
| All other | 98,800 | 96.1 |
| Total | 102,765 | 100.0 |
| Group | 2011 Census | |
|---|---|---|
| Population | % of total | |
| English | 89,950 | 86.9 |
| French | 645 | 0.6 |
| English and French | 100 | 0.1 |
| All other | 12,850 | 12.4 |
| Total | 103,545 | 100.0 |
(Other languages, 2011: 7.2% German, 2.2% Dutch)
| Group | 2011 Census | |
|---|---|---|
| Population | % of total | |
| At the same address | 67,290 | 69.9 |
| In the same constituency | 14,620 | 15.2 |
| In the same province | 12,880 | 13.3 |
| From another province | 605 | 0.6 |
| From another country | 910 | 1.0 |
| Total aged 5 or over | 96,305 | 100.0 |
Religions: 79.3% Christian (18.6% Catholic, 15.6% United Church, 8.7% Presbyterian, 7.5% Lutheran, 5.7% Anglican, 2.1% Baptist, 1.3% Pentecostal, 19.8% Other), 19.8% No religion
Median individual income (2010): $31,468
Average individual income (2010): $37,380
History
The riding was created in 2003 from parts of Perth—Middlesex (76%), Waterloo—Wellington (17%) and Dufferin—Peel—Wellington—Grey (7%) ridings. It did not undergo any boundary changes in the 2012 electoral redistribution.[8]
Members of Parliament
| Parliament | Years | Member | Party | |
|---|---|---|---|---|
| Perth—Wellington Riding created from Dufferin—Peel—Wellington—Grey, Perth—Middlesex and Waterloo—Wellington |
||||
| 38th | 2004–2006 | Gary Schellenberger | Conservative | |
| 39th | 2006–2008 | |||
| 40th | 2008–2011 | |||
| 41st | 2011–2015 | |||
| 42nd | 2015–Present | John Nater | ||
Election results
| Canadian federal election, 2015 | ||||||||
|---|---|---|---|---|---|---|---|---|
| Party | Candidate | Votes | % | ±% | Expenditures | |||
| Conservative | John Nater | 22,255 | 43.0 | -11.5 | $125,945.50 | |||
| Liberal | Stephen McCotter | 19,420 | 37.5 | +19.5 | $54,799.08 | |||
| New Democratic | Ethan Rabidoux | 7,756 | 15.0 | -6.3 | $39,763.84 | |||
| Green | Nicole Ramsdale | 1,347 | 2.6 | -2.0 | – | |||
| Christian Heritage | Irma DeVries | 794 | 1.5 | -0.2 | $11,543.38 | |||
| No affiliation | Roger Fuhr | 217 | 0.4 | – | $28.00 | |||
| Total valid votes/Expense limit | 51,789 | 100.0 | $208,635.42 | |||||
| Total rejected ballots | – | – | ||||||
| Turnout | 51,789 | 68.1% | +4.6% | |||||
| Eligible voters | 76,097 | |||||||
| Conservative hold | Swing | -15.5% | ||||||
| Source: Elections Canada[9][10] | ||||||||
| Canadian federal election, 2011 | ||||||||
|---|---|---|---|---|---|---|---|---|
| Party | Candidate | Votes | % | ±% | Expenditures | |||
| Conservative | Gary Schellenberger | 25,281 | 54.5 | +6.5 | $82,570 | |||
| New Democratic | Ellen Papenburg | 9,861 | 21.3 | +4.3 | $17,764 | |||
| Liberal | Bob McTavish | 8,341 | 18.0 | -5.7 | $40,957 | |||
| Green | John Cowling | 2,112 | 4.6 | -4.5 | $4.790 | |||
| Christian Heritage | Irma DeVries | 806 | 1.7 | -0.4 | $8,010 | |||
| Total valid votes/Expense limit | 46,401 | 100.00 | $84,700 | |||||
| Total rejected ballots | 179 | – | ||||||
| Turnout | 46,580 | 63.5% | ||||||
| Eligible voters | 73,391 | |||||||
| Conservative hold | Swing | +1.1% | ||||||
| Canadian federal election, 2008 | ||||||||
|---|---|---|---|---|---|---|---|---|
| Party | Candidate | Votes | % | ±% | Expenditures | |||
| Conservative | Gary Schellenberger | 20,709 | 48.0 | +1.9 | $68,139 | |||
| Liberal | Sandra Gardiner | 10,225 | 23.7 | -1.9 | $29,238 | |||
| New Democratic | Kerry McManus | 7,234 | 17.0 | -1.8 | $23,081 | |||
| Green | John Cowling | 3,884 | 9.0 | +2.5 | $13,365 | |||
| Christian Heritage | Irma DeVries | 898 | 2.1 | -0.8 | $8,662 | |||
| Marxist–Leninist | Julian Ichim | 98 | 0.2 | |||||
| Total valid votes/Expense limit | 43,048 | 100.0 | $82,152 | |||||
| Conservative hold | Swing | +1.9% | ||||||
| Canadian federal election, 2006 | ||||||||
|---|---|---|---|---|---|---|---|---|
| Party | Candidate | Votes | % | ±% | ||||
| Conservative | Gary Schellenberger | 22,004 | 46.1 | +4.1 | ||||
| Liberal | David Cunningham | 12,301 | 25.8 | -7.6 | ||||
| New Democratic | Keith Dinicol | 8,876 | 18.6 | +3.0 | ||||
| Green | John Cowling | 3,117 | 6.5 | +0.3 | ||||
| Christian Heritage | Irma DeVries | 1,396 | 2.9 | +0.1 | ||||
| Total valid votes | 47,694 | 100.0 | ||||||
| Conservative hold | Swing | +5.9% | ||||||
| Canadian federal election, 2004 | ||||||||
|---|---|---|---|---|---|---|---|---|
| Party | Candidate | Votes | % | |||||
| Conservative | Gary Schellenberger | 18,879 | 42.0 | |||||
| Liberal | Brian Innes | 15,032 | 33.4 | |||||
| New Democratic | Robert Roth | 7,027 | 15.6 | |||||
| Green | John Cowling | 2,770 | 6.2 | |||||
| Christian Heritage | Irma Nicolette Devries | 1,273 | 2.8 | |||||
| Total valid votes | 44,981 | 100.0 | ||||||
See also
References
- ↑ Statistics Canada: 2011
- ↑ Statistics Canada: 2011
- ↑ "Perth–Wellington | Maps Corner | Elections Canada Online". elections.ca. Retrieved 2015-08-17.
- ↑ "2011 Community Profiles". Canada 2011 Census. Statistics Canada. July 5, 2013. Retrieved 2015-09-08.
- ↑ "2001 Community Profiles". Canada 2001 Census. Statistics Canada. February 17, 2012.
- ↑ in private households
- ↑ excluding institutional residents
- ↑ "Perth - Wellington". CBC News. CBC. 2008. Retrieved 8 March 2017.
- ↑ Elections Canada – Confirmed candidates for Perth—Wellington, 30 September 2015
- ↑ Elections Canada – Preliminary Election Expenses Limits for Candidates
External links
- "(Code 35070) Census Profile". 2011 census. Statistics Canada. 2012. Retrieved 2011-03-03.
- Riding history from the Library of Parliament
- 2011 results from Elections Canada
- Campaign expense data from Elections Canada
This article is issued from
Wikipedia.
The text is licensed under Creative Commons - Attribution - Sharealike.
Additional terms may apply for the media files.