Mississauga—Erin Mills
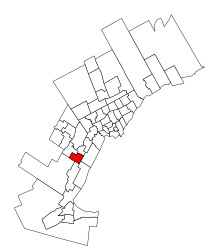 Mississauga—Erin Mills in relation to other Greater Toronto Area districts | |||
| Federal electoral district | |||
| Legislature | House of Commons | ||
| MP |
Liberal | ||
| District created | 2013 | ||
| First contested | 2015 | ||
| District webpage | profile, map | ||
| Demographics | |||
| Population (2011)[1] | 117,199 | ||
| Electors (2015) | 80,912 | ||
| Area (km²)[2] | 36 | ||
| Pop. density (per km²) | 3,255.5 | ||
| Census divisions | Peel | ||
| Census subdivisions | Mississauga | ||
Mississauga—Erin Mills is a federal electoral district in Ontario. It encompasses a portion of Ontario formerly included in the electoral district of Mississauga—Erindale.[3]
Mississauga—Erin Mills was created by the 2012 federal electoral boundaries redistribution and was legally defined in the 2013 representation order. It came into effect upon the call of the 42nd Canadian federal election, scheduled for 19 October 2015.[4]
Demographics
- According to the Canada 2011 Census; 2013 representation[5][6]
Ethnic groups: 40.2% White, 23.5% South Asian, 9.9% Chinese, 6.5% Black, 5.1% Filipino, 4.9% Arab, 1.9% Latin American, 1.6% Southeast Asian, 1.5% Korean, 1.3% West Asian
Languages: 52.8% English, 7.6% Chinese, 7.3% Urdu, 4.4% Arabic, 3.3% Polish, 2.6% Tagalog, 2.0% Spanish, 1.9% Punjabi, 1.7% Portuguese, 1.6% French, 1.3% Italian, 1.2% Korean, 1.1% Hindi
Religions: 57.6% Christian (34.6% Catholic, 3.5% Christian Orthodox, 3.3% Anglican, 2.8% United Church, 1.9% Presbyterian, 1.6% Pentecostal, 1.6% Baptist, 8.1% Other), 16.2% Muslim, 5.7% Hindu, 2.1% Buddhist, 2.0% Sikh, 15.5% No religion
Median income (2010): $31,924
Average income (2010): $44,117
Members of Parliament
This riding has elected the following Members of Parliament:
| Parliament | Years | Member | Party | |
|---|---|---|---|---|
| Mississauga—Erin Mills Riding created from Mississauga—Erindale and Halton |
||||
| 42nd | 2015–Present | Iqra Khalid | Liberal | |
Election results
| Canadian federal election, 2015 | ||||||||
|---|---|---|---|---|---|---|---|---|
| Party | Candidate | Votes | % | ±% | Expenditures | |||
| Liberal | Iqra Khalid | 27,520 | 49.72 | +15.34 | $76,451.79 | |||
| Conservative | Bob Dechert | 21,716 | 39.24 | -7.35 | $193,213.89 | |||
| New Democratic | Michelle Bilek | 5,206 | 9.41 | -6.74 | $16,151.22 | |||
| Green | Andrew Roblin | 905 | 1.64 | -1.11 | – | |||
| Total valid votes/Expense limit | 55,347 | 100.00 | $218,158.57 | |||||
| Total rejected ballots | 245 | 0.44 | – | |||||
| Turnout | 55,592 | 67.51 | – | |||||
| Eligible voters | 82,348 | |||||||
| Liberal gain from Conservative | Swing | +11.34 | ||||||
| Source: Elections Canada[7][8] | ||||||||
| 2011 federal election redistributed results[9] | |||
|---|---|---|---|
| Party | Vote | % | |
| Conservative | 21,646 | 46.58 | |
| Liberal | 15,978 | 34.39 | |
| New Democratic | 7,503 | 16.15 | |
| Green | 1,274 | 2.74 | |
| Marxist–Leninist | 66 | 0.14 | |
References
- ↑ Statistics Canada: 2011
- ↑ Statistics Canada: 2011
- ↑ Final Report – Ontario
- ↑ Timeline for the Redistribution of Federal Electoral Districts
- ↑ http://www12.statcan.gc.ca/nhs-enm/2011/dp-pd/prof/details/page.cfm?Lang=E&Geo1=FED2013&Code1=35060&Data=Count&SearchText=Mississauga&SearchType=Begins&SearchPR=01&A1=All&B1=All&Custom=&TABID=1
- ↑ http://www12.statcan.gc.ca/nhs-enm/2011/dp-pd/prof/details/page.cfm?Lang=E&Geo1=FED2013&Code1=35060&Data=Count&SearchText=Mississauga&SearchType=Begins&SearchPR=01&A1=All&B1=All&Custom=&TABID=1#tabs2
- ↑ Elections Canada – Confirmed candidates for Mississauga—Erin Mills, 30 September 2015
- ↑ Elections Canada – Preliminary Election Expenses Limits for Candidates Archived 2016-03-04 at the Wayback Machine.
- ↑ Pundits' Guide to Canadian Elections
External links
- https://iqrakhalid.liberal.ca/
- http://mississaugaerinmillsndp.ca/
- https://www.greenparty.ca/en/riding/2013-35060
Coordinates: 43°32′42″N 79°41′53″W / 43.545°N 79.698°W