Niagara Centre
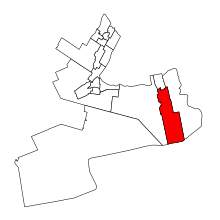 Niagara Centre in relation to nearby electoral districts | |||
| Federal electoral district | |||
| Legislature | House of Commons | ||
| MP |
Liberal | ||
| District created | 1996 | ||
| First contested | 1997 | ||
| Last contested | 2015 | ||
| District webpage | profile, map | ||
| Demographics | |||
| Population (2011)[1] | 105,860 | ||
| Electors (2015) | 81,364 | ||
| Area (km²)[2] | 334 | ||
| Pop. density (per km²) | 316.9 | ||
| Census divisions | Niagara | ||
| Census subdivisions | Welland, Thorold, Port Colborne, St. Catharines | ||
Niagara Centre (French: Niagara-Centre; formerly Welland) is a federal electoral district in the Niagara Region of Ontario that has been represented in the House of Commons of Canada from 1867 to 1988 and since 1997.
Demographics
- According to the Canada 2011 Census; 2013 representation[3][4]
Ethnic groups: 92.2% White, 2.9% Aboriginal, 1.5% Black
Languages: 82.3% English, 7.3% French, 3.4% Italian
Religions: 76.6% Christian (40.4% Catholic, 8.5% Anglican, 7.3% United Church, 3.3% Presbyterian, 1.9% Baptist, 1.8% Lutheran, 1.3% Pentecostal, 12.1% Other), 21.8% No religion
Median income (2010): $28,573
Average income (2010): $35,416
Geography
Niagara Centre consists of the cities of Welland, Thorold, and Port Colborne, and the part of the City of St. Catharines lying south of a line drawn from the southern city limit north along First Louth St, east along St. Paul Street West, northeast along St. Paul Crescent, east and south along Twelve Mile Creek, and east along Glendale Avenue to the eastern city limit.[5]
History
Welland was originally created in 1867 by the British North America Act. It consisted initially of the Townships of Bertie, Crowland, Humberstone, Stamford, Thorold, and Willoughby, and the Villages of Chippawa, Clifton, Fort Erie, Thorold and Welland.
In 1892, the riding was redefined to exclude reference to the Village of Clifton, and include the villages of Niagara Falls and Port Colborne, and the town of Niagara Falls. In 1903, it was redefined to consist of the county of Welland.
In 1952, it was redefined to consist of the townships of Pelham, Thorold, Crowland, Humberstone and Wainfleet, including the city of Welland and the towns of Port Colborne, Thorold, Fonthill and Humberstone.
In 1966, it was redefined to consist of:
- in Welland County, the City of Welland and the Townships of Crowland, Humberstone and Wainfleet; and
- in Haldimand County, the Townships of Canborough, Dunn, Moulton and Sherbrooke.
In 1976, it was redefined to consist of the City of Welland, the Town of Thorold, and the part of the City of St. Catharines lying south of the Canadian National Railway.
The electoral district was abolished in 1987 when it was redistributed between Welland—St. Catharines—Thorold, St. Catharines and Erie ridings.
A new riding, named Niagara Centre was created in 1996 from parts of Erie and Welland—St. Catharines—Thorold ridings. It existed only for the 1997 and 2000 elections.
It consisted of the Town of Pelham, the City of Welland, the southern part of the City of St. Catharines, and the part of the City of Thorold lying west of the Welland Canal.
The electoral district was abolished in 2003 when it was redistributed between Niagara West—Glanbrook, St. Catharines and Welland ridings.
In 2003, a new Welland riding was created from parts of Erie—Lincoln, Niagara Centre, Niagara Falls and St. Catharines ridings.
Welland was abolished in 2013, and was largely replaced by a new riding named Niagara Centre. The riding lost Wainfleet and the rural southwestern corner of St. Catharines.
Members of Parliament
This riding has elected the following Members of Parliament:
Election results
Niagara Centre, 2015–present
| Canadian federal election, 2015 | ||||||||
|---|---|---|---|---|---|---|---|---|
| Party | Candidate | Votes | % | ±% | Expenditures | |||
| Liberal | Vance Badawey | 19,513 | 35.68 | +21.32 | $68,715.34 | |||
| New Democratic | Malcolm Allen | 17,218 | 31.49 | -11.68 | $112,516.69 | |||
| Conservative | Leanna Villella | 16,248 | 29.71 | -9.36 | $53,250.55 | |||
| Green | David Clow | 1,316 | 2.41 | -0.07 | - | |||
| Animal Alliance | Jody Di Bartolomeo | 291 | 0.53 | – | $118.73 | |||
| Marxist–Leninist | Ron J. Walker | 96 | 0.18 | |||||
| Total valid votes/Expense limit | 54,682 | 100.00 | - | $218,835.14 | ||||
| Total rejected ballots | 323 | 0.59 | – | |||||
| Turnout | 55,005 | 66.83 | – | |||||
| Eligible voters | 82,305 | |||||||
| Liberal gain from New Democratic | Swing | +16.50 | ||||||
| Source: Elections Canada[6][7] | ||||||||
Welland, 2003–2015
| Canadian federal election, 2011 | ||||||||
|---|---|---|---|---|---|---|---|---|
| Party | Candidate | Votes | % | ±% | Expenditures | |||
| New Democratic | Malcolm Allen | 21,917 | 42.2 | +9.3 | ||||
| Conservative | Leanna Villella | 20,895 | 40.2 | +7.9 | ||||
| Liberal | John Maloney | 7,276 | 14 | -13.9 | ||||
| Green | Robin Williamson | 1,297 | 2.5 | -3 | ||||
| Christian Heritage | David Vangoolen | 299 | 0.6 | – | ||||
| Independent | Ray Game | 169 | 0.3 | – | ||||
| Marxist–Leninist | Ron Walker | 71 | 0.1 | -0.1 | ||||
| Total valid votes/Expense limit | 51,924 | 100.00 | ||||||
| Total rejected ballots | 293 | 0.6 | – | |||||
| Turnout | 52,217 | 61.8 | – | |||||
| Eligible voters | 84,434 | – | – | |||||
| Canadian federal election, 2008 | ||||||||
|---|---|---|---|---|---|---|---|---|
| Party | Candidate | Votes | % | ±% | Expenditures | |||
| New Democratic | Malcolm Allen | 16,842 | 32.9 | +2.3 | $67,119 | |||
| Conservative | Alf Kiers | 16,542 | 32.3 | +2.8 | $84,414 | |||
| Liberal | John Maloney | 14,295 | 27.9 | -7.6 | $84,267 | |||
| Green | Jennifer Mooradian | 2,816 | 5.5 | +2.1 | ||||
| Independent | Jody Di Bartolomeo | 569 | 1.1 | – | ||||
| Marxist–Leninist | Ron Walker | 114 | 0.2 | – | ||||
| Total valid votes/Expense limit | 51,178 | 100.0 | $88,895 | |||||
| Canadian federal election, 2006 | ||||||||
|---|---|---|---|---|---|---|---|---|
| Party | Candidate | Votes | % | ±% | ||||
| Liberal | John Maloney | 20,238 | 35.6 | -4.0 | ||||
| New Democratic | Jody Di Bartolomeo | 17,484 | 30.7 | +1.2 | ||||
| Conservative | Mel Grunstein | 16,665 | 29.3 | +3.1 | ||||
| Green | Brian Simpson | 1,960 | 3.4 | +0.5 | ||||
| Christian Heritage | Irma D. Ruiter | 536 | 0.9 | -0.6 | ||||
| Total valid votes | 56,883 | 100.0 | ||||||
| Canadian federal election, 2004 | ||||||||
|---|---|---|---|---|---|---|---|---|
| Party | Candidate | Votes | % | |||||
| Liberal | John Maloney | 19,642 | 39.6 | |||||
| New Democratic | Jody Di Bartolomeo | 14,623 | 29.5 | |||||
| Conservative | Mel Grunstein | 12,997 | 26.2 | |||||
| Green | Ryan McLaughlin | 1,454 | 2.9 | |||||
| Christian Heritage | Irma D. Ruiter | 735 | 1.5 | |||||
| Marxist–Leninist | Ron Walker | 113 | 0.2 | |||||
| Total valid votes | 49,564 | 100.0 | ||||||
Niagara Centre, 1996–2003
| Canadian federal election, 2000 | ||||||||
|---|---|---|---|---|---|---|---|---|
| Party | Candidate | Votes | ||||||
| Liberal | Tony Tirabassi | 21,641 | ||||||
| Alliance | Bernie Law | 13,313 | ||||||
| New Democratic | Mike Grimaldi | 7,029 | ||||||
| Progressive Conservative | Joe Atkinson | 4,893 | ||||||
| Canadian Action | Tom Prue | 290 | ||||||
| Marxist–Leninist | Ron Walker | 149 | ||||||
| Canadian federal election, 1997 | ||||||||
|---|---|---|---|---|---|---|---|---|
| Party | Candidate | Votes | ||||||
| Liberal | Gilbert Parent | 24,115 | ||||||
| Reform | Don Johnstone | 12,053 | ||||||
| Progressive Conservative | Joe Atkinson | 5,827 | ||||||
| New Democratic | James Wilson | 5,510 | ||||||
| Christian Heritage | David Bylsma | 515 | ||||||
| Natural Law | Anne Larrass | 363 | ||||||
| Marxist–Leninist | Ron Walker | 143 | ||||||
Welland, 1867–1987
| Canadian federal election, 1984 | ||||||||
|---|---|---|---|---|---|---|---|---|
| Party | Candidate | Votes | % | ±% | ||||
| Progressive Conservative | Allan Pietz | 18,418 | 42.0 | +14.7 | ||||
| Liberal | Gilbert Parent | 14,481 | 33.0 | -10.8 | ||||
| New Democratic | Rob Dobrucki | 10,508 | 24.0 | -4.4 | ||||
| Green | Andrew Rivett | 284 | 0.6 | |||||
| Communist | John MacLennan | 145 | 0.3 | +0.1 | ||||
| Total valid votes | 43,836 | 100.0 | ||||||
| Canadian federal election, 1980 | ||||||||
|---|---|---|---|---|---|---|---|---|
| Party | Candidate | Votes | % | ±% | ||||
| Liberal | Gilbert Parent | 18,112 | 43.8 | +6.6 | ||||
| New Democratic | Robert Wright | 11,729 | 28.4 | +2.5 | ||||
| Progressive Conservative | George Krusell | 11,292 | 27.3 | -8.7 | ||||
| Communist | John Severinsky | 95 | 0.2 | 0.0 | ||||
| Marxist–Leninist | Ron Walker | 78 | 0.2 | 0.0 | ||||
| Total valid votes | 41,306 | 100.0 | ||||||
| Canadian federal election, 1979 | ||||||||
|---|---|---|---|---|---|---|---|---|
| Party | Candidate | Votes | % | ±% | ||||
| Liberal | Gilbert Parent | 16,025 | 37.2 | -19.3 | ||||
| Progressive Conservative | Allan E. Pietz | 15,527 | 36.1 | +11.8 | ||||
| New Democratic | Robert Wright | 11,151 | 25.9 | +7.3 | ||||
| Independent | John L. Sabados | 218 | 0.5 | |||||
| Communist | John Severinsky | 83 | 0.2 | -0.4 | ||||
| Marxist–Leninist | Ron Walker | 62 | 0.1 | |||||
| Total valid votes | 43,066 | 100.0 | ||||||
| Canadian federal election, 1974 | ||||||||
|---|---|---|---|---|---|---|---|---|
| Party | Candidate | Votes | % | ±% | ||||
| Liberal | Victor Railton | 21,228 | 56.5 | +7.2 | ||||
| Progressive Conservative | Alex McCrae | 9,107 | 24.2 | -7.3 | ||||
| New Democratic | Jim McPherson | 6,983 | 18.6 | -0.5 | ||||
| Communist | John Severinsky | 238 | 0.6 | |||||
| Total valid votes | 37,556 | 100.0 | ||||||
| Canadian federal election, 1972 | ||||||||
|---|---|---|---|---|---|---|---|---|
| Party | Candidate | Votes | % | ±% | ||||
| Liberal | Victor Railton | 18,693 | 49.3 | -0.5 | ||||
| Progressive Conservative | Kent Hodgson | 11,977 | 31.6 | +14.0 | ||||
| New Democratic | Ronald Cook | 7,256 | 19.1 | -13.5 | ||||
| Total valid votes | 37,926 | 100.0 | ||||||
| Canadian federal election, 1968 | ||||||||
|---|---|---|---|---|---|---|---|---|
| Party | Candidate | Votes | % | ±% | ||||
| Liberal | Donald R. Tolmie | 17,335 | 49.8 | -0.5 | ||||
| New Democratic | Robert Wright | 11,363 | 32.6 | +6.7 | ||||
| Progressive Conservative | Franklin Bud Law | 6,129 | 17.6 | -6.3 | ||||
| Total valid votes | 34,827 | 100.0 | ||||||
| Canadian federal election, 1965 | ||||||||
|---|---|---|---|---|---|---|---|---|
| Party | Candidate | Votes | % | ±% | ||||
| Liberal | Donald R. Tolmie | 17,869 | 50.2 | -5.0 | ||||
| New Democratic | Robert Wright | 9,206 | 25.9 | +12.0 | ||||
| Progressive Conservative | T.G. Spencer | 8,496 | 23.9 | |||||
| Total valid votes | 35,571 | 100.0 | ||||||
| Canadian federal election, 1963 | ||||||||
|---|---|---|---|---|---|---|---|---|
| Party | Candidate | Votes | % | ±% | ||||
| Liberal | William Hector McMillan | 19,879 | 55.3 | +7.7 | ||||
| Progressive Conservative | Francis Goldring | 9,291 | 25.8 | -7.2 | ||||
| New Democratic | Guy Mersereau | 5,010 | 13.9 | -2.9 | ||||
| Social Credit | J.M. Patterson | 1,413 | 3.9 | +2.2 | ||||
| Communist | Frank Haslam | 372 | 1.0 | +0.2 | ||||
| Total valid votes | 35,965 | 100.0 | ||||||
| Canadian federal election, 1962 | ||||||||
|---|---|---|---|---|---|---|---|---|
| Party | Candidate | Votes | % | ±% | ||||
| Liberal | William Hector McMillan | 17,614 | 47.6 | +4.9 | ||||
| Progressive Conservative | Allan Pietz | 12,209 | 33.0 | -6.1 | ||||
| New Democratic | Mel Swart | 6,225 | 16.8 | -1.4 | ||||
| Social Credit | W.F. Trelford | 630 | 1.7 | |||||
| Communist | Frank Haslam | 317 | 0.9 | |||||
| Total valid votes | 36,995 | 100.0 | ||||||
Note: NDP vote is compared to CCF vote in 1958 election.
| Canadian federal election, 1958 | ||||||||
|---|---|---|---|---|---|---|---|---|
| Party | Candidate | Votes | % | ±% | ||||
| Liberal | William Hector McMillan | 15,365 | 42.7 | +0.3 | ||||
| Progressive Conservative | Allan Ernest Pietz | 14,053 | 39.1 | +5.1 | ||||
| Co-operative Commonwealth | Mel Swart | 6,550 | 18.2 | -5.4 | ||||
| Total valid votes | 35,968 | 100.0 | ||||||
| Canadian federal election, 1957 | ||||||||
|---|---|---|---|---|---|---|---|---|
| Party | Candidate | Votes | % | ±% | ||||
| Liberal | William Hector McMillan | 13,241 | 42.4 | -12.8 | ||||
| Progressive Conservative | William Bigelow Wellington | 10,620 | 34.0 | +7.6 | ||||
| Co-operative Commonwealth | Melvin L. Swart | 7,356 | 23.6 | +7.8 | ||||
| Total valid votes | 31,217 | 100.0 | ||||||
| Canadian federal election, 1953 | ||||||||
|---|---|---|---|---|---|---|---|---|
| Party | Candidate | Votes | % | ±% | ||||
| Liberal | William Hector McMillan | 15,411 | 55.2 | +6.5 | ||||
| Progressive Conservative | Clarence Lavern Robins | 7,373 | 26.4 | -6.0 | ||||
| Co-operative Commonwealth | Melvin L. Swart | 4,408 | 15.8 | +0.9 | ||||
| Labor–Progressive | Frank Haslam | 721 | 2.6 | -1.4 | ||||
| Total valid votes | 27,913 | 100.0 | ||||||
| Canadian federal by-election, 16 October 1950 | ||||||||
|---|---|---|---|---|---|---|---|---|
| Party | Candidate | Votes | % | ±% | ||||
| On Mr. Mitchell's death, 1 August 1950 | ||||||||
| Liberal | William Hector McMillan | 19,553 | 48.7 | +1.4 | ||||
| Progressive Conservative | Sam Hughes | 13,031 | 32.4 | +6.0 | ||||
| Co-operative Commonwealth | Melvin L. Swart | 5,972 | 14.9 | -8.0 | ||||
| Labor–Progressive | Melbourne A. Doig | 1,616 | 4.0 | +0.6 | ||||
| Total valid votes | 40,172 | 100.0 | ||||||
| Canadian federal election, 1949 | ||||||||
|---|---|---|---|---|---|---|---|---|
| Party | Candidate | Votes | % | ±% | ||||
| Liberal | Humphrey Mitchell | 23,734 | 47.3 | +3.7 | ||||
| Progressive Conservative | Sam Hughes | 13,259 | 26.4 | -6.3 | ||||
| Co-operative Commonwealth | Armour McCrae | 11,493 | 22.9 | +6.4 | ||||
| Labor–Progressive | Melbourne A. Doig | 1,711 | 3.4 | |||||
| Total valid votes | 50,197 | 100.0 | ||||||
| Canadian federal election, 1945 | ||||||||
|---|---|---|---|---|---|---|---|---|
| Party | Candidate | Votes | % | ±% | ||||
| Liberal | Humphrey Mitchell | 19,522 | 43.6 | +1.3 | ||||
| Progressive Conservative | Thomas Oscar Oliver | 14,637 | 32.7 | |||||
| Co-operative Commonwealth | Harland Roy Potter | 7,383 | 16.5 | -5.3 | ||||
| Farmer Labour | Fern A. Sayles | 3,258 | 7.3 | |||||
| Total valid votes | 44,800 | 100.0 | ||||||
| Canadian federal by-election, 9 February 1942 | ||||||||
|---|---|---|---|---|---|---|---|---|
| Party | Candidate | Votes | % | ±% | ||||
| On Mr. Damude's death, 15 September 1941 | ||||||||
| Liberal | Humphrey Mitchell | 11,875 | 42.3 | -10.2 [8] | ||||
| Independent | J. Douglas Watt | 10,106 | 36.0 | |||||
| Co-operative Commonwealth | Mark Kriluk | 6,122 | 21.8 | +14.1 | ||||
| Total valid votes | 28,103 | 100.0 | ||||||
| Canadian federal election, 1940 | ||||||||
|---|---|---|---|---|---|---|---|---|
| Party | Candidate | Votes | % | ±% | ||||
| Liberal | Arthur B. Damude | 19,132 | 52.5 | +1.9 | ||||
| National Government | Allan Brooks | 14,491 | 39.8 | +5.1 | ||||
| Co-operative Commonwealth | Ernest Woodworth | 2,818 | 7.7 | -3.5 | ||||
| Total valid votes | 36,441 | 100.0 | ||||||
Note: "National Government" vote is compared to Conservative vote in 1935 election.
| Canadian federal election, 1935 | ||||||||
|---|---|---|---|---|---|---|---|---|
| Party | Candidate | Votes | % | ±% | ||||
| Liberal | Arthur B. Damude | 17,324 | 50.6 | +5.0 | ||||
| Conservative | Fred M. Cairns | 11,850 | 34.6 | -19.7 | ||||
| Co-operative Commonwealth | Thomas C. Daly | 3,836 | 11.2 | |||||
| Reconstruction | W. Herbert Smith | 1,200 | 3.5 | |||||
| Total valid votes | 34,210 | 100.0 | ||||||
| Canadian federal election, 1930 | ||||||||
|---|---|---|---|---|---|---|---|---|
| Party | Candidate | Votes | % | ±% | ||||
| Conservative | George Hamilton Pettit | 15,503 | 54.3 | +1.7 | ||||
| Liberal | Arthur Byron Damude | 13,037 | 45.7 | -1.7 | ||||
| Total valid votes | 28,540 | 100.0 | ||||||
| Canadian federal election, 1926 | ||||||||
|---|---|---|---|---|---|---|---|---|
| Party | Candidate | Votes | % | ±% | ||||
| Conservative | George Hamilton Pettit | 14,331 | 52.6 | -7.7 | ||||
| Liberal | William Manly German | 12,890 | 47.4 | +7.7 | ||||
| Total valid votes | 27,221 | 100.0 | ||||||
| Canadian federal election, 1925 | ||||||||
|---|---|---|---|---|---|---|---|---|
| Party | Candidate | Votes | % | ±% | ||||
| Conservative | George Hamilton Pettit | 12,753 | 60.4 | +30.3 | ||||
| Liberal | Harry Punshon Stephens | 8,373 | 39.6 | -13.3 | ||||
| Total valid votes | 21,126 | 100.0 | ||||||
| Canadian federal election, 1921 | ||||||||
|---|---|---|---|---|---|---|---|---|
| Party | Candidate | Votes | % | ±% | ||||
| Liberal | William Manly German | 11,195 | 52.9 | +13.5 | ||||
| Conservative | Evan Eugene Fraser | 6,365 | 30.1 | -15.9 | ||||
| Progressive | Joseph Henry Staley | 3,437 | 16.2 | |||||
| Independent | Henry Speakman | 156 | 0.7 | |||||
| Total valid votes | 21,153 | 100.0 | ||||||
Note: Conservative vote is compared to Government vote in 1917 election, and Liberal vote is compared to Opposition vote.
| Canadian federal election, 1917 | ||||||||
|---|---|---|---|---|---|---|---|---|
| Party | Candidate | Votes | % | |||||
| Government (Unionist) | Evan Eugene Fraser | 5,378 | 46.0 | |||||
| Opposition (Laurier Liberals) | William Manly German | 4,616 | 39.5 | |||||
| Labour | James Arthur Hughes | 1,704 | 14.6 | |||||
| Total valid votes | 11,698 | 100.0 | ||||||
| Canadian federal election, 1911 | ||||||||
|---|---|---|---|---|---|---|---|---|
| Party | Candidate | Votes | ||||||
| Liberal | William Manly German | acclaimed | ||||||
| Canadian federal election, 1908 | ||||||||
|---|---|---|---|---|---|---|---|---|
| Party | Candidate | Votes | % | ±% | ||||
| Liberal | William Manly German | 4,449 | 53.9 | -3.6 | ||||
| Conservative | George Hanan | 3,806 | 46.1 | |||||
| Total valid votes | 8,255 | 100.0 | ||||||
| Canadian federal election, 1904 | ||||||||
|---|---|---|---|---|---|---|---|---|
| Party | Candidate | Votes | % | ±% | ||||
| Liberal | William Manly German | 3,543 | 57.5 | +5.4 | ||||
| Independent Conservative | Walter Upper | 2,621 | 42.5 | |||||
| Total valid votes | 6,164 | 100.0 | ||||||
| Canadian federal election, 1900 | ||||||||
|---|---|---|---|---|---|---|---|---|
| Party | Candidate | Votes | % | ±% | ||||
| Liberal | William Manly German | 2,777 | 52.1 | +3.7 | ||||
| Conservative | William McCleary | 2,557 | 47.9 | -3.7 | ||||
| Total valid votes | 5,334 | 100.0 | ||||||
| Canadian federal election, 1896 | ||||||||
|---|---|---|---|---|---|---|---|---|
| Party | Candidate | Votes | % | ±% | ||||
| Conservative | William McCleary | 2,705 | 51.6 | +6.1 | ||||
| Liberal | James A. Lowell | 2,536 | 48.4 | -6.1 | ||||
| Total valid votes | 5,241 | 100.0 | ||||||
Note: popular vote is compared to redsult in 1891 general election.
| By-election on 29 April 1892
On Mr. German being unseated, 5 April 1892 | |||||
| Party | Candidate | Votes | |||
|---|---|---|---|---|---|
| Liberal | James A. Lowell | acclaimed | |||
| Canadian federal election, 1891 | ||||||||
|---|---|---|---|---|---|---|---|---|
| Party | Candidate | Votes | % | ±% | ||||
| Liberal | William M. German | 2,726 | 54.5 | |||||
| Conservative | John Ferguson | 2,279 | 45.5 | -6.6 | ||||
| Total valid votes | 5,005 | 100.0 | ||||||
| Canadian federal election, 1887 | ||||||||
|---|---|---|---|---|---|---|---|---|
| Party | Candidate | Votes | % | ±% | ||||
| Conservative | John Ferguson | 2,622 | 52.1 | +0.4 | ||||
| Unknown | Thos. Conlon | 2,410 | 47.9 | |||||
| Total valid votes | 5,032 | 100.0 | ||||||
| Canadian federal election, 1882 | ||||||||
|---|---|---|---|---|---|---|---|---|
| Party | Candidate | Votes | % | ±% | ||||
| Conservative | John Ferguson | 1,965 | 51.7 | +0.2 | ||||
| Unknown | B.B. Osler | 1,833 | 48.3 | |||||
| Total valid votes | 3,798 | 100.0 | ||||||
| Canadian federal election, 1878 | ||||||||
|---|---|---|---|---|---|---|---|---|
| Party | Candidate | Votes | % | ±% | ||||
| Liberal–Conservative | Christopher William Bunting | 1,926 | 51.6 | |||||
| Unknown | H. Edwin | 1,810 | 48.4 | |||||
| Total valid votes | 3,736 | 100.0 | ||||||
| Canadian federal election, 1874 | ||||||||
|---|---|---|---|---|---|---|---|---|
| Party | Candidate | Votes | % | ±% | ||||
| Liberal | William Alexander Thomson | 1,682 | 53.0 | +2.0 | ||||
| Unknown | E.W. Brookfield | 1,493 | 47.0 | |||||
| Total valid votes | 3,175 | 100.0 | ||||||
| Canadian federal by-election, 23 November 1872 | ||||||||
|---|---|---|---|---|---|---|---|---|
| Party | Candidate | Votes | % | ±% | ||||
| On Mr. Street's death, 6 August 1872 | ||||||||
| Liberal | William Alexander Thomson | 1,539 | 51.0 | |||||
| Unknown | Richard S. King | 1,480 | 49.0 | |||||
| Total valid votes | 3,019 | 100.0 | ||||||
| Canadian federal election, 1872 | ||||||||
|---|---|---|---|---|---|---|---|---|
| Party | Candidate | Votes | % | |||||
| Conservative | Thomas Clark Street | 1,590 | 60.0 | |||||
| Unknown | A.G. Hill | 1,060 | 40.0 | |||||
| Total valid votes | 2,650 | 100.0 | ||||||
| Canadian federal election, 1867 | ||||||||
|---|---|---|---|---|---|---|---|---|
| Party | Candidate | Votes | ||||||
| Conservative | Thomas Clark Street | acclaimed | ||||||
See also
References
- "(Code 35097) Census Profile". 2011 census. Statistics Canada. 2012. Retrieved 2011-03-03.
- 1867-1987 Riding history from the Library of Parliament
- 2003-2008 Riding history from the Library of Parliament
- 2011 results from Elections Canada
- Campaign expense data from Elections Canada
- ↑ Statistics Canada: 2011
- ↑ Statistics Canada: 2011
- ↑ http://www12.statcan.gc.ca/nhs-enm/2011/dp-pd/prof/details/page.cfm?Lang=E&Geo1=FED2013&Code1=35066&Data=Count&SearchText=niagara%20centre&SearchType=Begins&SearchPR=01&A1=All&B1=All&Custom=&TABID=1
- ↑ http://www12.statcan.gc.ca/nhs-enm/2011/dp-pd/prof/details/page.cfm?Lang=E&Geo1=FED2013&Code1=35066&Data=Count&SearchText=niagara%20centre&SearchType=Begins&SearchPR=01&A1=All&B1=All&Custom=&TABID=1#tabs2
- ↑ http://www.elections.ca/res/cir/maps2/mapprov.asp?map=35066
- ↑ Elections Canada – Confirmed candidates for Niagara Centre, 30 September 2015
- ↑ Elections Canada – Preliminary Election Expenses Limits for Candidates
- ↑ "Final Standings in By-Elections", Toronto Daily Star, February 10, 1942
External links
Coordinates: 43°00′32″N 79°16′48″W / 43.009°N 79.280°W
.png)