Oakville (electoral district)
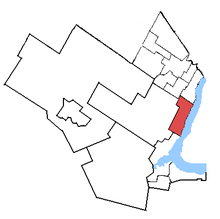 Oakville in relation to the surrounding area ridings | |||
| Federal electoral district | |||
| Legislature | House of Commons | ||
| MP |
Liberal | ||
| District created | 1996 | ||
| First contested | 1997 | ||
| Last contested | 2015 | ||
| District webpage | profile, map | ||
| Demographics | |||
| Population (2015)[1] | 182,520 | ||
| Electors (2015) | 87,670 | ||
| Area (km²)[1] | 83 | ||
| Pop. density (per km²) | 2,199 | ||
| Census divisions | Halton | ||
| Census subdivisions | Oakville | ||
Oakville is a federal electoral district in Ontario, Canada, that has been represented in the House of Commons of Canada since 1997.
History
It was created in 1996 from parts of Halton and Oakville—Milton ridings.
It consisted initially of the part of the Town of Oakville lying southeast of the Queen Elizabeth Way and Upper Middle Road.
In 2003, it was redefined to consist of the part of the Town of Oakville lying southeast of a line drawn from the northeastern town limit southwest along Dundas Street East, southeast along Eight Line and southwest along Upper Middle Road to the southwestern town limit. This riding was unchanged after the 2012 electoral redistribution.
The current boundaries include the neighbourhoods of Lakeshore Woods, Bronte, Hopedale, Coronation Park, Kerr Village, Old Oakville, Eastlake, Glen Abbey, College Park, Iroquois Ridge, Clearview, and Joshua Creek.
Members of Parliament
This riding has elected the following Member of Parliament:
| Parliament | Years | Member | Party | |
|---|---|---|---|---|
| Oakville Riding created from Halton and Oakville—Milton |
||||
| 36th | 1997–2000 | Bonnie Brown | Liberal | |
| 37th | 2000–2004 | |||
| 38th | 2004–2006 | |||
| 39th | 2006–2008 | |||
| 40th | 2008–2011 | Terence Young | Conservative | |
| 41st | 2011–2015 | |||
| 42nd | 2015–Present | John Oliver | Liberal | |
Election results
| Canadian federal election, 2015 | ||||||||
|---|---|---|---|---|---|---|---|---|
| Party | Candidate | Votes | % | ±% | Expenditures | |||
| Liberal | John Oliver | 31,967 | 49.40 | +18.67 | $101,542.36 | |||
| Conservative | Terence Young | 27,487 | 42.48 | -11.75 | $164,576.53 | |||
| New Democratic | Che Marville | 3,830 | 5.92 | -8.02 | $12,633.98 | |||
| Green | David Doel | 1,420 | 2.19 | -1.49 | $1,662.12 | |||
| Total valid votes/Expense limit | 64,704 | 100.00 | $227,734.51 | |||||
| Total rejected ballots | – | – | – | |||||
| Turnout | – | – | – | |||||
| Eligible voters | 87,670 | |||||||
| Source: Elections Canada[2][3] | ||||||||
| Canadian federal election, 2011 | ||||||||
|---|---|---|---|---|---|---|---|---|
| Party | Candidate | Votes | % | ±% | Expenditures | |||
| Conservative | Terence Young | 30,068 | 51.65 | +4.67 | ||||
| Liberal | Max Khan | 17,890 | 30.73 | -6.35 | ||||
| New Democratic | James Ede | 8,117 | 13.94 | +5.48 | ||||
| Green | Andrew Chlobowski | 2,140 | 3.68 | -4.78 | ||||
| Total valid votes/Expense limit | 58,215 | 100.00 | ||||||
| Total rejected ballots | 196 | 0.34 | -0.03 | |||||
| Turnout | 58,411 | 69.15 | – | |||||
| Eligible voters | 84,466 | – | – | |||||
| Canadian federal election, 2008 | ||||||||
|---|---|---|---|---|---|---|---|---|
| Party | Candidate | Votes | % | ±% | Expenditures | |||
| Conservative | Terence Young | 26,011 | 46.98 | +4.88 | $73,203 | |||
| Liberal | Bonnie Brown | 20,528 | 37.08 | -6.27 | $68,042 | |||
| Green | Blake Poland | 4,681 | 8.46 | +3.65 | $8,707 | |||
| New Democratic | Michelle Bilek | 4,143 | 7.48 | -2.26 | $4,973 | |||
| Total valid votes/Expense limit | 55,363 | 100.00 | $88,184 | |||||
| Total rejected ballots | 201 | 0.36 | ||||||
| Turnout | – | |||||||
| Canadian federal election, 2006 | ||||||||
|---|---|---|---|---|---|---|---|---|
| Party | Candidate | Votes | % | ±% | ||||
| Liberal | Bonnie Brown | 25,892 | 43.35 | -8.66 | ||||
| Conservative | Terence Young | 25,148 | 42.10 | +6.75 | ||||
| New Democratic | Tina Agrell | 5,815 | 9.74 | +2.45 | ||||
| Green | Laura Domsy | 2,872 | 4.81 | -0.37 | ||||
| Total valid votes | 59,727 | 100.00 | ||||||
| Canadian federal election, 2004 | ||||||||
|---|---|---|---|---|---|---|---|---|
| Party | Candidate | Votes | % | ±% | ||||
| Liberal | Bonnie Brown | 28,729 | 52.01 | +4.26 | ||||
| Conservative | Rick Byers | 19,524 | 35.35 | -12.49 | ||||
| New Democratic | Alison Myrden | 4,027 | 7.29 | +4.53 | ||||
| Green | Tania Orton | 2,861 | 5.18 | +3.53 | ||||
| Canadian Action | Zeshan Shahbaz | 95 | 0.17 | |||||
| Total valid votes | 55,236 | 100.00 | ||||||
Note: Conservative vote is compared to the total of the Canadian Alliance vote and Progressive Conservative vote in 2000 election.
| Canadian federal election, 2000 | ||||||||
|---|---|---|---|---|---|---|---|---|
| Party | Candidate | Votes | % | ±% | ||||
| Liberal | Bonnie Brown | 23,073 | 47.75 | +0.06 | ||||
| Alliance | Dan Ferrone | 13,524 | 27.99 | +10.36 | ||||
| Progressive Conservative | Rick Byers | 9,594 | 19.85 | -10.28 | ||||
| New Democratic | Willie Lambert | 1,336 | 2.76 | -1.80 | ||||
| Green | David Debelle | 795 | 1.65 | |||||
| Total valid votes | 48,322 | 100.00 | ||||||
Note: Canadian Alliance vote is compared to the Reform vote in 1997 election.
| Canadian federal election, 1997 | ||||||||
|---|---|---|---|---|---|---|---|---|
| Party | Candidate | Votes | % | |||||
| Liberal | Bonnie Brown | 24,487 | 47.68 | |||||
| Progressive Conservative | Stephen Sparling | 15,473 | 30.13 | |||||
| Reform | Wayne Gray | 9,050 | 17.62 | |||||
| New Democratic | Willie Lambert | 2,343 | 4.56 | |||||
| Total valid votes | 51,353 | 100.00 | ||||||
See also
References
- "(Code 35060) Census Profile". 2011 census. Statistics Canada. 2012. Retrieved 2011-03-03.
- Riding history from the Library of Parliament
- 2011 results from Elections Canada
- Campaign expense data from Elections Canada
.png)