Newmarket—Aurora
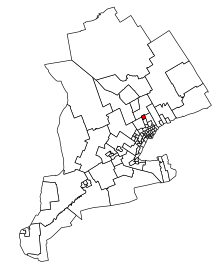 Newmarket—Aurora in relation to southern Ontario ridings | |||
| Federal electoral district | |||
| Legislature | House of Commons | ||
| MP |
Liberal | ||
| District created | 2003 | ||
| First contested | 2004 | ||
| Last contested | 2015 | ||
| District webpage | profile, map | ||
| Demographics | |||
| Population (2011)[1] | 109,457 | ||
| Electors (2015) | 83,108 | ||
| Area (km²)[2] | 62 | ||
| Pop. density (per km²) | 1,765.4 | ||
| Census divisions | York | ||
| Census subdivisions | Newmarket, Aurora, East Gwillimbury | ||
Newmarket—Aurora is a federal electoral district in Ontario, Canada, that has been represented in the House of Commons of Canada since 2004.
The district contains the towns of Newmarket, Aurora, and a very small portion of East Gwillimbury.
The riding was created for the 2004 election by merging 50% of the riding of York North with 24% of the riding of Vaughan—King—Aurora.
According to the 2006 census, 121,924 people are represented in the House of Commons in this riding.
The major industry in the riding is manufacturing, and auto parts maker Magna International is the largest manufacturer. According to the 2006 census, the average family income is $118,060 which is higher than the national average. Unemployment in the riding is lower than the national average at 3.6%. Retail trade and the service sector are also important to the economy.
Boundaries
The riding consists of that part of the Regional Municipality of York comprising the towns of Newmarket and Aurora.
Demographics
- According to the Canada 2011 Census; 2013 representation[3][4]
Ethnic groups: 78.8% White, 4.4% Chinese, 3.5% South Asian, 2.7% Southeast Asian, 2.6% Black, 1.5% Filipino, 1.3% West Asian, 1.2% Latin American
Languages: 77.2% English, 3.3% Chinese, 1.9% Italian, 1.7% French, 1.7% Russian, 1.4% Spanish, 1.1% Persian
Religions: 66.2% Christian (29.9% Catholic, 8.4% United Church, 7.7% Anglican, 3.5% Christian Orthodox, 2.7% Presbyterian, 1.7% Pentecostal, 1.6% Baptist, 10.7% Other), 2.6% Buddhist, 2.5% Muslim, 1.4% Hindu, 1.2% Jewish, 25.6% No religion
Median income (2010): $36,416
Average income (2010): $48,162
Riding associations
Riding associations are the local branches of the national political parties:
| Party | Association Name | CEO | HQ Address | HQ City | |
| Conservative | Newmarket—Aurora Conservative Association | Andrew M. Leroux | 276 Alex Doner Drive | Newmarket | |
| Liberal | Newmarket—Aurora Federal Liberal Association | William P. Chadwick | 195 Forsyth Road | Newmarket | |
| New Democratic | Newmarket—Aurora New Democratic Party Federal Riding Association | Tamara Oomen | 2-331 Botsford Street | Newmarket | |
| Green | Newmarket—Aurora Federal Green Party Association | Carter Apps | 132 Patterson Street | Newmarket | |
| Progressive Canadian | Newmarket—Aurora P.C. Party Association | Sinclair Stevens | 200-730 Davis Drive | Newmarket | |
Members of Parliament
This riding has elected the following Members of Parliament:
| Parliament | Years | Member | Party | |
|---|---|---|---|---|
| Newmarket—Aurora Riding created from York North and Vaughan—King—Aurora |
||||
| 38th | 2004–2005 | Belinda Stronach | Conservative | |
| 2005–2006 | Liberal | |||
| 39th | 2006–2008 | |||
| 40th | 2008–2011 | Lois Brown | Conservative | |
| 41st | 2011–2015 | |||
| 42nd | 2015–Present | Kyle Peterson | Liberal | |
Election results
| Canadian federal election, 2015 | ||||||||
|---|---|---|---|---|---|---|---|---|
| Party | Candidate | Votes | % | ±% | Expenditures | |||
| Liberal | Kyle Peterson | 25,508 | 45.18 | +21.47 | $84,535.55 | |||
| Conservative | Lois Brown | 24,057 | 42.61 | −11.45 | $162,456.63 | |||
| New Democratic | Yvonne Kelly | 4,806 | 8.51 | −7.28 | $26,593.85 | |||
| Green | Vanessa Long | 1,331 | 2.36 | −2.03 | $2,677.04 | |||
| Progressive Canadian | Dorian Baxter | 762 | 1.35 | $3,282.89 | ||||
| Total valid votes/Expense limit | 56,464 | 100.00 | $219,830.00 | |||||
| Total rejected ballots | 257 | 0.45 | – | |||||
| Turnout | 56,721 | 68.25 | – | |||||
| Eligible voters | 83,108 | |||||||
| Liberal gain from Conservative | Swing | +16.46 | ||||||
| Source: Elections Canada[5][6][7] | ||||||||
| 2011 federal election redistributed results[8] | |||
|---|---|---|---|
| Party | Vote | % | |
| Conservative | 25,557 | 54.05 | |
| Liberal | 11,207 | 23.70 | |
| New Democratic | 7,467 | 15.79 | |
| Green | 2,072 | 4.38 | |
| Others | 977 | 2.07 | |
| Canadian federal election, 2011 | ||||||||
|---|---|---|---|---|---|---|---|---|
| Party | Candidate | Votes | % | ±% | ||||
| Conservative | Lois Brown | 31,600 | 54.29 | +7.56 | ||||
| Liberal | Kyle Peterson | 13,908 | 23.90 | −10.39 | ||||
| New Democratic | Kassandra Bidarian | 8,886 | 15.27 | +6.80 | ||||
| Green | Vanessa Long | 2,628 | 4.52 | −3.71 | ||||
| Progressive Canadian | Dorian Baxter | 998 | 1.71 | −0.18 | ||||
| Animal Alliance | Yvonne Mackie | 182 | 0.31 | |||||
| Total valid votes | 58,202 | 100.00 | ||||||
| Total rejected ballots | 219 | 0.37 | ||||||
| Turnout | 58,421 | 64.01 | ||||||
| Eligible voters | 91,275 | |||||||
| Canadian federal election, 2008 | ||||||||
|---|---|---|---|---|---|---|---|---|
| Party | Candidate | Votes | % | ±% | ||||
| Conservative | Lois Brown | 24,873 | 46.73 | +8.68 | ||||
| Liberal | Tim Jones | 18,250 | 34.29 | −11.93 | ||||
| New Democratic | Mike Seaward | 4,508 | 8.47 | −1.12 | ||||
| Green | Glenn Hubbers | 4,381 | 8.23 | +3.46 | ||||
| Progressive Canadian | Dorian Baxter | 1,004 | 1.89 | +0.65 | ||||
| Christian Heritage | Ray Luff | 211 | 0.40 | |||||
| Canadian federal election, 2006 | ||||||||
|---|---|---|---|---|---|---|---|---|
| Party | Candidate | Votes | % | ±% | ||||
| Liberal | Belinda Stronach | 27,176 | 46.22 | +5.14 | ||||
| Conservative | Lois Brown | 22,371 | 38.05 | −4.37 | ||||
| New Democratic | Ed Chudak | 5,639 | 9.59 | −0.34 | ||||
| Green | Glenn Hubbers | 2,805 | 4.77 | +0.30 | ||||
| Progressive Canadian | Dorian Baxter | 729 | 1.24 | −0.86 | ||||
| Canadian Action | Peter Maloney | 79 | 0.13 | |||||
| Canadian federal election, 2004 | ||||||||
|---|---|---|---|---|---|---|---|---|
| Party | Candidate | Votes | % | ±% | ||||
| Conservative | Belinda Stronach | 21,818 | 42.42 | −2.43 | ||||
| Liberal | Martha Hall Findlay | 21,129 | 41.08 | −9.48 | ||||
| New Democratic | Ed Chudak | 5,111 | 9.93 | +6.18 | ||||
| Green | Daryl Wyatt | 2,298 | 4.47 | |||||
| Progressive Canadian | Dorian Baxter | 1,079 | 2.10 | – | ||||
| Total valid votes | 51,435 | 100.00 | – | |||||
| Change is from redistributed 2000 results. Conservative change is from the total of Canadian Alliance and Progressive Conservative votes. | ||||||||
See also
References
- "(Code 35053) Census Profile". 2011 census. Statistics Canada. 2012. Retrieved 2011-03-03.
- Riding history from the Library of Parliament
- 2011 results from Elections Canada
- Campaign expense data from Elections Canada
Notes
- ↑ Statistics Canada: 2011
- ↑ Statistics Canada: 2011
- ↑ http://www12.statcan.gc.ca/census-recensement/2011/dp-pd/prof/details/page.cfm?Lang=E&Geo1=FED2013&Code1=35065&Geo2=PR&Code2=35&Data=Count&SearchText=Newmarket&SearchType=Begins&SearchPR=01&B1=All&Custom=&TABID=1
- ↑ http://www12.statcan.gc.ca/nhs-enm/2011/dp-pd/prof/details/page.cfm?Lang=E&Geo1=FED2013&Code1=35065&Data=Count&SearchText=Newmarket&SearchType=Begins&SearchPR=01&A1=All&B1=All&Custom=&TABID=1
- ↑ Elections Canada – Confirmed candidates for Newmarket—Aurora, 30 September 2015
- ↑ Elections Canada – Preliminary Election Expenses Limits for Candidates
- ↑ "Election Night Results". Elections Canada. Retrieved 20 October 2015.
- ↑ Pundits' Guide to Canadian Elections
| Municipality | |
|---|---|
| Business and services | |
| Education | |
| Government |
|
| Transportation | |
| Sport | |
| |