Portsmouth South (UK Parliament constituency)
Coordinates: 50°47′13″N 1°04′44″W / 50.787°N 1.079°W
| Portsmouth South | |
|---|---|
|
Borough constituency for the House of Commons | |
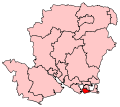 Boundary of Portsmouth South in Hampshire. | |
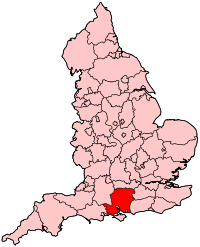 Location of Hampshire within England. | |
| County | Hampshire |
| Electorate | 71,947 (December 2010)[1] |
| Current constituency | |
| Created | 1918 |
| Member of parliament | Stephen Morgan (Labour) |
| Number of members | One |
| Created from | Portsmouth |
| Overlaps | |
| European Parliament constituency | South East England |
Portsmouth South is a constituency[n 1] represented in the House of Commons of the UK Parliament since 8 June 2017 by Stephen Morgan of the Labour Party. Morgan is the first-ever Labour MP to represent the seat.
Boundaries
1918–1950: The County Borough of Portsmouth wards of Havelock, Highland, St Paul, St Simon, and St Thomas.
1950–1955: The County Borough of Portsmouth wards of Havelock, Highland, Kingston, St Paul, St Simon, and St Thomas.
1955–1974: The County Borough of Portsmouth wards of Havelock, Highland, Kingston, St Jude, St Simon, and St Thomas.
1974–1983: The County Borough of Portsmouth wards of Buckland, Fratton, Havelock, Highland, Kingston, St Jude, St Simon, and St Thomas.
1983–2010: The City of Portsmouth wards of Charles Dickens, Fratton, Havelock, Highland, Milton, St Jude, and St Thomas.
2010–present: The City of Portsmouth wards of Central Southsea, Charles Dickens, Eastney and Craneswater, Fratton, Milton, St Jude, and St Thomas.
As its name suggests the constituency covers the southern part of the city of Portsmouth in Hampshire, including Fratton, the seaside resort of Southsea and HMNB Portsmouth (Portsmouth Naval Dockyard) within the city bounds. The northern part is represented by Portsmouth North.
History
The constituency was created in 1918 when the larger Portsmouth constituency was split into three divisions: Central, North and South. The Portsmouth Central constituency was abolished in 1950.
During the 2010 general election campaign, independent candidate Les Cummings distributed a leaflet claiming that sitting MP Mike Hancock was a paedophile, which was later proven in court to be false. Cummings was subsequently convicted under the Representation of the People Act 1983 for distributing material which was known to be false with the intention of smearing or defaming to affect the return of a Member of Parliament, and was fined £500 as a result.
Stephen Morgan won the seat at the 2017 snap general election, the first time ever that the Labour Party have held the seat. Morgan's win was one of 30 net gains made by Labour at that election.
Constituency profile
This constituency is marginally less affluent than its neighbour, with in December 2012 slightly higher unemployment, but considerably below the national average of all constituencies in terms of the claimant count.[2] Notwithstanding this following World War II the city has a large proportion of flats, increasingly in a more aesthetic apartment style, some being cheap social housing and brutalist tower blocks; however, the majority of the city is of semi-detached and terraced nature with a mixture of incomes centred around the national average[3] and excellent amenities.[4]
Members of Parliament
Elections
Elections in the 2010s
| Party | Candidate | Votes | % | ± | |
|---|---|---|---|---|---|
| Labour | Stephen Morgan | 18,290 | 41.0 | +21.5 | |
| Conservative | Flick Drummond | 16,736 | 37.6 | +2.7 | |
| Liberal Democrat | Gerald Vernon-Jackson | 7,699 | 17.3 | -5.0 | |
| UKIP | Kevan Chippindall-Higgin | 1,129 | 2.5 | -10.8 | |
| Green | Ian McCulloch[6] | 712 | 1.6 | -5.9 | |
| Majority | 1,554 | 3.5 | |||
| Turnout | 44,566 | 63.9 | +5.4 | ||
| Labour gain from Conservative | Swing | +9.4 | |||
| Party | Candidate | Votes | % | ± | |
|---|---|---|---|---|---|
| Conservative | Flick Drummond | 14,585 | 34.8 | +1.6 | |
| Liberal Democrat | Gerald Vernon-Jackson | 9,344 | 22.3 | −23.6 | |
| Labour | Sue Castillon | 8,184 | 19.5 | +5.9 | |
| UKIP | Steve Harris | 5,595 | 13.4 | +11.2 | |
| Green | Ian McCulloch | 3,145 | 7.5 | +5.8 | |
| Independent | Mike Hancock | 716 | 1.7 | N/A | |
| TUSC | Sean Hoyle | 235 | 0.6 | N/A | |
| JAC | Don Jerrard | 99 | 0.2 | 0.0 | |
| Majority | 5,241 | 12.5 | |||
| Turnout | 41,903 | 58.5 | |||
| Conservative gain from Liberal Democrat | Swing | −12.6 | |||
| Party | Candidate | Votes | % | ± | |
|---|---|---|---|---|---|
| Liberal Democrat | Michael Hancock | 18,921 | 45.9 | +4.2 | |
| Conservative | Flick Drummond | 13,721 | 33.3 | −0.4 | |
| Labour | John Ferrett | 5,640 | 13.7 | −8.7 | |
| UKIP | Robert Robinson | 876 | 2.1 | −0.2 | |
| BNP | Geoff Crompton | 873 | 2.1 | N/A | |
| Green | Tim Dawes | 716 | 1.7 | N/A | |
| English Democrat | Ian Ducain | 400 | 1.0 | N/A | |
| JAC | Les Cummings | 117 | 0.3 | N/A | |
| Majority | 5,200 | 12.6 | |||
| Turnout | 41,264 | 58.7 | +1.3 | ||
| Liberal Democrat hold | Swing | +2.3 | |||
Elections in the 2000s
| Party | Candidate | Votes | % | ± | |
|---|---|---|---|---|---|
| Liberal Democrat | Michael Hancock | 17,047 | 42.2 | −2.4 | |
| Conservative | Caroline Dinenage | 13,685 | 33.9 | +4.8 | |
| Labour | Mark Button | 8,714 | 21.6 | −2.3 | |
| UKIP | Dennis Pierson | 928 | 2.3 | +1.5 | |
| Majority | 3,362 | 8.3 | |||
| Turnout | 40,374 | 56.9 | +6.0 | ||
| Liberal Democrat hold | Swing | −3.6 | |||
| Party | Candidate | Votes | % | ± | |
|---|---|---|---|---|---|
| Liberal Democrat | Michael Hancock | 17,490 | 44.6 | +5.1 | |
| Conservative | Philip Warr | 11,396 | 29.1 | −2.1 | |
| Labour | Graham Heaney | 9,361 | 23.9 | −1.4 | |
| Socialist Alliance | Jonathan Molyneux | 647 | 1.6 | N/A | |
| UKIP | Michael Tarrant | 321 | 0.8 | +0.5 | |
| Majority | 6,094 | 15.5 | |||
| Turnout | 39,216 | 50.9 | −12.9 | ||
| Liberal Democrat hold | Swing | +3.2 | |||
Elections in the 1990s
| Party | Candidate | Votes | % | ± | |
|---|---|---|---|---|---|
| Liberal Democrat | Michael Hancock | 20,421 | 39.5 | -2.5 | |
| Conservative | David Martin | 16,094 | 31.1 | -11.4 | |
| Labour | Alan Burnett | 13,086 | 25.3 | +10.7 | |
| Referendum | Christopher Trim | 1,629 | 3.2 | N/A | |
| Liberal | John Thompson | 184 | 0.4 | N/A | |
| UKIP | Jill Evans | 141 | 0.3 | N/A | |
| Natural Law | William Trend | 140 | 0.3 | N/A | |
| Majority | 4,327 | 8.4 | |||
| Turnout | 63.8 | ||||
| Liberal Democrat gain from Conservative | Swing | +0.0 | |||
| Party | Candidate | Votes | % | ± | |
|---|---|---|---|---|---|
| Conservative | David Martin | 22,798 | 42.5 | −0.8 | |
| Liberal Democrat | Michael Hancock | 22,556 | 42.0 | −0.9 | |
| Labour | Syd Rapson | 7,857 | 14.6 | +1.7 | |
| Green | Aleksander Zivkovic | 349 | 0.7 | +0.7 | |
| Natural Law | William Trend | 91 | 0.2 | +0.2 | |
| Majority | 242 | 0.5 | +0.1 | ||
| Turnout | 53,651 | 69.1 | −2.2 | ||
| Conservative hold | Swing | +0.0 | |||
Elections in the 1980s
| Party | Candidate | Votes | % | ± | |
|---|---|---|---|---|---|
| Conservative | David Martin | 23,534 | 43.3 | −6.7 | |
| Social Democratic | Michael Hancock | 23,329 | 42.9 | +17.5 | |
| Labour | Keith Gardiner | 7,047 | 13.0 | −9.6 | |
| 657 Party | Martyn Hughes | 455 | 0.8 | N/A | |
| Majority | 205 | 0.4 | |||
| Turnout | 76,292 | 71.3 | +3.9 | ||
| Conservative gain from Social Democratic | Swing | ||||
| Party | Candidate | Votes | % | ± | |
|---|---|---|---|---|---|
| Social Democratic | Michael Hancock | 15,358 | 37.6 | +12.1 | |
| Conservative | Patrick Rock | 14,017 | 34.3 | -15.7 | |
| Labour | Sally Thomas | 10,846 | 26.5 | +4.0 | |
| National Front | Gordon Knight | 226 | 0.5 | 0.0 | |
| Ecology | Terry Mitchell | 190 | 0.5 | N/A | |
| Independent Liberal | Alan Evens | 113 | 0.3 | -0.8 | |
| Independent Ecology | Thomas Layton | 50 | 0.1 | N/A | |
| Independent | Anthony Andrews | 42 | 0.1 | N/A | |
| New National Party | Peter Smith | 41 | 0.1 | N/A | |
| Majority | 1,341 | 3.3 | -21.3 | ||
| Turnout | 54.5 | -12.8 | |||
| Social Democratic gain from Conservative | Swing | ||||
| Party | Candidate | Votes | % | ± | |
|---|---|---|---|---|---|
| Conservative | Bonner Pink | 25,101 | 50.01 | ||
| Social Democratic | Mike Hancock | 12,766 | 25.43 | ||
| Labour | Sally T Thomas | 11,324 | 22.56 | ||
| Independent Liberal | Alan J Evens | 554 | 1.10 | ||
| National Front | Gordon A Knight | 279 | 0.56 | ||
| Traditional English Food | DW Fry | 172 | 0.34 | ||
| Majority | 12,335 | 24.57 | |||
| Turnout | 67.34 | ||||
| Conservative hold | Swing | ||||
Elections in the 1970s
| Party | Candidate | Votes | % | ± | |
|---|---|---|---|---|---|
| Conservative | Bonner Pink | 26,835 | 54.67 | ||
| Labour | Sally T. Thomas | 15,306 | 31.18 | ||
| Liberal | J Wallis | 6,487 | 13.22 | ||
| National Front | W Donkin | 457 | 0.93 | ||
| Majority | 11,529 | 23.49 | |||
| Turnout | 72.88 | ||||
| Conservative hold | Swing | ||||
| Party | Candidate | Votes | % | ± | |
|---|---|---|---|---|---|
| Conservative | Bonner Pink | 23,379 | 47.61 | ||
| Labour | AM Halmos | 15,308 | 31.17 | ||
| Liberal | M Tribe | 9,807 | 19.97 | ||
| Marxist-Leninist (England) | AD Rifkin | 612 | 1.25 | ||
| Majority | 8,071 | 16.44 | |||
| Turnout | 69.39 | ||||
| Conservative hold | Swing | ||||
| Party | Candidate | Votes | % | ± | |
|---|---|---|---|---|---|
| Conservative | Bonner Pink | 26,824 | 50.26 | ||
| Labour | S Lloyd | 15,842 | 29.69 | ||
| Liberal | J Williams | 10,307 | 19.31 | ||
| Marxist-Leninist (England) | AD Rifkin | 394 | 0.74 | ||
| Majority | 10,982 | 20.58 | |||
| Turnout | 75.86 | ||||
| Conservative hold | Swing | ||||
| Party | Candidate | Votes | % | ± | |
|---|---|---|---|---|---|
| Conservative | Bonner Pink | 23,962 | 63.38 | ||
| Labour | John White | 13,847 | 36.62 | ||
| Majority | 10,115 | 26.75 | |||
| Turnout | 67.36 | ||||
| Conservative hold | Swing | ||||
Elections in the 1960s
| Party | Candidate | Votes | % | ± | |
|---|---|---|---|---|---|
| Conservative | Bonner Pink | 22,713 | 60.65 | ||
| Labour | Patten Bridge Smith | 14,738 | 39.35 | ||
| Majority | 7,975 | 21.29 | |||
| Turnout | 70.74 | ||||
| Conservative hold | Swing | ||||
| Party | Candidate | Votes | % | ± | |
|---|---|---|---|---|---|
| Conservative | Jocelyn Lucas | 24,387 | 63.69 | ||
| Labour | Richard WS Pryke | 13,904 | 36.31 | ||
| Majority | 10,483 | 27.38 | |||
| Turnout | 71.02 | ||||
| Conservative hold | Swing | ||||
Elections in the 1950s
| Party | Candidate | Votes | % | ± | |
|---|---|---|---|---|---|
| Conservative | Jocelyn Lucas | 27,892 | 69.96 | ||
| Labour | Frank Towell | 11,979 | 30.04 | ||
| Majority | 15,913 | 39.91 | |||
| Turnout | 72.33 | ||||
| Conservative hold | Swing | ||||
| Party | Candidate | Votes | % | ± | |
|---|---|---|---|---|---|
| Conservative | Jocelyn Lucas | 27,887 | 67.22 | ||
| Labour | Lawrence W Carroll | 13,600 | 32.78 | ||
| Majority | 14,287 | 34.44 | |||
| Turnout | 72.39 | ||||
| Conservative hold | Swing | ||||
| Party | Candidate | Votes | % | ± | |
|---|---|---|---|---|---|
| Conservative | Jocelyn Lucas | 30,548 | 63.78 | ||
| Labour | Douglas S Wallace | 17,350 | 36.22 | ||
| Majority | 13,198 | 27.55 | |||
| Turnout | 80.76 | ||||
| Conservative hold | Swing | ||||
| Party | Candidate | Votes | % | ± | |
|---|---|---|---|---|---|
| Conservative | Jocelyn Lucas | 31,124 | 63.95 | ||
| Labour | Leslie Charles Merrion | 17,545 | 36.05 | ||
| Majority | 13,579 | 27.90 | |||
| Turnout | 83.50 | ||||
| Conservative hold | Swing | ||||
Elections in the 1940s
| Party | Candidate | Votes | % | ± | |
|---|---|---|---|---|---|
| Conservative | Jocelyn Lucas | 15,810 | 55.29 | −19.91 | |
| Labour | J.F. Blitz | 12,783 | 44.71 | +19.91 | |
| Majority | 3,027 | 10.59 | −39.80 | ||
| Turnout | 28,593 | 74.95 | +8.01 | ||
| Registered electors | 38,150 | ||||
| Conservative hold | Swing | −19.91 | |||
Elections in the 1930s
| Party | Candidate | Votes | % | ± | |
|---|---|---|---|---|---|
| Conservative | Jocelyn Lucas | Unopposed | |||
| Conservative hold | |||||
| Party | Candidate | Votes | % | ± | |
|---|---|---|---|---|---|
| Conservative | Herbert Cayzer | 27,416 | 75.20 | −5.68 | |
| Labour | John W Fawcett | 9,043 | 24.80 | +5.68 | |
| Majority | 18,373 | 50.39 | −11.37 | ||
| Turnout | 36,459 | 66.94 | −5.78 | ||
| Registered electors | 54,463 | ||||
| Conservative hold | Swing | −5.68 | |||
| Party | Candidate | Votes | % | ± | |
|---|---|---|---|---|---|
| Conservative | Herbert Cayzer | 32,634 | 80.88 | +44.06 | |
| Labour | WJ Beck | 7,715 | 19.12 | −5.63 | |
| Majority | 24,919 | 61.76 | +49.68 | ||
| Turnout | 40,349 | 72.72 | −2.42 | ||
| Registered electors | 55,488 | ||||
| Conservative hold | Swing | +24.85 | |||
Elections in the 1920s
| Party | Candidate | Votes | % | ± | |
|---|---|---|---|---|---|
| Conservative | Herbert Cayzer | 15,068 | 36.82 | −36.14 | |
| Labour | Jessie Stephen | 10,127 | 24.75 | −2.29 | |
| Ind. Conservative | Frank Privett | 9,505 | 23.23 | N/A | |
| Liberal | Charles Rudkin | 6,214 | 15.19 | N/A | |
| Majority | 4,941 | 12.08 | −33.84 | ||
| Turnout | 40,914 | 75.14 | +0.94 | ||
| Registered electors | 54,449 | ||||
| Conservative hold | Swing | ||||
| Party | Candidate | Votes | % | ± | |
|---|---|---|---|---|---|
| Conservative | Herbert Cayzer | 22,423 | 72.96 | +17.00 | |
| Labour | Jessie Stephen | 8,310 | 27.04 | +2.17 | |
| Majority | 14,113 | 45.92 | +14.83 | ||
| Turnout | 30,733 | 74.20 | +1.48 | ||
| Registered electors | 41,417 | ||||
| Conservative hold | Swing | +7.42 | |||
| Party | Candidate | Votes | % | ± | |
|---|---|---|---|---|---|
| Conservative | Herbert Cayzer | 16,625 | 55.96 | −12.77 | |
| Labour | Jessie Stephen | 7,388 | 24.87 | N/A | |
| Liberal | S. R. Drury-Lowe | 5,698 | 19.18 | −12.09 | |
| Majority | 9,237 | 31.09 | −6.38 | ||
| Turnout | 29,711 | 72.72 | −1.94 | ||
| Registered electors | 40,854 | ||||
| Conservative hold | Swing | −18.82 | |||
| Party | Candidate | Votes | % | ± | |
|---|---|---|---|---|---|
| Conservative | Herbert Cayzer | 11,884 | 54.90 | −13.83 | |
| Liberal | Henry Merrick Lawson | 9,763 | 45.10 | N/A | |
| Majority | 2,121 | 9.80 | −17.67 | ||
| Turnout | 21,647 | 54.90 | −18.76 | ||
| Registered electors | 39,426 | ||||
| Conservative hold | Swing | N/A | |||
| Party | Candidate | Votes | % | ± | |
|---|---|---|---|---|---|
| Conservative | Leslie Orme Wilson | 14,301 | 62.90 | −5.83 | |
| Ind. Conservative | GC Thomas | 8,434 | 37.10 | N/A | |
| Majority | 5,867 | 25.81 | −11.66 | ||
| Turnout | 22,735 | 57.66 | −16.00 | ||
| Registered electors | 39,426 | ||||
| Conservative hold | Swing | N/A | |||
| Party | Candidate | Votes | % | ± | |
|---|---|---|---|---|---|
| Conservative | Herbert Cayzer | 19,960 | 68.73 | +0.43 | |
| Liberal | Henry Merrick Lawson | 9,080 | 31.27 | +12.80 | |
| Majority | 10,880 | 37.47 | −12.36 | ||
| Turnout | 29,040 | 73.66 | +11.69 | ||
| Registered electors | 39,426 | ||||
| Conservative hold | Swing | −6.19 | |||
Elections in the 1910s
| Party | Candidate | Votes | % | ± | |
|---|---|---|---|---|---|
| C | Unionist | Herbert Cayzer | 15,842 | 68.30 | N/A |
| Liberal | Alison Vickers Garland | 4,283 | 18.47 | N/A | |
| Labour | James Lacey | 3,070 | 13.24 | N/A | |
| Majority | 11,559 | 49.83 | N/A | ||
| Turnout | 23,195 | 61.97 | N/A | ||
| Registered electors | 37,427 | ||||
| Unionist win (new seat) | |||||
| C indicates candidate endorsed by the coalition government. | |||||
See also
Notes and references
Notes
- ↑ A borough constituency (for the purposes of election expenses and type of returning officer)
- ↑ Results compared to the 1935 General Election, not the 1939 by-election
- ↑ Results compared to the 1922 General Election, not the 1922 or the 1923 by-elections
- ↑ Results compared to the 1922 General Election, not the 1922 by-election
References
- ↑ "Electorate Figures – Boundary Commission for England". 2011 Electorate Figures. Boundary Commission for England. 4 March 2011. Archived from the original on 6 November 2010. Retrieved 13 March 2011.
- ↑ Unemployment claimants by constituency The Guardian
- ↑ "Local statistics - Office for National Statistics". neighbourhood.statistics.gov.uk.
- ↑ "2011 census interactive maps". ons.gov.uk. Archived from the original on 29 January 2016.
- ↑ Leigh Rayment's Historical List of MPs – Constituencies beginning with "P" (part 2)
- ↑ "Portsmouth Green Party Candidates 2017". portsmouth.greenparty.org.uk.
- ↑ "Election Data 2015". Electoral Calculus. Archived from the original on 17 October 2015. Retrieved 17 October 2015.
- ↑ "Portsmouth MP Mike Hancock to stand in 2015 general election". 29 March 2015 – via www.bbc.co.uk.
- ↑ "Election Data 2010". Electoral Calculus. Archived from the original on 26 July 2013. Retrieved 17 October 2015.
- ↑ "Politics". the Guardian.
- ↑ "Election Data 2005". Electoral Calculus. Archived from the original on 15 October 2011. Retrieved 18 October 2015.
- ↑ "Election Data 2001". Electoral Calculus. Archived from the original on 15 October 2011. Retrieved 18 October 2015.
- ↑ "Election Data 1997". Electoral Calculus. Archived from the original on 15 October 2011. Retrieved 18 October 2015.
- ↑ "Politics Resources". Election 1992. Politics Resources. Retrieved 6 December 2010.
- ↑ "Election Data 1992". Electoral Calculus. Archived from the original on 15 October 2011. Retrieved 18 October 2015.
- ↑ "Politics Resources". Election 1992. Politics Resources. 9 April 1992. Retrieved 6 December 2010.
- ↑ "Election Data 1987". Electoral Calculus. Archived from the original on 15 October 2011. Retrieved 18 October 2015.
- ↑ "Election Data 1983". Electoral Calculus. Archived from the original on 15 October 2011. Retrieved 18 October 2015.
- ↑
- ↑
- ↑
- ↑
- 1 2 3 4 5 6 7 8 9 10 11 Craig, F.W.S., ed. (1969). British parliamentary election results 1918–1949. Glasgow: Political Reference Publications. ISBN 0-900178-01-9.