Manchester City Council election, 2018
 | ||||||||||||||||||||||||||||||||||
All 96 seats to Manchester City Council 48 seats needed for a majority | ||||||||||||||||||||||||||||||||||
|---|---|---|---|---|---|---|---|---|---|---|---|---|---|---|---|---|---|---|---|---|---|---|---|---|---|---|---|---|---|---|---|---|---|---|
| ||||||||||||||||||||||||||||||||||
| ||||||||||||||||||||||||||||||||||
Elections to Manchester City Council were held on 3 May 2018, as part of the United Kingdom local elections, 2018. Although the council is normally elected in thirds, all 96 council seats were up for election due to boundary changes.[1] Labour retained its near-complete dominance of the council. The sole change was that the Liberal Democrats gained a second seat in Didsbury West.
Background and Campaign
From 2014 to 2016, Labour were the only party represented on the council. In 2016, former MP John Leech won a seat in Didsbury West and sat as the only opposition councillor for two years.
On 9 April 2018, it was reported that the Labour Party had received formal complaints about Chris Paul, Labour councillor for Withington since 2011. There were social media comments describing women as “cows”, “slobs” and “bitches”, and inciting violence against women. [2] Greater Manchester Police, The Labour Party and Manchester City Council all launched investigations and Paul eventually apologised. Paul was re-elected in Withington ward with a reduced majority beating Lib Dem candidate April Preston.[3][4]
Following reports of a last-minute search for eligibile candidates,[5] the Manchester Conservative Party announced on 10 April, it would be fielding three candidates in all 32 wards within the city.
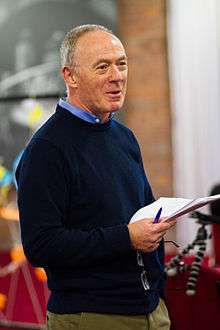
John Leech launched the Liberal Democrats 'Manchester Together' campaign. [6]
Result
| Manchester City Council | |||||||||||||||
|---|---|---|---|---|---|---|---|---|---|---|---|---|---|---|---|
| Party | Candidates | Votes | |||||||||||||
| Stood | Elected | Gained | Unseated | Net | % of total | % | № | Net % | |||||||
| Labour | 96 | 94 | 0 | 1 | –1 | 97.9 | 70.2 | 189,401 | +6.1 | ||||||
| Liberal Democrat | 76 | 2 | 1 | 0 | +1 | 2.1 | 12.8 | 34,573 | +1.7 | ||||||
| Conservative | 96 | 0 | 0 | 0 | 0 | 0 | 9.3 | 25,158 | +2.3 | ||||||
| Green | 38 | 0 | 0 | 0 | 0 | 0 | 6.4 | 17,402 | –2.5 | ||||||
| Independent | 6 | 0 | 0 | 0 | 0 | 0 | 0.4 | 1,126 | –1.1 | ||||||
| UKIP | 4 | 0 | 0 | 0 | 0 | 0 | 0.3 | 736 | –5.9 | ||||||
| Women's Equality | 2 | 0 | 0 | 0 | 0 | 0 | 0.2 | 629 | NA | ||||||
| No description | 1 | 0 | 0 | 0 | 0 | 0 | 0.2 | 603 | NA | ||||||
| TUSC | 3 | 0 | 0 | 0 | 0 | 0 | 0.1 | 337 | –0.8 | ||||||
| Communist League | 1 | 0 | 0 | 0 | 0 | 0 | 0.0 | 19 | 0 | ||||||
Council Composition
Prior to the election, the composition of the council was:
| 95 | 1 |
| Labour | LD |
After the election, the composition of the council is:
| 94 | 2 |
| Labour | LD |
Ward Results
Asterisks denote incumbent Councillors seeking re-election. All results are listed below:[7]
Ancoats and Beswick
| Party | Candidate | Votes | % | ± | |
|---|---|---|---|---|---|
| Labour | Rosa Battle* | 1,475 | 72.0% | ||
| Labour | Emma Taylor* | 1,272 | 62.1% | ||
| Labour | Mohammed Dar | 1,152 | 56.2% | ||
| Green | Eliza Tyrrell | 345 | 16.8% | ||
| Conservative | Michael Barnes | 253 | 12.3% | ||
| Liberal Democrat | Christopher Wilkinson | 233 | 11.4% | ||
| Conservative | Barney Watson | 223 | 10.9% | ||
| Conservative | Adam Williams | 189 | 9.2% | ||
| Liberal Democrat | Lynne Williams | 169 | 8.2% | ||
| Liberal Democrat | Simon Lepori | 157 | 7.7% | ||
| Majority | |||||
| Turnout | 2,049 | 21% | |||
| Labour win (new seat) | |||||
| Labour win (new seat) | |||||
| Labour win (new seat) | |||||
Ardwick
| Party | Candidate | Votes | % | ± | |
|---|---|---|---|---|---|
| Labour | Tina Hewitson* | 2,012 | 72.0% | ||
| Labour | Bernard Priest* | 1,821 | 67.9% | ||
| Labour | Mavis Smitheman* | 1,703 | 63.5% | ||
| Green | Samantha Goodchild | 329 | 12.3% | ||
| Conservative | Rebecca Thompson | 229 | 8.5% | ||
| Conservative | Shahzadi Begum | 173 | 6.4% | ||
| Conservative | Sarah-Jane Trelfa | 165 | 6.1% | ||
| Liberal Democrat | Beth Waller | 163 | 6.1% | ||
| Majority | |||||
| Turnout | 2,683 | 20.3% | |||
| Labour hold | Swing | ||||
| Labour hold | Swing | ||||
| Labour hold | Swing | ||||
Baguley
| Party | Candidate | Votes | % | ± | |
|---|---|---|---|---|---|
| Labour | Paul Andrews* | 1,485 | 68.0% | ||
| Labour | Tracey Rawlins* | 1,281 | 58.7% | ||
| Labour | Luke Raikes* | 1,095 | 50.2% | ||
| Conservative | Ralph Ellerton | 450 | 20.6% | ||
| Conservative | Jagdeep Mehat | 314 | 14.4% | ||
| Conservative | Manjit Mehat | 275 | 12.6% | ||
| Green | Sarah Mander | 224 | 10.3% | ||
| Liberal Democrat | Matt Downey | 128 | 5.9% | ||
| Liberal Democrat | Eleanor Nagle | 113 | 5.2% | ||
| Liberal Democrat | Theo Penn | 82 | 3.8% | ||
| Majority | |||||
| Turnout | 2,183 | 19.6% | |||
| Labour hold | Swing | ||||
| Labour hold | Swing | ||||
| Labour hold | Swing | ||||
Brooklands
| Party | Candidate | Votes | % | ± | |
|---|---|---|---|---|---|
| Labour | Sue Cooley* | 1,684 | 59.7% | ||
| Labour | Glynn Evans* | 1,635 | 58.0% | ||
| Labour | Sue Murphy* | 1,456 | 51.6% | ||
| Conservative | Stephen Carlton-Woods | 763 | 27.0% | ||
| Conservative | Stephen McHugh | 705 | 25.0% | ||
| Conservative | David Semple | 634 | 22.5% | ||
| Green | Robert Nunney | 313 | 11.1% | ||
| Liberal Democrat | Paul Jones | 153 | 5.4% | ||
| Liberal Democrat | Norman Lewis | 134 | 4.8% | ||
| Liberal Democrat | Bernie Ryan | 117 | 4.1% | ||
| Majority | |||||
| Turnout | 2,821 | 25.1% | |||
| Labour hold | Swing | ||||
| Labour hold | Swing | ||||
| Labour hold | Swing | ||||
Burnage
| Party | Candidate | Votes | % | ± | |
|---|---|---|---|---|---|
| Labour | Ben Clay | 2,913 | 69.5% | ||
| Labour | Bev Craig* | 2,853 | 68.1% | ||
| Labour | Azra Ali* | 2,652 | 63.3% | ||
| Liberal Democrat | Andrea Timoney | 747 | 17.8% | ||
| Liberal Democrat | Maria Turner | 541 | 12.9% | ||
| Liberal Democrat | Mohamed Sabbagh | 457 | 10.9% | ||
| Green | Lance Crookes | 442 | 10.5% | ||
| Conservative | Samuel Baxter | 291 | 6.9% | ||
| Conservative | Lexi Webster | 241 | 5.8% | ||
| Conservative | Shahed Hossain | 234 | 5.6% | ||
| Majority | |||||
| Turnout | 4,191 | 32.6% | |||
| Labour hold | Swing | ||||
| Labour hold | Swing | ||||
| Labour hold | Swing | ||||
Charlestown
| Party | Candidate | Votes | % | ± | |
|---|---|---|---|---|---|
| Labour | Veronica Kirkpatrick* | 1,769 | |||
| Labour | Hannah Priest* | 1,541 | |||
| Labour | Basil Curley* | 1,531 | |||
| Independent | Anthony Brennan | 489 | |||
| Conservative | Peter Schofield | 433 | |||
| Conservative | Daniel Somers | 358 | |||
| Conservative | Michael Shupac | 326 | |||
| Green | Astrid Johnson | 271 | |||
| Liberal Democrat | Charles Turner | 172 | |||
| Majority | |||||
| Turnout | 2,732 | 23.1% | |||
| Labour hold | Swing | ||||
| Labour hold | Swing | ||||
| Labour hold | Swing | ||||
Cheetham
| Party | Candidate | Votes | % | ± | |
|---|---|---|---|---|---|
| Labour | Naeem-Ul Hassan* | 2,943 | 75.0% | ||
| Labour | Shaukat Ali* | 2,755 | 70.2% | ||
| Labour | Julie Connolly* | 2,613 | 66.6% | ||
| Green | Dave Taylor | 271 | 6.9% | ||
| Conservative | Pamela Goldfine | 215 | 5.5% | ||
| Liberal Democrat | Paul Crane | 202 | 5.1% | ||
| Conservative | Hannah Levy | 186 | 4.7% | ||
| Conservative | Charalampos Kagkouras | 132 | 3.4% | ||
| Majority | |||||
| Turnout | 3,926 | 31.7% | |||
| Labour hold | Swing | ||||
| Labour hold | Swing | ||||
| Labour hold | Swing | ||||
Chorlton
| Party | Candidate | Votes | % | ± | |
|---|---|---|---|---|---|
| Labour | John Hacking* | 3,175 | 64.1% | ||
| Labour | Eve Holt | 3,165 | 63.9% | ||
| Labour | Matt Strong* | 2,974 | 60.0% | ||
| Green | Nigel Woodcock | 731 | 14.8% | ||
| Green | Mary Crumpton | 728 | 14.7% | ||
| Green | Anne Power | 653 | 13.2% | ||
| Liberal Democrat | Lizzy Bain | 614 | 12.4% | ||
| Liberal Democrat | Joanne Milligan | 507 | 10.2% | ||
| Women's Equality | Jo Heathcote | 465 | 9.4% | ||
| Liberal Democrat | Rhona Brown | 463 | 9.3% | ||
| Conservative | Luke Berry | 301 | 6.1% | ||
| Conservative | Luke Costello | 242 | 4.9% | ||
| Conservative | John Edwards | 221 | 4.5% | ||
| Independent | Michael Elston | 145 | 2.9% | ||
| Majority | |||||
| Turnout | 4,955 | 46.3% | |||
| Labour hold | Swing | ||||
| Labour hold | Swing | ||||
| Labour hold | Swing | ||||
Chorlton Park
| Party | Candidate | Votes | % | ± | |
|---|---|---|---|---|---|
| Labour | Joanna Midgley* | 3,404 | 63.5% | ||
| Labour | Mandie Shilton-Godwin* | 3,027 | 56.5% | ||
| Labour | Dave Rawson* | 2,967 | 55.3% | ||
| Liberal Democrat | Rosie Hughes | 1,363 | 25.4% | ||
| Liberal Democrat | Amaan Hashmi | 1,238 | 23.1% | ||
| Liberal Democrat | Sebastian Bate | 1,234 | 23.0% | ||
| Green | Mary Candeland | 669 | 12.5% | ||
| Green | Brian Candeland | 530 | 9.9% | ||
| Conservative | Keith Berry | 255 | 4.8% | ||
| Conservative | Kelly Geddes | 197 | 3.7% | ||
| Conservative | Andrew Tang | 155 | 2.9% | ||
| Majority | |||||
| Turnout | 5,362 | 41.3% | |||
| Labour hold | Swing | ||||
| Labour hold | Swing | ||||
| Labour hold | Swing | ||||
Clayton and Openshaw
| Party | Candidate | Votes | % | ± | |
|---|---|---|---|---|---|
| Labour | Andy Harland | 2,103 | |||
| Labour | Donna Ludford* | 1,722 | |||
| Labour | Sean McHale | 1,592 | |||
| Independent | Kenneth Dobson | 603 | |||
| Liberal Democrat | Elaine Boyes | 279 | |||
| Green | Paul Brunger | 220 | |||
| Conservative | Archie Galbraith | 217 | |||
| Liberal Democrat | Richard Clayton | 162 | |||
| Conservative | Aimen Javaid | 152 | |||
| Conservative | Chenjie Zhang | 142 | |||
| Liberal Democrat | Dan Willis | 118 | |||
| Turnout | 2,967 | 24.9% | |||
| Labour win (new seat) | |||||
| Labour win (new seat) | |||||
| Labour win (new seat) | |||||
Crumpsall
| Party | Candidate | Votes | % | ± | |
|---|---|---|---|---|---|
| Labour | Richard Leese* | 2,783 | |||
| Labour | Nasrin Ali | 2,644 | |||
| Labour | Fiaz Riasat | 2,517 | |||
| Conservative | Sham Akhtar | 399 | |||
| Conservative | Mohammad Malik | 303 | |||
| Green | Penny Swann | 298 | |||
| Conservative | Shun Wah Tang | 263 | |||
| Liberal Democrat | Sarah Brown | 206 | |||
| UKIP | Mark Davies | 148 | |||
| Independent | Peter Rowe | 138 | |||
| TUSC | Grace Donaghey | 104 | |||
| Majority | |||||
| Turnout | 3,768 | 34% | |||
| Labour hold | Swing | ||||
| Labour hold | Swing | ||||
| Labour hold | Swing | ||||
Deansgate
| Party | Candidate | Votes | % | ± | |
|---|---|---|---|---|---|
| Labour | Joan Davies* | 782 | 53% | ||
| Labour | Marcus Johns | 604 | 41% | ||
| Labour | William Jeavons | 570 | 39% | ||
| Liberal Democrat | John Bridges | 362 | 25% | ||
| Liberal Democrat | Gary McKenna | 311 | 21% | ||
| Green | Christopher Ogden | 308 | 21% | ||
| Liberal Democrat | George Rice | 285 | 19% | ||
| Conservative | Russ George | 196 | 13% | ||
| Conservative | Lee Evans | 185 | 13% | ||
| Independent | Nick Buckley | 164 | 11% | ||
| Women's Equality | Sam Johnson | 164 | 11% | ||
| Conservative | Charles Latchford | 151 | 10% | ||
| Independent | Giles Grover | 99 | 7% | ||
| Majority | |||||
| Turnout | 1,468 | 19.38% | |||
| Labour win (new seat) | |||||
| Labour win (new seat) | |||||
| Labour win (new seat) | |||||
Didsbury East
| Party | Candidate | Votes | % | ± | |
|---|---|---|---|---|---|
| Labour | Andrew Simcock* | 2,549 | 51.9% | ||
| Labour | Kelly Simcock* | 2,440 | 49.7% | ||
| Labour | James Wilson* | 2,268 | 46.2% | ||
| Liberal Democrat | Bryn Coombe | 1,729 | 35.2% | ||
| Liberal Democrat | Dominic Hardwick | 1,728 | 35.2% | ||
| Liberal Democrat | John Cameron | 1,710 | 34.8% | ||
| Green | Wendy Lynas | 524 | 10.7% | ||
| Conservative | James Flanagan | 368 | 7.5% | ||
| Conservative | Ian Mason | 300 | 6.1% | ||
| Conservative | Phelim Rowe | 274 | 5.6% | ||
| Majority | |||||
| Turnout | 4,909 | 43.6% | |||
| Labour hold | Swing | ||||
| Labour hold | Swing | ||||
| Labour hold | Swing | ||||
Didsbury West
| Party | Candidate | Votes | % | ± | |
|---|---|---|---|---|---|
| Liberal Democrat | John Leech* | 2,524 | 55.2% | +14% | |
| Liberal Democrat | Richard Kilpatrick | 1,994 | 43.6% | +7.5% | |
| Labour | David Ellison* | 1,899 | 41.5% | -6.5% | |
| Liberal Democrat | Greg Stanton | 1,878 | 41.1% | +1.1% | |
| Labour | Laura Wright | 1,781 | 39.0% | ||
| Labour | Peter Cookson | 1,567 | 34.3% | ||
| Green | Arnold Spencer | 587 | 12.8% | ||
| Conservative | Connor Walsh | 275 | 6.0% | ||
| Conservative | Thomas Beach | 271 | 5.9% | ||
| Conservative | Xin Shi | 206 | 4.5% | ||
| Majority | |||||
| Turnout | 4,571 | 38.5% | |||
| Liberal Democrat hold | Swing | ||||
| Liberal Democrat gain from Labour | Swing | ||||
| Labour hold | Swing | ||||
- Leech's win in 2016 signified the first gain for any party in Manchester other than Labour for the first time in six years and provided Manchester with its first opposition for two years. After the 2018 election he was selected as Leader of the Opposition.
Fallowfield
| Party | Candidate | Votes | % | ± | |
|---|---|---|---|---|---|
| Labour | Grace Fletcher-Hackwood* | 1,627 | 74.1% | ||
| Labour | Zahra Alijah* | 1,608 | 73.3% | ||
| Labour | Ali Ilyas* | 1,366 | 62.2% | ||
| Green | Adrian Thompson | 363 | 16.5% | ||
| Liberal Democrat | Robin Grayson | 213 | 9.7% | ||
| Liberal Democrat | Gemma Kilday | 162 | 7.4% | ||
| Liberal Democrat | Jem Arpa | 159 | 7.2% | ||
| Conservative | Nathan Denham | 147 | 6.7% | ||
| Conservative | Rory Tinker | 130 | 5.9% | ||
| Conservative | Adam Goldfine | 118 | 5.4% | ||
| Majority | |||||
| Turnout | 2,195 | 17% | |||
| Labour hold | Swing | ||||
| Labour hold | Swing | ||||
| Labour hold | Swing | ||||
Gorton and Abbey Hey
| Party | Candidate | Votes | % | ± | |
|---|---|---|---|---|---|
| Labour | Louis Hughes* | 1,849 | 59.92% | ||
| Labour | Julie Reid* | 1,771 | 57.39% | ||
| Labour | Afia Kamal* | 1,523 | 49.35% | ||
| Liberal Democrat | Jackie Pearcey | 730 | 23.66% | ||
| Liberal Democrat | Iain Donaldson | 526 | 17.04% | ||
| Liberal Democrat | Tim Bannister | 385 | 12.48% | ||
| Conservative | Paul Mostyn | 342 | 11.08% | ||
| Conservative | Michael Street | 308 | 9.98% | ||
| Conservative | Melissa Jackson | 271 | 8.78% | ||
| Green | Melvyn Newton | 241 | 7.81% | ||
| Rejected ballots | 13 (full) 1 (partial) |
||||
| Turnout | 3,086 | 24% | |||
| Registered electors | 12857 | ||||
| Labour win (new seat) | |||||
| Labour win (new seat) | |||||
| Labour win (new seat) | |||||
Harpurhey
| Party | Candidate | Votes | % | ± | |
|---|---|---|---|---|---|
| Labour | Sandra Collins* | 1,773 | |||
| Labour | Joanne Green* | 1,656 | |||
| Labour | Pat Karney* | 1,464 | |||
| Conservative | Gareth Brown | 408 | |||
| Conservative | Jodie Goldfine | 329 | |||
| Green | Vicky Matthews | 285 | |||
| Conservative | Ivor Levy | 279 | |||
| TUSC | Jack Metcalf | 118 | |||
| Majority | |||||
| Turnout | 2,481 | 20.1% | |||
| Labour hold | Swing | ||||
| Labour hold | Swing | ||||
| Labour hold | Swing | ||||
Higher Blackley
| Party | Candidate | Votes | % | ± | |
|---|---|---|---|---|---|
| Labour | John Farrell* | 1,811 | |||
| Labour | Shelley Lanchbury* | 1,591 | |||
| Labour | Paula Sadler* | 1,570 | |||
| Conservative | Bernard Goldfine | 449 | |||
| Conservative | Nicholas Grimshaw | 383 | |||
| Conservative | Alexandru Stancu | 278 | |||
| Green | David Halligan | 276 | |||
| Liberal Democrat | Peter Matthews | 274 | |||
| Majority | |||||
| Turnout | 2,564 | 22.7% | |||
| Labour hold | Swing | ||||
| Labour hold | Swing | ||||
| Labour hold | Swing | ||||
Hulme
| Party | Candidate | Votes | % | ± | |
|---|---|---|---|---|---|
| Labour | Lee-Ann Igbon* | 1,913 | |||
| Labour | Nigel Murphy* | 1,731 | |||
| Labour | Annette Wright | 1,638 | |||
| Green | Melanie Horrocks | 521 | |||
| Green | Dave James | 413 | |||
| Conservative | Timothy Dawson | 182 | |||
| Liberal Democrat | Richard Gadsen | 180 | |||
| Liberal Democrat | James Ross | 180 | |||
| Liberal Democrat | Thomas Mitchell | 165 | |||
| Conservative | Phillip Page | 152 | |||
| Conservative | Thomas Paterson | 135 | |||
| Majority | |||||
| Turnout | 2,653 | 22.3% | |||
| Labour hold | Swing | ||||
| Labour hold | Swing | ||||
| Labour hold | Swing | ||||
Levenshulme
| Party | Candidate | Votes | % | ± | |
|---|---|---|---|---|---|
| Labour | Dzidra Noor* | 3,031 | |||
| Labour | Bernard Stone* | 2,995 | |||
| Labour | Basat Sheikh* | 2,745 | |||
| Green | Ieuan Hall | 779 | |||
| Liberal Democrat | Charles Glover | 558 | |||
| Liberal Democrat | Mark Saunders | 319 | |||
| Liberal Democrat | Nicholas Saunders | 239 | |||
| Conservative | Lawrence Rosenberg | 187 | |||
| UKIP | Bob Catterall | 161 | |||
| Conservative | James Smith | 138 | |||
| Conservative | Elisheva Walker | 106 | |||
| Majority | |||||
| Turnout | 4,213 | 34% | |||
| Labour hold | Swing | ||||
| Labour hold | Swing | ||||
| Labour hold | Swing | ||||
Longsight
| Party | Candidate | Votes | % | ± | |
|---|---|---|---|---|---|
| Labour | Abid Chohan* | 2,821 | |||
| Labour | Luthfur Rahman* | 2,655 | |||
| Labour | Suzanne Richards* | 2,590 | |||
| Green | Bernard Ekbery | 201 | |||
| Conservative | Javaid Hussain | 197 | |||
| Conservative | Mark Shaw | 172 | |||
| Liberal Democrat | Andrew Hickey | 156 | |||
| Conservative | Joshua Phillips | 150 | |||
| Liberal Democrat | Katie McKellar | 132 | |||
| UKIP | Katie Fanning | 130 | |||
| Liberal Democrat | Philip Stubbs | 101 | |||
| Communist League | Catharina Tirsen | 19 | |||
| Majority | |||||
| Turnout | 3,573 | 29% | |||
| Labour hold | Swing | ||||
| Labour hold | Swing | ||||
| Labour hold | Swing | ||||
Miles Platting and Newton Heath
| Party | Candidate | Votes | % | ± | |
|---|---|---|---|---|---|
| Labour | Carmine Grimshaw* | 1,969 | |||
| Labour | June Hitchen* | 1,953 | |||
| Labour | John Flanaghan* | 1,769 | |||
| UKIP | Martin Power | 297 | |||
| Conservative | Beverley Cottrell | 276 | |||
| Green | Paul Madley | 268 | |||
| Conservative | Vera Berry | 250 | |||
| Conservative | Jacqueline Mountaine | 212 | |||
| TUSC | Bridget Taylor | 115 | |||
| Majority | |||||
| Turnout | 2,794 | 22.4% | |||
| Labour hold | Swing | ||||
| Labour hold | Swing | ||||
| Labour hold | Swing | ||||
Moss Side
| Party | Candidate | Votes | % | ± | |
|---|---|---|---|---|---|
| Labour | Sameem Ali* | 2,578 | |||
| Labour | Emily Rowles* | 2,538 | |||
| Labour | Mahadi Mahamed* | 2,462 | |||
| Green | Kirstine Pearson | 376 | |||
| Liberal Democrat | Maria Guillermo | 190 | |||
| Liberal Democrat | Christopher Kane | 167 | |||
| Conservative | Mark Dippnall | 165 | |||
| Conservative | Shazia Riaz | 98 | |||
| Conservative | Aref Goojani | 89 | |||
| Majority | |||||
| Turnout | 3,586 | 27.9% | |||
| Labour hold | Swing | ||||
| Labour hold | Swing | ||||
| Labour hold | Swing | ||||
Moston
| Party | Candidate | Votes | % | ± | |
|---|---|---|---|---|---|
| Labour | Paula Appleby* | 2,407 | 72.1% | ||
| Labour | Carl Ollerhead* | 1,938 | 58.0% | ||
| Labour | Yasmine Dar* | 1,889 | 56.6% | ||
| Conservative | John Boase | 718 | 21.5% | ||
| Conservative | Callum Goodier | 656 | 19.6% | ||
| Conservative | Gary Wilkinson | 616 | 18.4% | ||
| Green | Eithne Quinn | 405 | 12.1% | ||
| Majority | |||||
| Turnout | 3,340 | 26% | |||
| Labour hold | Swing | ||||
| Labour hold | Swing | ||||
| Labour hold | Swing | ||||
Northenden
| Party | Candidate | Votes | % | ± | |
|---|---|---|---|---|---|
| Labour | Mary Monaghan* | 1,803 | 66.2% | ||
| Labour | Sam Lynch | 1,694 | 62.2% | ||
| Labour | Sarah Russell* | 1,535 | 56.4% | ||
| Conservative | Nigel Geddes | 494 | 18.1% | ||
| Conservative | Ezra McGowan | 492 | 18.1% | ||
| Green | Simon Gray | 407 | 14.9% | ||
| Conservative | Nathan Cruddas | 401 | 14.7% | ||
| Liberal Democrat | Maria Storey | 181 | 6.6% | ||
| Liberal Democrat | Simon Kirkham | 173 | 6.4% | ||
| Liberal Democrat | Paul Waide | 134 | 4.9% | ||
| Independent | A-Lot Oink | 91 | 3.3% | ||
| Majority | |||||
| Turnout | 2,723 | 25.1% | |||
| Labour hold | Swing | ||||
| Labour hold | Swing | ||||
| Labour hold | Swing | ||||
Old Moat
| Party | Candidate | Votes | % | ± | |
|---|---|---|---|---|---|
| Labour | Suzannah Reeves* | 2,165 | |||
| Labour | Gavin White | 2,086 | |||
| Labour | Garry Bridges* | 2,071 | |||
| Green | Bonnie Boulton | 502 | |||
| Liberal Democrat | Jon Martin | 425 | |||
| Liberal Democrat | Brigitte Sapriel | 363 | |||
| Liberal Democrat | Andrew McGuinness | 359 | |||
| Conservative | Luke Dyks | 191 | |||
| Conservative | Nicola Dixon | 181 | |||
| Conservative | Michael Lister-Geddes | 179 | |||
| Majority | |||||
| Turnout | 3,030 | 27.8% | |||
| Labour hold | Swing | ||||
| Labour hold | Swing | ||||
| Labour hold | Swing | ||||
Piccadilly
| Party | Candidate | Votes | % | ± | |
|---|---|---|---|---|---|
| Labour | Adele Douglas | 925 | 61% | ||
| Labour | Jon-Connor Lyons | 875 | 58% | ||
| Labour | Sam Wheeler | 793 | 53% | ||
| Green | Kara Ng | 368 | 24% | ||
| Liberal Democrat | Martin Browne | 348 | 23% | ||
| Liberal Democrat | Joe Lynch | 334 | 22% | ||
| Liberal Democrat | Matthew Varnam | 250 | 17% | ||
| Conservative | Paul Wan | 140 | 9% | ||
| Conservative | Victoria Williams | 124 | 8% | ||
| Conservative | Levi Walker | 115 | 8% | ||
| Majority | |||||
| Turnout | 1,510 | 20% | |||
| Labour win (new seat) | |||||
| Labour win (new seat) | |||||
| Labour win (new seat) | |||||
Rusholme
| Party | Candidate | Votes | % | ± | |
|---|---|---|---|---|---|
| Labour | Rabnawaz Akbar* | 2,484 | |||
| Labour | Jill Lovecy* | 2,433 | |||
| Labour | Ahmed Ali* | 2,416 | |||
| Green | George Salomon | 416 | |||
| Liberal Democrat | Holly Matthies | 269 | |||
| Liberal Democrat | Abu Chowdhury | 263 | |||
| Liberal Democrat | Dave Page | 237 | |||
| Conservative | Mehreen Qazi | 161 | |||
| Conservative | Amir Moore | 142 | |||
| Conservative | Roozbeh Sarkohaki | 96 | |||
| Majority | |||||
| Turnout | 3,341 | 27.2% | |||
| Labour hold | Swing | ||||
| Labour hold | Swing | ||||
| Labour hold | Swing | ||||
Sharston
| Party | Candidate | Votes | % | ± | |
|---|---|---|---|---|---|
| Labour | Tommy Judge* | 1,555 | |||
| Labour | Maddy Monaghan* | 1,486 | |||
| Labour | Hugh Barrett* | 1,399 | |||
| Conservative | Eric Houghton | 393 | |||
| Conservative | Amandeep Kaur | 260 | |||
| Conservative | Sukhjinder Mehat | 231 | |||
| Green | Richard Venes | 217 | |||
| Liberal Democrat | Sally Ashe | 141 | |||
| Liberal Democrat | Hermione Warr | 129 | |||
| Liberal Democrat | Asad Osman | 82 | |||
| Majority | |||||
| Turnout | 2,283 | 19.8% | |||
| Labour hold | Swing | ||||
| Labour hold | Swing | ||||
| Labour hold | Swing | ||||
Whalley Range
| Party | Candidate | Votes | % | ± | |
|---|---|---|---|---|---|
| Labour | Aftab Razaq* | 2,483 | 59.5 | ||
| Labour | Mary Watson* | 2,379 | – | – | |
| Labour | Angeliki Stogia* | 2,327 | – | – | |
| Green | Issy Patience | 1,414 | 33.9 | ||
| Green | Matt Schriebke | 958 | – | – | |
| Green | Stephanie Wyatt | 885 | – | – | |
| Conservative | Amber Lister-Geddes | 140 | 3.4 | ||
| Conservative | James Ranger | 137 | – | – | |
| Liberal Democrat | Jane McQueen | 136 | 3.3 | ||
| Liberal Democrat | Samantha Magill | 130 | – | – | |
| Conservative | Lee McGrath | 128 | – | – | |
| Liberal Democrat | Mark Smith | 81 | – | – | |
| Majority | 1,069 | 25.6 | |||
| Turnout | 4,111 | 36.9 | |||
| Labour hold | Swing | ||||
| Labour hold | Swing | – | |||
| Labour hold | Swing | – | |||
Withington
| Party | Candidate | Votes | % | ± | |
|---|---|---|---|---|---|
| Labour | Rebecca Moore* | 1,987 | 58.93% | ||
| Labour Co-op | Chris Wills* | 1,656 | 49.11% | ||
| Labour Co-op | Chris Paul* | 1,577 | 46.77% | ||
| Liberal Democrat | April Preston | 1,112 | 32.98% | ||
| Liberal Democrat | Alex Warren | 1,026 | 30.43% | ||
| Liberal Democrat | Phil Manktelow | 1,014 | 30.07% | ||
| Green | Adam King | 519 | 15.39% | ||
| Conservative | Shaden Jaradat | 154 | 4.57% | ||
| Conservative | Peter Harrop | 149 | 4.42% | ||
| Conservative | Avigail Walker | 116 | 3.44% | ||
| Rejected ballots | 12 (full) 2 (partial) |
||||
| Turnout | 3,372 | 30.5% | |||
| Registered electors | 11,057 | ||||
| Labour hold | Swing | ||||
| Labour Co-op hold | Swing | ||||
| Labour Co-op hold | Swing | ||||
Woodhouse Park
| Party | Candidate | Votes | % | ± | |
|---|---|---|---|---|---|
| Labour | Sarah Judge* | 1,336 | 67.3% | ||
| Labour | Brian O'Neil* | 1,285 | 64.7% | ||
| Labour | Edward Newman* | 1,246 | 62.7% | ||
| Conservative | Heath Collinson | 349 | 17.6% | ||
| Conservative | David McGrath | 296 | 14.9% | ||
| Conservative | Ken Wedderburn | 286 | 14.4% | ||
| Green | Chris Waldon | 145 | 7.3% | ||
| Liberal Democrat | Anna Hablak | 99 | 5.0% | ||
| Liberal Democrat | Helen Shaw | 92 | 4.6% | ||
| Liberal Democrat | Martha O'Donoghue | 86 | 4.3% | ||
| Majority | |||||
| Turnout | 1,986 | 18% | |||
| Labour hold | Swing | ||||
| Labour hold | Swing | ||||
| Labour hold | Swing | ||||
References
- ↑ Manchester City Council's submission on Warding Patterns John Leech
- ↑ Williams, Jennifer (2018-04-09). "Labour councillor seeking re-election apologises for sweary and abusive posts on Twitter". men. Retrieved 2018-07-16.
- ↑ Williams, Jennifer (9 April 2018). "Labour councillor seeking re-election apologises for sweary and abusive posts on Twitter". Manchester Evening News. Retrieved 9 April 2018.
- ↑ News Desk (9 April 2018). "Calls for disgraced Labour councillor to stand down amid flurry of online abuse". Manchester Gazette. Retrieved 9 April 2018.
- ↑ ""Last-ditch appeal for council candidates sent out to Welsh Tories: "Do you know anybody…in Manchester and Knowsley"?"", Conservative Home, 6 April 2018, retrieved 11 April 2018
- ↑ http://www.johnleech.org.uk/manifesto
- ↑ "Statement of persons nominated". manchester.gov.uk. Manchester City Council. 4 May 2018. Retrieved 4 May 2018.
External links
| Mayor | |
|---|---|
| Bolton | |
| Bury | |
| Manchester | |
| Oldham | |
| Rochdale | |
| Salford | |
| Stockport | |
| Tameside | |
| Trafford | |
| Wigan | |
| County Council |
|
| |