Grand Forks County, North Dakota
| Grand Forks County, North Dakota | |
|---|---|
 | |
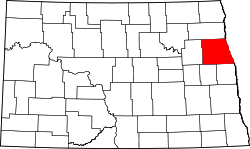 Location in the U.S. state of North Dakota | |
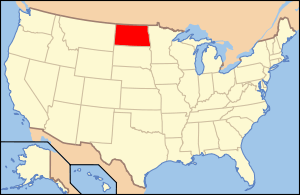 North Dakota's location in the U.S. | |
| Founded | March 2, 1875 |
| Government • Sheriff |
Robert W. "Bob" Rost |
| Seat | Grand Forks |
| Largest city | Grand Forks |
| Area | |
| • Total | 1,440 sq mi (3,730 km2) |
| • Land | 1,436 sq mi (3,719 km2) |
| • Water | 3.1 sq mi (8 km2), 0.2% |
| Population (est.) | |
| • (2017) | 70,795 |
| • Density | 49/sq mi (19/km2) |
| Congressional district | At-large |
| Time zone | Central: UTC−6/−5 |
| Website |
www |
Grand Forks County is a county located in the U.S. state of North Dakota. As of the 2010 census, its population was 66,861,[1] making it the third-most populous county in North Dakota. Its county seat and largest community is Grand Forks.[2] The county was created in 1873 and later organized in 1875.[3][4]
Grand Forks County is included in the Grand Forks, ND-MN Metropolitan Statistical Area.
Geography
According to the U.S. Census Bureau, the county has a total area of 1,440 square miles (3,700 km2), of which 1,436 square miles (3,720 km2) is land and 3.1 square miles (8.0 km2) (0.2%) is water.[5]
Major highways


Adjacent counties
- Walsh County (north)
- Marshall County, Minnesota (northeast)
- Polk County, Minnesota (east)
- Traill County (southeast)
- Steele County (southwest)
- Nelson County (west)
National protected areas
Demographics
| Historical population | |||
|---|---|---|---|
| Census | Pop. | %± | |
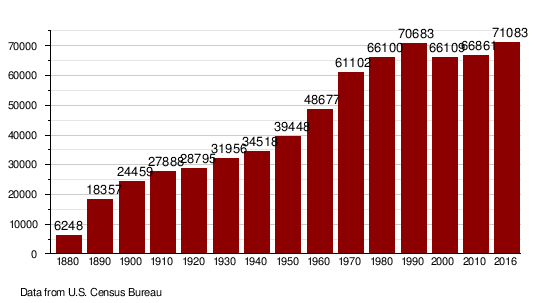
| 1880 | 6,248 | — | |
| 1890 | 18,357 | 193.8% | |
| 1900 | 24,459 | 33.2% | |
| 1910 | 27,888 | 14.0% | |
| 1920 | 28,795 | 3.3% | |
| 1930 | 31,956 | 11.0% | |
| 1940 | 34,518 | 8.0% | |
| 1950 | 39,448 | 14.3% | |
| 1960 | 48,677 | 23.4% | |
| 1970 | 61,102 | 25.5% | |
| 1980 | 66,100 | 8.2% | |
| 1990 | 70,683 | 6.9% | |
| 2000 | 66,109 | −6.5% | |
| 2010 | 66,861 | 1.1% | |
| Est. 2017 | 70,795 | [6] | 5.9% |
| U.S. Decennial Census[7] 1790-1960[8] 1900-1990[9] 1990-2000[10] | |||
2000 census
As of the census of 2000, there were 66,109 people, 25,435 households, and 15,617 families residing in the county. The population density was 46 people per square mile (18/km²). There were 27,373 housing units at an average density of 19 per square mile (7/km²). The racial makeup of the county was 93.00% White, 1.37% Black or African American, 2.31% Native American, 0.98% Asian, 0.07% Pacific Islander, 0.72% from other races, and 1.57% from two or more races. 2.06% of the population were Hispanic or Latino of any race. 31.6% were of Norwegian, 26.1% German and 5.5% Irish ancestry.
There were 25,435 households out of which 32.4% had children under the age of 18 living with them, 49.5% were married couples living together, 8.8% had a female householder with no husband present, and 38.6% were non-families. 28.3% of all households were made up of individuals and 8.2% had someone living alone who was 65 years of age or older. The average household size was 2.43 and the average family size was 3.03.
In the county, the population was spread out with 23.8% under the age of 18, 19.6% from 18 to 24, 28.8% from 25 to 44, 18.2% from 45 to 64, and 9.6% who were 65 years of age or older. The median age was 29 years. For every 100 females, there were 103.7 males. For every 100 females age 18 and over, there were 102.3 males.
The median income for a household in the county was $35,785, and the median income for a family was $46,620. Males had a median income of $30,079 versus $21,426 for females. The per capita income for the county was $17,868. About 8.0% of families and 12.3% of the population were below the poverty line, including 12.0% of those under age 18 and 7.6% of those age 65 or over.
2010 census
As of the 2010 United States Census, there were 66,861 people, 27,417 households, and 15,215 families residing in the county.[11] The population density was 46.5 inhabitants per square mile (18.0/km2). There were 29,344 housing units at an average density of 20.4 per square mile (7.9/km2).[12] The racial makeup of the county was 90.3% white, 2.5% American Indian, 2.0% black or African American, 1.9% Asian, 0.1% Pacific islander, 0.8% from other races, and 2.4% from two or more races. Those of Hispanic or Latino origin made up 2.9% of the population.[11] In terms of ancestry, 34.1% were German, 33.8% were Norwegian, 9.5% were Irish, 5.8% were Polish, 5.3% were English, and 2.9% were American.[13]
Of the 27,417 households, 26.6% had children under the age of 18 living with them, 42.8% were married couples living together, 9.1% had a female householder with no husband present, 44.5% were non-families, and 32.1% of all households were made up of individuals. The average household size was 2.28 and the average family size was 2.91. The median age was 29.7 years.[11]
The median income for a household in the county was $44,242 and the median income for a family was $65,804. Males had a median income of $40,622 versus $31,633 for females. The per capita income for the county was $24,276. About 8.2% of families and 17.5% of the population were below the poverty line, including 15.6% of those under age 18 and 10.3% of those age 65 or over.[14]
Population by decade
Communities
Cities
Townships
- Agnes
- Allendale
- Americus
- Arvilla
- Avon
- Bentru
- Blooming
- Brenna
- Chester
- Elkmount
- Elm Grove
- Fairfield
- Falconer
- Ferry
- Gilby
- Grace
- Grand Forks
- Hegton
- Inkster
- Johnstown
- Lakeville
- Larimore
- Levant
- Lind
- Logan Center
- Loretta
- Mekinock
- Michigan
- Moraine
- Niagara
- Northwood
- Oakville
- Pleasant View
- Plymouth
- Rye
- Strabane
- Turtle River
- Union
- Walle
- Washington
- Wheatfield
Census-designated places
Other communities
Politics
| Year | Republican | Democratic | Third parties |
|---|---|---|---|
| 2016 | 53.8% 16,340 | 35.7% 10,851 | 10.5% 3,174 |
| 2012 | 50.2% 15,060 | 46.7% 14,032 | 3.1% 937 |
| 2008 | 46.3% 14,520 | 51.4% 16,104 | 2.3% 709 |
| 2004 | 56.8% 17,298 | 41.5% 12,646 | 1.7% 526 |
| 2000 | 55.9% 15,875 | 37.3% 10,593 | 6.8% 1,917 |
| 1996 | 44.9% 11,606 | 44.0% 11,376 | 11.1% 2,854 |
| 1992 | 44.1% 13,705 | 35.1% 10,930 | 20.8% 6,469 |
| 1988 | 53.8% 14,801 | 45.4% 12,494 | 0.9% 236 |
| 1984 | 60.7% 15,898 | 38.4% 10,050 | 0.9% 243 |
| 1980 | 57.7% 14,257 | 28.3% 6,997 | 14.1% 3,477 |
| 1976 | 52.7% 13,820 | 44.0% 11,545 | 3.3% 853 |
| 1972 | 56.9% 13,361 | 40.1% 9,416 | 3.0% 698 |
| 1968 | 52.0% 9,802 | 40.8% 7,695 | 7.2% 1,352 |
| 1964 | 40.5% 7,367 | 59.1% 10,740 | 0.4% 68 |
| 1960 | 56.9% 10,997 | 43.1% 8,341 | 0.0% 5 |
| 1956 | 62.2% 10,289 | 37.7% 6,231 | 0.2% 30 |
| 1952 | 65.7% 10,939 | 33.8% 5,639 | 0.5% 84 |
| 1948 | 46.2% 6,374 | 50.7% 6,996 | 3.0% 419 |
| 1944 | 42.2% 5,668 | 57.4% 7,707 | 0.4% 59 |
| 1940 | 45.4% 7,043 | 54.2% 8,396 | 0.4% 67 |
| 1936 | 29.6% 4,312 | 63.4% 9,222 | 7.0% 1,015 |
| 1932 | 39.5% 5,090 | 58.8% 7,579 | 1.8% 231 |
| 1928 | 64.9% 8,024 | 34.8% 4,300 | 0.4% 47 |
| 1924 | 62.8% 6,690 | 8.9% 943 | 28.3% 3,018 |
| 1920 | 74.0% 7,646 | 24.5% 2,527 | 1.5% 159 |
| 1916 | 41.9% 2,159 | 54.7% 2,814 | 3.4% 175 |
| 1912 | 23.9% 955 | 37.3% 1,492 | 38.8% 1,552[16] |
| 1908 | 57.4% 2,740 | 36.7% 1,750 | 5.9% 283 |
| 1904 | 73.2% 2,807 | 21.6% 828 | 5.3% 202 |
| 1900 | 61.3% 2,603 | 36.1% 1,532 | 2.6% 109 |
See also
References
- ↑ "State & County QuickFacts". United States Census Bureau. Archived from the original on July 10, 2011. Retrieved October 31, 2013.
- ↑ "Find a County". National Association of Counties. Archived from the original on 2011-05-31. Retrieved 2011-06-07.
- ↑ "Dakota Territory, South Dakota, and North Dakota: Individual County Chronologies". Dakota Territory Atlas of Historical County Boundaries. The Newberry Library. 2006. Retrieved February 3, 2015.
- ↑ "County History". North Dakota.gov. The State of North Dakota. Retrieved February 3, 2015.
- ↑ "2010 Census Gazetteer Files". United States Census Bureau. August 22, 2012. Archived from the original on January 29, 2015. Retrieved January 28, 2015.
- ↑ "Population and Housing Unit Estimates". Retrieved June 11, 2018.
- ↑ "U.S. Decennial Census". United States Census Bureau. Archived from the original on May 12, 2015. Retrieved January 28, 2015.
- ↑ "Historical Census Browser". University of Virginia Library. Retrieved January 28, 2015.
- ↑ Forstall, Richard L., ed. (March 27, 1995). "Population of Counties by Decennial Census: 1900 to 1990". United States Census Bureau. Retrieved January 28, 2015.
- ↑ "Census 2000 PHC-T-4. Ranking Tables for Counties: 1990 and 2000" (PDF). United States Census Bureau. April 2, 2001. Retrieved January 28, 2015.
- 1 2 3 "DP-1 Profile of General Population and Housing Characteristics: 2010 Demographic Profile Data". United States Census Bureau. Retrieved 2016-03-14.
- ↑ "Population, Housing Units, Area, and Density: 2010 - County". United States Census Bureau. Retrieved 2016-03-14.
- ↑ "DP02 SELECTED SOCIAL CHARACTERISTICS IN THE UNITED STATES – 2006-2010 American Community Survey 5-Year Estimates". United States Census Bureau. Retrieved 2016-03-14.
- ↑ "DP03 SELECTED ECONOMIC CHARACTERISTICS – 2006-2010 American Community Survey 5-Year Estimates". United States Census Bureau. Retrieved 2016-03-14.
- ↑ Leip, David. "Dave Leip's Atlas of U.S. Presidential Elections". uselectionatlas.org. Retrieved 2018-04-12.
- ↑ The leading "other" candidate, Progressive Theodore Roosevelt, received 1,327 votes, while Socialist candidate Eugene Debs received 180 votes, Prohibition candidate Eugene Chafin received 45 votes.
Places adjacent to Grand Forks County, North Dakota | ||||||||||
|---|---|---|---|---|---|---|---|---|---|---|
| ||||||||||
Municipalities and communities of Grand Forks County, North Dakota, United States | ||
|---|---|---|
| Cities | | |
| Townships |
| |
| CDP | ||
| Unincorporated communities |
| |
| Ghost town | ||
| Footnotes | ‡This populated place also has portions in an adjacent county or counties | |
| Counties | ||
|---|---|---|
| Main cities | ||
| Surrounding areas | ||
† - county seat | ||