List of Polish voivodeships by GRP per capita
_per_capita_in_2015.png)
GRP per capita of Polish voivodeships based on purchasing power standards (PPS) in 2015
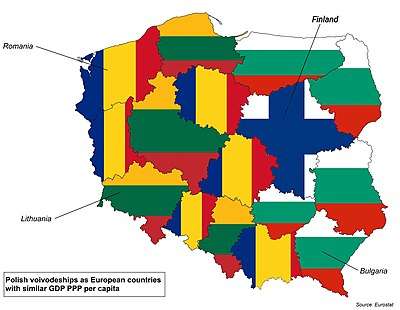
Polish voivodeships as European countries with similar GDP PPP per capita
This is a list of Polish voivodeships by gross regional product (GRP) per capita, based on purchasing power standards (PPS) and shown in euros. Statistics shown are for 2016 levels.
| Rank | Province (Voivodeship) |
2016 (in EUR) |
European countries with similar GDP PPS per capita[1] |
|---|---|---|---|
| 1 | Masovia | 31,700 | |
| 2 | Lower Silesia | 22,100 | |
| 3 | Greater Poland | 21,700 | |
| 4 | Silesia | 20,700 | |
| 5 | Pomerania | 19,300 | |
| 6 | Łódź | 18,600 | |
| 7 | Lesser Poland | 18,100 | |
| 8 | West Pomerania | 16,700 | |
| 9 | Lubusz | 16,700 | |
| 10 | Kujawy-Pomerania | 16,300 | |
| 11 | Opole | 15,900 | |
| 12 | Świętokrzyskie | 14,300 | |
| 13 | Warmia-Masuria | 14,200 | |
| 14 | Podlaskie | 14,100 | |
| 15 | Podkarpackie | 14,000 | |
| 16 | Lublin | 13,700 | |
| — | Poland | 19,900 |
_as_countries_with_similar_Nominal_GDP.jpg)
Polish Voivodeships(Provinces) as countries with similar Nominal GDP
This is a list of Polish voivodeships by Nominal gross regional product (GRP) shown in billion euros. Statistics shown are for 2016 levels.
| Rank | Province (Voivodeship) |
2016 (in billions EUR) |
Countries with similar GDP (Nominal)[2] |
|---|---|---|---|
| 1 | Masovia | 94.5 | |
| 2 | Silesia | 52.5 | |
| 3 | Greater Poland | 42.1 | |
| 4 | Lower Silesia | 35.7 | |
| 5 | Lesser Poland | 34.0 | |
| 6 | Łódź | 25.8 | |
| 7 | Pomerania | 24.8 | |
| 8 | Kujawy-Pomerania | 19.0 | |
| 9 | Podkarpackie | 16.6 | |
| 10 | Lublin | 16.3 | |
| 11 | West Pomerania | 15.9 | |
| 12 | Warmia-Masuria | 11.4 | |
| 13 | Świętokrzyskie | 10.0 | |
| 14 | Lubusz | 9.5 | |
| 15 | Podlaskie | 9.3 | |
| 16 | Opole | 8.8 | |
| — | Poland | 425.6 |
See also
References
Poland articles | |||||||||
|---|---|---|---|---|---|---|---|---|---|
| History |
|  | |||||||
| Geography | |||||||||
| Politics | |||||||||
| Economy | |||||||||
| Culture |
| ||||||||
| |||||||||
This article is issued from
Wikipedia.
The text is licensed under Creative Commons - Attribution - Sharealike.
Additional terms may apply for the media files.