Demographics of Kosovo
| Demographics of Kosovo | |
|---|---|
.png) Population of Kosovo (in thousands) from 1921–2015 | |
| Population |
|
| Growth rate |
|
| Birth rate |
|
| Death rate |
|
| Life expectancy |
|
| • male |
|
| • female |
|
| Fertility rate |
|
| Infant mortality rate |
|
| Net migration rate | -3.72 per 1,000 pop. |
| Age structure | |
| 0–14 years | 25.8% |
| 15–64 years | 67.2% |
| 65 and over | 7.0% |
| Sex ratio | |
| Total | 1.08 male(s)/female |
| Nationality | |
| Nationality | noun: Kosovar/Kosovan(s) adjective: Kosovar |
| Major ethnic | Albanians (95%) |
| Minor ethnic | Serbs (1%) and others (4%) |
| Language | |
| Official | Albanian |
| Spoken |
Albanian (95%) languages of the minorities (5%) |
The Kosovo Agency of Statistics monitors various demographic features of the population of Kosovo, such as population density, ethnicity, education level, health of the populace, economic status, religious affiliations and other aspects of the population. Censuses, normally conducted at ten-year intervals, record the demographic characteristics of the population. According to the first census conducted after the 2008 declaration of independence in 2011, the permanent population of Kosovo had reached 1,739,825, excluding North Kosovo.[2]
Albanians form the majority in Kosovo, with over 93% of the total population; significant minorities include Serbs and others. A 2015 estimate put Kosovo's population at 1,870,981.[1]
Kosovo has the youngest population in Europe. Half of its roughly 2-million-strong population is under the age of 25, according to a recent report of the UN Development Programme, UNDP. According to the government data, it is estimated that more than 65 percent of the population are younger than 30.[3] While Kosovo's birth rate remains the highest in Europe, Serbia's is among the lowest, and the only municipalities with population growth are Albanian minority enclaves in the south next to Kosovo.[4]
History
2011 census
The final results of the 2011 census recorded Kosovo (excluding North Kosovo) as having 1,739,825 inhabitants.[5] The European Centre for Minority Issues (ECMI) has called "for caution when referring to the 2011 census", due to the boycott by Serb-majority municipalities in North Kosovo and the partial boycott by Serbs and Roma in southern Kosovo.[6] The recorded total population was below most previous estimates. The census enjoyed considerable technical assistance from international agencies and appears to have been endorsed by Eurostat; it was, however, the first full census since 1981, and not one of an uninterrupted series. The results show that there were no people temporarily resident in hotels or refugee camps at the time of the census;[7] that out of 312,711 conventional dwellings, 99,808 (over 30%) were unoccupied;[7] and that three municipalities designed under the Ahtisaari Plan to have Serb majorities - Klokot, Novo Brdo, and Štrpce - in fact had ethnic Albanian majorities (although their municipal assemblies have Serb majorities).[7]
 Kosovo ethnic map 2011 by settlement.
 Distribution of Albanians in Kosovo 2011 by settlements.
 Distribution of Serbs in Kosovo by settlements 2011.
 Distribution of Bosniaks in Kosovo by settlements.
 Distribution of Turks in Kosovo by settlements.
 Distribution of Gorani in Kosovo by settlements.
_in_Kosovo_2011_census.GIF) Distribution of Roma, Ashkali and Egyptians in Kosovo by settlements.
Distribution of Roma, Ashkali and Egyptians in Kosovo by settlements.
Population
The 2000 Living Standard Measurement Survey, conducted by the Kosovo Agency of Statistics and rejected by Belgrade,[8] estimated the population between 1.8–2.0 million.[9]
Kosovo currently has the youngest population in Europe, with an estimated fertility rate of 2.4 children per woman.[10] In recent years, however, Kosovo's population growth rate has begun to slow and its birth rate has decreased.[11][12]
Vital statistics
In 2009, 34,477 births were registered, 34,240 of whom were born alive, while 237 were born dead.[13] The vitality ratio was 9. Ratio of dead births (fetal deaths) in 1000 births was 6.9. The age group of mothers was as following: 25–29 years age group with 35.1%, 20–24 years old age groups with 26.4%, age group 30–34 years with 23.3%, and other age group compose 15.2% of the total number of births. The average age of women who have children born in 2009, is 27.7 years. Under the weight of children born in health institutions, the majority of infants with weight is 3000-3499 grams or 31.4% from 3500 to 3999 gr. 23.7%, from 2500 to 2999 gr. 12.7%, etc. Live babies born weighing less than 1000 gr. constitute only 0.3%.[14] Under education, mothers with primary school dominate the top with 44.9% of secondary but not tertiary and university with 7.2%, etc.
Frequent names in 2009 for girls were Erza (114 times) and Suela (108 times) while for boys was the names Leon (159 times) and Leart (124 times).[15][16]
| Sex ratio | ||||
|---|---|---|---|---|
| Year | Total | Male | Female | Sex Ratio |
| 2002 | 36,136 | 18,752 | 17,384 | 107.9 |
| 2003 | 31,994 | 16,777 | 15,217 | 110.3 |
| 2004 | 35,063 | 18,213 | 16,850 | 108.1 |
| 2005 | 37,218 | 19,431 | 17,787 | 109.2 |
| 2006 | 34,187 | 17,827 | 16,360 | 109 |
| 2007 | 33,112 | 17,394 | 15,718 | 110.7 |
| 2008 | 34,399 | 17,857 | 16,542 | 107.9 |
| 2009 | 34,240 | 17,853 | 16,387 | 108.9 |
| 2010 | 33,751 | 17,805 | 15,946 | 111.7 |
| 2011 | 34,262 | 17,837 | 16,425 | 108.6 |
| Deaths according years and gender | |||||
|---|---|---|---|---|---|
| Year | Total | Male | Female | Male % | Female % |
| 2002 | 5,654 | 3,348 | 2,306 | 59.2 | 40.8 |
| 2003 | 6,417 | 3,741 | 2,676 | 58.3 | 41.7 |
| 2004 | 6,399 | 3,654 | 2,745 | 57.1 | 42.9 |
| 2005 | 7,207 | 4,058 | 3,149 | 56.3 | 43.7 |
| 2006 | 7,479 | 4,313 | 3,166 | 57.7 | 42.3 |
| 2007 | 6,681 | 3,867 | 2,814 | 57.9 | 42.1 |
| 2008 | 6,852 | 3,963 | 2,889 | 57.8 | 42.2 |
| 2009 | 7,030 | 4,079 | 2,951 | 58 | 42 |
| 2010 | 7,234 | 4,263 | 2,971 | 58.9 | 41.1 |
| 2011 | 7,556 | 4,442 | 3,114 | 58.8 | 41.2 |
| Source: Kosovo Agency of Statistics | |||||
Population estimates in the table below may be unreliable since the 1990s. Besides, births and deaths exclude territories with a Serbian majority. Since 2011, in accordance with European statistical norms, live births and deaths record figures in Kosovo only (excluding foreign countries).[17]
| Estimated population (x 1000) | Live births | Deaths | Natural change | Crude birth rate (per 1000) | Crude death rate (per 1000) | Natural change (per 1000) | |
|---|---|---|---|---|---|---|---|
| 1948 | 733 | 27 792 | 10 324 | 17 468 | 37.9 | 14.1 | 23.8 |
| 1949 | 751 | 31 643 | 12 937 | 18 706 | 42.1 | 17.2 | 24.9 |
| 1950 | 764 | 35 222 | 12 991 | 22 231 | 46.1 | 17.0 | 29.1 |
| 1951 | 780 | 29 299 | 14 833 | 14 466 | 37.6 | 19.0 | 18.5 |
| 1952 | 793 | 35 619 | 13 867 | 21 752 | 44.9 | 17.5 | 27.4 |
| 1953 | 813 | 34 595 | 16 726 | 17 869 | 42.6 | 20.6 | 22.0 |
| 1954 | 832 | 38 595 | 13 201 | 25 394 | 46.4 | 15.9 | 30.5 |
| 1955 | 842 | 36 736 | 15 292 | 21 444 | 43.6 | 18.2 | 25.5 |
| 1956 | 859 | 37 819 | 13 692 | 24 127 | 44.0 | 15.9 | 28.1 |
| 1957 | 873 | 34 159 | 15 300 | 18 859 | 39.1 | 17.5 | 21.6 |
| 1958 | 890 | 39 285 | 11 598 | 27 687 | 44.1 | 13.0 | 31.1 |
| 1959 | 921 | 37 364 | 12 878 | 24 486 | 40.6 | 14.0 | 26.6 |
| 1960 | 944 | 41 631 | 13 365 | 28 266 | 44.1 | 14.2 | 29.9 |
| 1961 | 972 | 40 561 | 11 759 | 28 802 | 41.7 | 12.1 | 29.6 |
| 1962 | 997 | 41 336 | 15 024 | 26 312 | 41.5 | 15.1 | 26.4 |
| 1963 | 1 021 | 41 525 | 12 423 | 29 102 | 40.7 | 12.2 | 28.5 |
| 1964 | 1 046 | 42 557 | 12 731 | 29 826 | 40.7 | 12.2 | 28.5 |
| 1965 | 1 075 | 43 569 | 11 767 | 31 802 | 40.5 | 10.9 | 29.6 |
| 1966 | 1 101 | 42 429 | 10 266 | 32 163 | 38.5 | 9.3 | 29.2 |
| 1967 | 1 131 | 44 001 | 11 308 | 32 693 | 38.9 | 10.0 | 28.9 |
| 1968 | 1 159 | 44 627 | 10 781 | 33 846 | 38.5 | 9.3 | 29.2 |
| 1969 | 1 189 | 46 480 | 10 892 | 35 588 | 39.1 | 9.2 | 29.9 |
| 1970 | 1 220 | 44 496 | 10 829 | 33 667 | 36.5 | 8.9 | 27.6 |
| 1971 | 1 254 | 47 060 | 10 312 | 36 748 | 37.5 | 8.2 | 29.3 |
| 1972 | 1 291 | 47 943 | 10 270 | 37 673 | 37.1 | 8.0 | 29.2 |
| 1973 | 1 329 | 47 714 | 10 358 | 37 356 | 35.9 | 7.8 | 28.1 |
| 1974 | 1 367 | 49 847 | 10 075 | 39 772 | 36.5 | 7.4 | 29.1 |
| 1975 | 1 406 | 49 310 | 10 018 | 39 292 | 35.1 | 7.1 | 27.9 |
| 1976 | 1 446 | 51 355 | 10 149 | 41 206 | 35.5 | 7.0 | 28.5 |
| 1977 | 1 487 | 49 849 | 9 811 | 40 038 | 33.5 | 6.6 | 26.9 |
| 1978 | 1 526 | 49 027 | 9 776 | 39 251 | 32.1 | 6.4 | 25.7 |
| 1979 | 1 566 | 48 125 | 9 575 | 38 550 | 30.7 | 6.1 | 24.6 |
| 1980 | 1 555 | 53 147 | 8 909 | 44 238 | 34.2 | 5.7 | 28.4 |
| 1981 | 1 595 | 48 111 | 9 677 | 38 434 | 30.2 | 6.1 | 24.1 |
| 1982 | 1 629 | 52 865 | 10 479 | 42 386 | 32.5 | 6.4 | 26.0 |
| 1983 | 1 664 | 49 645 | 11 040 | 38 605 | 29.8 | 6.6 | 23.2 |
| 1984 | 1 699 | 55 243 | 10 573 | 44 670 | 32.5 | 6.2 | 26.3 |
| 1985 | 1 735 | 53 925 | 11 826 | 42 099 | 31.1 | 6.8 | 24.3 |
| 1986 | 1 773 | 54 519 | 10 446 | 44 073 | 30.7 | 5.9 | 24.9 |
| 1987 | 1 811 | 56 221 | 10 307 | 45 914 | 31.0 | 5.7 | 25.4 |
| 1988 | 1 850 | 56 283 | 10 257 | 46 026 | 30.4 | 5.5 | 24.9 |
| 1989 | 1 889 | 53 656 | 10 181 | 43 475 | 28.4 | 5.4 | 23.0 |
| 1990 | 1 930 | 55 175 | 8 214 | 46 961 | 28.6 | 4.3 | 24.3 |
| 1991 | 1 967 | 52 263 | 8 526 | 43 737 | 26.6 | 4.3 | 22.2 |
| 1992 | 2 006 | 44 418 | 8 004 | 36 414 | 22.1 | 4.0 | 18.2 |
| 1993 | 2 043 | 44 132 | 7 804 | 36 328 | 21.6 | 3.8 | 17.8 |
| 1994 | 2 077 | 43 450 | 7 667 | 35 783 | 20.9 | 3.7 | 17.2 |
| 1995 | 2 113 | 44 776 | 8 671 | 36 105 | 21.2 | 4.1 | 17.1 |
| 1996 | 2 151 | 46 041 | 8 392 | 37 649 | 21.4 | 3.9 | 17.5 |
| 1997 | 2 186 | 42 920 | 8 624 | 34 296 | 19.6 | 3.9 | 15.7 |
| 1998 | 2 000 | 41 752 | 8 123 | 33 629 | 20.9 | 4.1 | 16.8 |
| 1999 | 2 000 | 40 020 | 7 569 | 32 451 | 20.0 | 3.8 | 16.2 |
| 2000 | 2 000 | 38 667 | 7 115 | 31 552 | 19.3 | 3.6 | 15.8 |
| 2001 | 2 000 | 37 412 | 6 672 | 30 740 | 18.7 | 3.3 | 15.4 |
| 2002 | 1 985 | 36 136 | 5 654 | 30 482 | 18.2 | 2.8 | 15.4 |
| 2003 | 2 016 | 31 994 | 6 417 | 25 577 | 15.9 | 3.2 | 12.7 |
| 2004 | 2 041 | 35 063 | 6 399 | 28 664 | 17.2 | 3.1 | 14.0 |
| 2005 | 2 070 | 37 218 | 7 207 | 30 011 | 18.0 | 3.5 | 14.5 |
| 2006 | 2 100 | 34 187 | 7 479 | 26 708 | 16.3 | 3.6 | 12.7 |
| 2007 | 2 126 | 33 112 | 6 681 | 26 431 | 15.6 | 3.1 | 12.4 |
| 2008 | 2 153 | 34 399 | 6 852 | 27 547 | 16.0 | 3.2 | 12.8 |
| 2009 | 34 240 | 7 030 | 27 210 | 15.7 | 3.2 | 12.5 | |
| 2010 | 33 751 | 7 234 | 26 517 | 15.3 | |||
| 2011 | 1 801 | 27 626 | 7 111 | 20 515 | 15.3 | 3.9 | 11.4 |
| 2012 | 1 815 | 27 743 | 7 317 | 20 426 | 15.3 | 4.0 | 11.3 |
| 2013 | 1 837 | 29 327 | 7 135 | 22 192 | 16.0 | 3.9 | 12.1 |
| 2014 | 1 861 | 25 929 | 7 634 | 18 295 | 13.9 | 4.1 | 9.8 |
| 2015 | 1 884 | 24 594 | 8 202 | 16 392 | 13.0 | 4.3 | 8.7 |
| 2016 | 1 905 | 23 416 | 8 495 | 14 921 | 12.3 | 4.4 | 7.9 |
| 2017 | 1 920 | 23 402 | 8,738 | 14 664 |
Marriages and divorces
In 2009, 20,209 marriages were registered. The average age of couples was 29.5 years. (men–31 and women–28). Prizren ranked first with 1,720 marriages or 8.5%, followed by Pristina with 1,643 or 8.1%, Podujeva with 1,302 or 6.4%, etc. According to the education, to male dominates the secondary education by 75.3%, and dominates the secondary education with 64.5%.[18]
| Marriages according to years and ages of couples | ||||
|---|---|---|---|---|
| Year | TOTAL | The average age women | The average age men | The average marriage age |
| 2002 | 18,280 | 25.8 | 29.4 | 27.3 |
| 2003 | 17,034 | 28.2 | 29.7 | 27.7 |
| 2004 | 16,917 | 27 | 30.3 | 28.7 |
| 2005 | 15,732 | 27. 0 | 30.3 | 29. 0 |
| 2006 | 15,825 | 27. 0 | 30.3 | 29. 0 |
| 2007 | 16,824 | 27. 0 | 31.0 | 29. 0 |
| 2008 | 17,950 | 28. 0 | 30.0 | 26. 0 |
| 2009 | 20,209 | 28. 0 | 31.0 | 29.5 |
| 2010 | 18,289 | 28. 0 | 30.0 | 28. 0 |
| 2011 | 17,343 | 27.9 | 32.0 | 29. 0 |
| Source: KAS, Vital Statistics | ||||
| Divorces according to years and duration of marriages | ||||||||||||
|---|---|---|---|---|---|---|---|---|---|---|---|---|
| Year | Total | Less than a year | One year | Two years | Three years | Four years | 5–9 years | 10–14 years | 15–19 years | 20–24 years | 25 and more | Unknown |
| 2004 | 1,293 | 54 | 149 | 181 | 129 | 97 | 249 | 221 | 118 | 48 | 45 | 2 |
| 2005 | 1,445 | 67 | 143 | 186 | 172 | 148 | 272 | 228 | 137 | 52 | 40 | 0 |
| 2006 | 1,480 | 74 | 152 | 191 | 172 | 177 | 351 | 147 | 128 | 46 | 41 | 1 |
| 2007 | 1,558 | 149 | 208 | 162 | 177 | 206 | 334 | 128 | 106 | 50 | 38 | 0 |
| 2008 | 1,026 | 73 | 141 | 121 | 103 | 146 | 258 | 72 | 62 | 24 | 26 | 0 |
| 2009 | 1,555 | 122 | 213 | 190 | 170 | 170 | 419 | 109 | 67 | 55 | 40 | 0 |
| 2010 | 1,453 | 124 | 215 | 202 | 170 | 129 | 377 | 86 | 68 | 37 | 45 | 0 |
| 2011 | 1,469 | 129 | 211 | 159 | 154 | 139 | 384 | 104 | 77 | 49 | 63 | 0 |
| Source: KAS, Vital Statistics | ||||||||||||
Administrative divisions
Kosovo is administratively subdivided into seven districts, and 38 municipalities. With the current estimation on population, Kosovo ranks as the 150th largest country in the world based on how populous it is.[19]
| Rank | Name used on Wikipedia (most common version in English) | Name (Albanian) | Name (Serbian) | Population (2011)[b] | Area (km2) | Density (km2) | Settlements |
|---|---|---|---|---|---|---|---|
| 1 | Pristina | Prishtinë | Priština | 198,897 | 572 | 347.7 | 41 |
| 7 | Podujevo | Besianë | Podujevo | 88,499 | 663 | 133.5 | 76 |
| 11 | Glogovac | Drenas | Glogovac | 58,531 | 290 | 201.8 | 37 |
| 12 | Lipljan | Lipjan | Lipljan | 57,605 | 422 | 136.5 | 70 |
| 21 | Kosovo Polje | Fushë Kosovë | Kosovo Polje | 34,827 | 83 | 419.6 | 15 |
| 26 | Obilić | Obiliq/Kastriot | Obilić | 21,549 | 105 | 205.2 | 19 |
| 30 | Gračanica | Gracanicë | Gračanica | 10,675 | 131 | 81.5 | 16 |
| 33 | Novo Brdo | Novobërdë | Novo Brdo | 6,729 | 204 | 33 | 24 |
| — | Pristina District | 477,312 | 2,470 | 193.2 | 298 | ||
| 2 | Prizren | Prizren | Prizren | 177,781 | 626 | 284 | 74 |
| 10 | Suva Reka | Suharekë | Suva Reka | 59,722 | 306 | 178.5 | 42 |
| 14 | Mališevo | Malishevë | Mališevo | 54,613 | 361 | 165.4 | 43 |
| 22 | Dragaš | Dragash | Dragaš | 33,997 | 435 | 78.2 | 35 |
| 35 | Mamuša | Mamushë | Mamuša | 5,507 | 11 | 500.6 | – |
| — | Prizren District | 331,670 | 1,397 | 237.4 | 195 | ||
| 23 | Kaçanik | Kaçanik | Kačanik | 33,454 | 221 | 151.4 | 31 |
| 25 | Štimlje | Shtime | Štimlje | 27,324 | 134 | 203.9 | 23 |
| 31 | Elez Han | Hani i Elezit | Đeneral Janković | 9,389 | 83 | 113.1 | 11 |
| 32 | Štrpce | Shtërpcë | Štrpce | 6,949 | 247 | 28.1 | 16 |
| — | Ferizaj District | 185,806 | 1,030 | 180.4 | 126 | ||
| 3 | Ferizaj | Ferizaj | Uroševac | 108,690 | 345 | 315 | 45 |
| — | Pejë District | 174,235 | 1,365 | 127.6 | 118 | ||
| 19 | Klina | Klinë | Klina | 38,496 | 308 | 125 | 54 |
| 4 | Peć | Pejë | Peć | 96,450 | 603 | 160 | 14 |
| 17 | Istok | Istog | Istok | 39,289 | 454 | 86.5 | 50 |
| 5 | Gjakova | Gjakova | Đakovica | 94,557 | 587 | 161.1 | 91 |
| 13 | Orahovac | Rahovec | Orahovac | 55,053 | 276 | 199.5 | 32 |
| 18 | Deçan | Deçan | Dečani | 38,984 | 180 | 216.6 | 37 |
| 34 | Junik | Junik | Junik | 6,078 | 86 | 70.7 | 10 |
| — | Gjakova District | 194,672 | 1,129 | 172.4 | 170 | ||
| 8 | Mitrovica | Mitrovicë | Kosovska Mitrovica | 71,909 | 350 | 205.5 | 45 |
| 9 | Vushtrri | 69,870 | 344 | 203.1 | 67 | ||
| 15 | Skenderaj | Skënderaj | Srbica | 50,858 | 378 | 134.5 | 49 |
| 24 | North Mitrovica | Mitrovica Veriore | 29,460 | 11 | 2,678.2 | – | |
| 27 | Leposavić | Leposaviq | 18,600 | 539 | 34.5 | 42 | |
| 28 | Zvečan | Zveçan | 16,650 | 122 | 136.5 | 35 | |
| 29 | Zubin Potok | Zubin Potoku | 14,900 | 333 | 44.7 | 29 | |
| — | Mitrovica District | 272,247 | 2,077 | 131.1 | 267 | ||
| 6 | Gjilan | Gjilan | Gnjilane | 90,015 | 385 | 233.8 | 54 |
| 16 | Vitina | Viti | Vitina | 46,959 | 278 | 168.9 | 39 |
| 20 | Kamenicë/Dardanë | 35,600 | 423 | 84.2 | 58 | ||
| 36 | Ranillug | Ranilug | 3,866 | 78 | 49.6 | 18 | |
| 37 | Klokot | Kllokot | Klokot | 2,556 | 24 | 106.5 | 4 |
| 38 | Partesh | 1,787 | 18 | 99.3 | 3 | ||
| — | Gjilan District | 180,783 | 1,206 | 149.9 | 287 | ||
| 1,816,675 | 10,908 | 170 | 1,339 | ||||
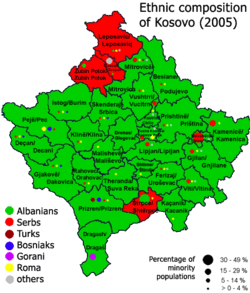
Ethnic groups
The official results of the censuses in Kosovo after World War II are tabulated below.The figures for Albanians in the 1991 census were estimates only, since that census was boycotted by most Albanians. Similarly, the figures for Serbs in the 2011 census omit those in North Kosovska Mitrovica, Leposavić, Zubin Potok, and Zvečan (North Kosovo), while the number of Serbs and Romani in the rest of Kosovo is also deemed unreliable, due to the partial boycott.[6]
| Ethnic group |
1948 census | 1953 census | 1961 census | 1971 census | 1981 census | 1991 census | 2011 census | |||||||
|---|---|---|---|---|---|---|---|---|---|---|---|---|---|---|
| Number | % | Number | % | Number | % | Number | % | Number | % | Number | % | Number | % | |
| Albanians | 498,244 | 68.5 | 524,559 | 64.9 | 646,605 | 67.1 | 916,168 | 73.7 | 1,226,736 | 77.4 | 1,596,072 | 81.6 | 1,616,869 | 92.9 |
| Serbs | 171,911 | 23.6 | 189,869 | 23.5 | 227,016 | 23.5 | 228,264 | 18.4 | 209,498 | 13.2 | 194,190 | 9.9 | 25,532 | 1.5 |
| Muslims | 9,679 | 1.3 | 6,241 | 0.8 | 8,026 | 0.8 | 26,357 | 2.1 | 58,562 | 3.7 | 66,189 | 3.4 | ||
| Bosniaks | 27,533 | 1.6 | ||||||||||||
| Gorani | 10,265 | 0.6 | ||||||||||||
| Montenegrins | 28,050 | 3.9 | 31,343 | 3.9 | 37,588 | 3.9 | 31,555 | 2.5 | 27,028 | 1.7 | 20,365 | 1.1 | ||
| Croats | 5,290 | 0.7 | 6,201 | 0.8 | 7,251 | 0.8 | 8,264 | 0.7 | 8,718 | 0.6 | 8,062 | 0.4 | ||
| Yugoslavs | 5,206 | 0.5 | 920 | 0.1 | 2,676 | 0.2 | 3,457 | 0.2 | ||||||
| Romani | 11,230 | 1.5 | 11,904 | 1.5 | 3,202 | 0.3 | 14.593 | 1.2 | 34,126 | 2.2 | 45,760 | 2.3 | 8,824 | 0,5 |
| Ashkali | 15,436 | 0.9 | ||||||||||||
| Egyptians | 11,524 | 0.6 | ||||||||||||
| Turks | 1,315 | 0.2 | 34,583 | 4.3 | 25,764 | 2.7 | 12,244 | 1.0 | 12,513 | 0.8 | 10,445 | 0.5 | 18,738 | 1.1 |
| Macedonians | 526 | 0.1 | 972 | 0.1 | 1,142 | 0.1 | 1,048 | 0.1 | 1,056 | 0.1 | ||||
| Others or unspecified | 1,577 | 0.2 | 2,469 | 0.3 | 2,188 | 0.2 | 4,280 | 0.3 | 3,454 | 0.2 | 11,656 | 0.6 | 3,264 | 0.6 |
| Total | 727,820 | 808,141 | 963,988 | 1,243,693 | 1,584,441 | 1,956,196 | 1,739,825 | |||||||
Ethnic groups by municipality
The results of the 2011 census of ethnic groups in municipalities are tabulated below.[20]
| Ethnic groups by municipality | ||||||||||||||||||||||
|---|---|---|---|---|---|---|---|---|---|---|---|---|---|---|---|---|---|---|---|---|---|---|
| 2011 Census | Albanians | Serbs | Turks | Bosniaks | Roma | Ashkali | Egyptians | Goran | Others | Not declared | ||||||||||||
| Municipality | Total | Number | % | Number | % | Number | % | Number | % | Number | % | Number | % | Number | % | Number | % | Number | % | Number | % | |
| Deçan (Deçan / Dečani) | 40,019 | 39,402 | 98.5 | 3 | 0.0 | 0 | 0.0 | 60 | 0.1 | 33 | 0.1 | 42 | 0.1 | 393 | 1.0 | 1 | 0.0 | 19 | 66 | 0.2 | ||
| Dragaš (Dragash / Dragaš) | 33,997 | 20,287 | 59.7 | 7 | 0.0 | 202 | 0.6 | 4,100 | 12.1 | 3 | 0.0 | 4 | 0.0 | 3 | 0.0 | 8,957 | 26.3 | 283 | 0.8 | 151 | 0.4 | |
| Ferizaj (Ferizaj / Uroševac) | 108,610 | 104,152 | 95.9 | 32 | 0.0 | 55 | 0.1 | 83 | 0.1 | 204 | 0.2 | 3,629 | 3.3 | 24 | 0.0 | 64 | 0.1 | 102 | 0.1 | 265 | 0.2 | |
| Gjakova (Gjakova / Đakovica) | 94,556 | 87,672 | 97.4 | 17 | 0.0 | 16 | 0.0 | 73 | 0.1 | 738 | 0.8 | 613 | 0.6 | 5,177 | 5.5 | 13 | 0.0 | 92 | 0.1 | 205 | 0.2 | |
| Gjilan (Gjilan / Gnjilane) | 90,178 | 87,814 | 97.4 | 624 | 0.7 | 978 | 1.1 | 121 | 0.1 | 361 | 0.4 | 15 | 0.0 | 1 | 0.0 | 69 | 0.1 | 95 | 0.1 | 100 | 0.1 | |
| Glogovac (Gllogoc/Drenas / Glogovac) | 58,531 | 58,445 | 99.9 | 2 | 0.0 | 5 | 0.0 | 14 | 0.0 | 0 | 0.0 | 0 | 0.0 | 3 | 0.0 | 0 | 0.0 | 22 | 0.0 | 41 | 0.1 | |
| Gračanica (Graçanica / Gračanica) | 10,675 | 2,474 | 23.2 | 7,209 | 67.7 | 15 | 0.1 | 15 | 0.1 | 745 | 7.0 | 104 | 1.0 | 3 | 0.0 | 3 | 0.0 | 45 | 0.4 | 43 | 0.4 | |
| Kosovo Polje (Fushë Kosovë / Kosovo Polje) | 34,827 | 30,275 | 86.9 | 321 | 0.9 | 62 | 0.2 | 34 | 0.1 | 436 | 0.3 | 3,230 | 9.3 | 282 | 0.3 | 15 | 0.0 | 131 | 0.4 | 41 | 0.1 | |
| Hani i Elezit (Elez Han) | 9,403 | 9,357 | 99.5 | 0 | 0.0 | 0 | 0.0 | 42 | 0.4 | 0 | 0.0 | 0 | 0.0 | 0 | 0.0 | 0 | 0.0 | 2 | 0.0 | 2 | 0.0 | |
| Istog(Istok) | 39,289 | 36,154 | 92.0 | 194 | 0.5 | 10 | 0.0 | 1,142 | 2.9 | 39 | 0.1 | 111 | 0.3 | 1,544 | 3.9 | 0 | 0.0 | 45 | 0.1 | 50 | 0.1 | |
| Junik | 6,084 | 6,069 | 99.8 | 0 | 0.0 | 0 | 0.0 | 0 | 0.0 | 0 | 0.0 | 0 | 0.0 | 0 | 0.0 | 0 | 0.0 | 4 | 0.0 | 11 | 0.2 | |
| Kaçanik (Kačanik) | 33,409 | 33,362 | 99.9 | 1 | 0.0 | 2 | 0.0 | 20 | 0.1 | 5 | 0.0 | 1 | 0.0 | 0 | 0.0 | 0 | 0.0 | 7 | 0.0 | 11 | 0.0 | |
| Kamenica (K. Kamenica) | 36,085 | 34,186 | 94.7 | 1,554 | 4.3 | 5 | 0.0 | 9 | 0.0 | 240 | 0.7 | 0 | 0.0 | 0 | 0.0 | 29 | 0.1 | 27 | 0.1 | 35 | 0.1 | |
| Klina | 38,496 | 37,216 | 96.7 | 98 | 0.3 | 3 | 0.0 | 20 | 0.1 | 78 | 0.2 | 85 | 0.2 | 934 | 2.4 | 0 | 0.0 | 23 | 0.1 | 39 | 0.1 | |
| Kllokot (Klokot) | 2,556 | 1,362 | 53.3 | 1,777 | 46.0 | 1 | 0.0 | 0 | 0.0 | 9 | 0.4 | 0 | 0.0 | 0 | 0.0 | 6 | 0.2 | 1 | 0.0 | |||
| Leposavić (Leposaviq / Leposavić)[b] | 18,700 | 300 | 1.6 | 18,000 | 96.3 | 0 | 0.0 | 0 | 0.0 | 0 | 0.0 | 0 | 0.0 | 0 | 0 | 0.0 | 0.0 | 400 | 2.1 | 0 | 0.0 | |
| Lipjan (Lipljan) | 57,605 | 54,467 | 94.6 | 513 | 0.9 | 128 | 0.2 | 42 | 0.1 | 342 | 0.6 | 1,812 | 3.1 | 4 | 0.0 | 6 | 0.0 | 260 | 0.5 | 31 | 0.1 | |
| Mališevo (Malisheva / Mališevo) | 54,613 | 54,501 | 99.9 | 0 | 0.0 | 0 | 0.0 | 15 | 0.0 | 26 | 0.0 | 5 | 0.0 | 0 | 0.0 | 0 | 0.0 | 8 | 0.0 | 58 | 0.1 | |
| Mamuša (Mamusha / Mamuša) | 5,507 | 327 | 5.9 | 0 | 0.0 | 5,182 | 93.2 | 1 | 0.0 | 39 | 0.7 | 12 | 0.2 | 0 | 0.0 | 0 | 0.0 | 0 | 0.0 | 0 | 0.0 | |
| Mitrovica (K. Mitrovica) | 71,909 | 69,497 | 96.6 | 14 | 0.0 | 518 | 0.7 | 416 | 0.6 | 528 | 0.7 | 647 | 0.9 | 6 | 0.0 | 23 | 0.0 | 47 | 0.1 | 213 | 0.3 | |
| North Mitrovica[b] | 29,460 | 4,900 | 16.6 | 22,530 | 76.5 | 210 | 0.7 | 1,000 | 3.4 | 200 | 0.7 | 40 | 0.1 | 0 | 0.0 | 580 | 2.0 | 0 | 0.0 | 0 | 0.0 | |
| Novo Brdo (Novobërdë / Novo Brdo) | 6,729 | 3,524 | 52.4 | 3,122 | 46.4 | 7 | 0.1 | 5 | 0.1 | 63 | 0.9 | 3 | 0.0 | 0 | 0.0 | 0 | 0.0 | 2 | 0.0 | 3 | 0.0 | |
| Obilić(Obiliq/Kastriot / Obilić) | 21,549 | 19,854 | 92.1 | 276 | 1.3 | 2 | 0.0 | 58 | 0.3 | 661 | 3.1 | 578 | 2.7 | 27 | 0.1 | 5 | 0.0 | 48 | 40 | 0.2 | ||
| Parteš (Partesh / Parteš) | 1,787 | 0 | 0.0 | 1,785 | 99.9 | 0 | 0.0 | 0 | 0.0 | 0 | 0.0 | 0 | 0.0 | 0 | 0.0 | 0 | 0.0 | 2 | 0.1 | 0 | 0.0 | |
| Peć (Peja / Peć) | 96,450 | 87,975 | 91.2 | 332 | 0.3 | 59 | 0.1 | 3,786 | 3.9 | 993 | 1.0 | 143 | 0.1 | 2,700 | 2.8 | 189 | 0.2 | 132 | 0.1 | 141 | 0.1 | |
| Podujevo (Besiane / Podujevo) | 88,499 | 87,523 | 98.9 | 12 | 0.0 | 5 | 0.0 | 33 | 0.0 | 74 | 0.1 | 680 | 0.8 | 2 | 0.0 | 0 | 0.0 | 43 | 0.0 | 127 | 0.1 | |
| Pristina (Prishtina / Priština) | 198,897 | 194,452 | 97.8 | 430 | 0.2 | 2,156 | 1.1 | 400 | 0.2 | 56 | 0.0 | 557 | 0.3 | 8 | 0.0 | 205 | 0.1 | 334 | 0.2 | 299 | 0.2 | |
| Prizren | 177,781 | 145,718 | 82.0 | 237 | 0.1 | 9,091 | 5.1 | 16,869 | 9.5 | 2,899 | 1.6 | 1,350 | 0.8 | 168 | 0.1 | 655 | 0.4 | 386 | 0.2 | 381 | 0.2 | |
| Rahovec (Orahovac) | 56,208 | 55,166 | 98.1 | 134 | 0.2 | 0.2 | 0.0 | 10 | 0.0 | 84 | 0.1 | 404 | 0.7 | 299 | 0.5 | 0 | 0.0 | 11 | 0.0 | 98 | 0.2 | |
| Ranilug (Ranilug) | 3,866 | 164 | 4.2 | 3,692 | 95.5 | 0 | 0.0 | 1 | 0.0 | 0 | 0.0 | 0 | 0.0 | 0 | 0.0 | 0 | 0.0 | 3 | 0.1 | 6 | 0.2 | |
| Štrpce (Shtërpcë / Štrpce) | 6,949 | 3,757 | 54.1 | 3,148 | 45.3 | 0 | 0.0 | 2 | 0.0 | 24 | 0.3 | 1 | 0.0 | 0 | 0.0 | 0 | 0.0 | 7 | 0.1 | 4 | 0.1 | |
| Štimlje (Shtime/ Štimlje) | 27,324 | 26,447 | 96.8 | 49 | 0.2 | 1 | 0.0 | 20 | 0.1 | 23 | 0.1 | 750 | 2.7 | 0 | 0.0 | 2 | 0.0 | 13 | 0.0 | 19 | 0.1 | |
| Skenderaj (Srbica) | 50,858 | 50,685 | 99.7 | 50 | 0.1 | 1 | 0.0 | 42 | 0.0 | 0 | 0.0 | 10 | 0.0 | 1 | 0.0 | 0 | 0.0 | 5 | 0.0 | 64 | 0.1 | |
| Suva Reka (Suharekë / Suva Reka) | 59,722 | 59,076 | 98.9 | 2 | 0.0 | 4 | 0.0 | 15 | 0.0 | 41 | 0.1 | 493 | 0.8 | 5 | 0.0 | 0 | 0.0 | 15 | 0.0 | 71 | 0.1 | |
| Vitina (Viti / Vitina) | 46,987 | 46,669 | 99.3 | 113 | 0.2 | 4 | 0.0 | 25 | 0.1 | 12 | 0.0 | 14 | 0.0 | 0 | 0.0 | 7 | 0.0 | 83 | 0.2 | 60 | 0.1 | |
| Vučitrn (Vushtrri / Vučitrn) | 69,870 | 68,840 | 98.5 | 384 | 0.5 | 278 | 0.4 | 33 | 0.0 | 68 | 0.1 | 143 | 0.2 | 1 | 0.0 | 3 | 0.1 | 50 | 0.1 | 70 | 0.1 | |
| Zubin Potok[b] | 14,900 | 1,000 | 6.7 | 13,900 | 93.9 | 0 | 0.0 | 0 | 0.0 | 0 | 0.0 | 0 | 0.0 | 0 | 0.0 | 0 | 0.0 | 0 | 0.0 | 0 | 0.0 | |
| Zveçan (Zvečan)[b] | 16,650 | 350 | 2.1 | 16,000 | 96.1 | 0 | 0.0 | 0 | 0.0 | 0 | 0.0 | 0 | 0.0 | 0 | 0.0 | 0 | 0.0 | 0 | 0.0 | 0 | 0.0 | |
| Kosovo | 1,819,604 | 1,623,419 | 90.0 | 80,000[b] | 4.4 | 19,002 | 1.1 | 28,506 | 1.6 | 9,024 | 0.5 | 15,476 | 0.9 | 11,585 | 0.6 | 10,826 | 0.6 | 3,052 | 0.2 | 2,752 | 0.2 | |
The 2000 Living Standard Measurement Survey by Statistical Office of Kosovo found an ethnic composition of the population as follows:
- 92% Albanians
- 8% others
A most comprehensive (October 2002) estimate (for the 1.9 million inhabitants) for these years:
During the Kosovo War in 1999, over 700,000 ethnic Albanians,[21] around 100,000 ethnic Serbs and more than 40,000 Bosniaks were forced out of Kosovo to neighbouring Albania, Macedonia, Montenegro, Bosnia and Serbia. After the United Nations took over administration of Kosovo following the war, the vast majority of the Albanian refugees returned. The largest diaspora communities of Kosovo Albanians are in Germany and Switzerland accounting for some 200,000 individuals each, or for 20% of the population resident in Kosovo.
Many non-Albanians – chiefly Serbs and Romani – fled or were expelled, mostly to the rest of Serbia at the end of the war, with further refugee outflows occurring as the result of sporadic ethnic violence. As of 2002, the number of registered refugees was around 250,000.[22][23][24] The non-Albanian population in Kosovo is now about half of its pre-war total. The largest concentration of Serbs in the province is in the north, but many remain in Kosovo Serb enclaves surrounded by Albanian-populated areas.
Languages
As defined by the Constitution of Kosovo, Albanian and Serbian are official languages in Kosovo. According to the 2011 census, almost 95% of the citizens speak Albanian as their native language, followed by South Slavic languages and Turkish. Due to North Kosovo's boycott of the census, Bosnian resulted in being the second-largest language after Albanian. However, Serbian is de facto the second most spoken language in Kosovo.
| Language | Native speakers[25] | % |
|---|---|---|
| Albanian | 1,644,865 | 94.5 |
| Bosnian | 28,989 | 1.7 |
| Serbian | 27,983 | 1.6 |
| Turkish | 19,568 | 1.1 |
| Romani | 5,860 | 0.3 |
| Other/Not specified | 12,560 | 0.7 |
Health
Harvard Medical School and NATO published a study on the impact of the conflict on Kosovo health system in 2014.[26] The data in the table below are from the Kosovo Agency of Statistics.
| Structure of group of diseases according to ICD-10 recorded in PHC in 2010 | ||||||
|---|---|---|---|---|---|---|
| Group of diseases | Number | Percentage | ||||
| Parasitic diseases | 53,762 | 28 | ||||
| Tumors/cancers | 2,943 | 1.5 | ||||
| Blood and homopotetic organ disease and immunity disorders | 5,091 | 2.6 | ||||
| Endocrinic disorder of feeding and metabolism | 25,212 | 13.1 | ||||
| Psychic and personality disorder | 13,488 | 7 | ||||
| SQN diseases | 15,490 | 8.1 | ||||
| Eye diseases | 21,320 | 11.1 | ||||
| Ear and mastoid process diseases | 18,989 | 9.9 | ||||
| Diseases of blood circulation system | 5,139 | 2.7 | ||||
| Diseases of respiratory system | 6,962 | 3.6 | ||||
| Diseases of digestive system | 3,192 | 1.7 | ||||
| Dermic and hypodermic tissue diseases | 1,453 | 0.8 | ||||
| Diseases of locomotor system and connective tissue | 1,775 | 0.9 | ||||
| Disease of urogenital system | 2,198 | 1.1 | ||||
| Pregnancy, delivery and maternity | 5,737 | 3 | ||||
| Certain states resulting from perinatal periods | 200 | 0.1 | ||||
| Inborn deformity, chromosomal deformities and anomalies | 248 | 0.1 | ||||
| Symptoms, indications, analyses and clinical abnormal ascertainments | 1,556 | 0.8 | ||||
| Injuries, poisoning, and other consequences caused by external factors | 2,871 | 1.5 | ||||
| External factors of morbidity and mortality 579 0.3 | 579 | 0.3 | ||||
| Factors influencing on health conditions and contact with health services | 3,948 | 2.1 | ||||
| Total | 192,154 | |||||
Migration
According to a 2015 report by Geoba.se, Kosovo's current net migration rate is at –3.72, ranking Kosovo 197th,[27] due to the ongoing political and economic crisis.
Religion
The country has no official religion. The constitution establishes Kosovo as a secular state that is neutral in matters of religious beliefs and where everyone is equal before the law and freedom to belief, conscience and religion is guaranteed.[28][29]
The 2011 Kosovo population census was largely boycotted by the Kosovo Serbs (who predominantly identify as Serbian Orthodox Christians), especially in North Kosovo,[30] leaving the Serb population underrepresented.[31] The results of the 2011 census gave the following religious affiliations for the population included in the census:[32]

| Religion | Population | % |
|---|---|---|
| Islam | 1,663,412 | 95.6% |
| Christianity | 64,275 38,438 25,837 | 3.7% 2.2% 1.5% |
| Other (specify) | 1,188 | 0.1% |
| No religion | 1,242 | 0.1% |
Not stated
|
9,708 7,213 2,495 | 0.6% 0.4% 0.1% |
| Total | 1,739,825 | 100% |
These figures do not represent individual sects operating in Kosovo such as Sufism or Bektashism which are sometimes classified generally under the category of "Islam."[33]
The Serb population is largely Serbian Orthodox. The Catholic Albanian communities are mostly concentrated in Gjakova, Prizren, Klina and a few villages near Peć and Vitina (see laramans). Slavic-speaking Catholics usually call themselves Janjevci or Kosovan Croats. Slavic-speaking Muslims in the south of Kosovo are known as the Gorani people.
Internally displaced persons
According to the CIA, as of 2013, there were 17,300 internally displaced persons, most of whom are Serbs displaced during the Kosovo War.[34]
See also
Notes and references
Notes
| b. | ^ Due to the boycott of the 2011 census by most municipalities in the Serb-inhabited north (see North Kosovo), the real number of the population of Leposavić, North Mitrovica, Zubin Potok and Zvečan is unknown. Estimates are taken according to a 2014 OSCE report.[35][36][37][38] |
References
- 1 2 3 4 5 6 7 "Demographics of Kosovo (2016)". Geoba.se. Archived from the original on 10 August 2017. Retrieved 29 August 2017.
- ↑ "Agjencia e Statistikave të Kosovës -". Esk.rks-gov.net. Archived from the original on 25 November 2013. Retrieved 29 August 2017.
- ↑ Kosovo's Birth Rate Falling but Still High at balkaninsight.com, 10-7-2008, retrieved 18-8-2018
- ↑ Low birth figures breed nationalist nervousness at Financial Times, 31-3-2010, retrieved 18-8-2018
- ↑ "Agjencia e Statistikave të Kosovës". Esk.rks-gov.net. Archived from the original on 2 November 2013. Retrieved 29 August 2017.
- 1 2 "ECMI: Minority figures in Kosovo census to be used with reservations". Infoecmi.eu. Archived from the original on 28 May 2017. Retrieved 29 August 2017.
- 1 2 3 "Agjencia e Statistikave të Kosovës -". esk.rks-gov.net. Archived from the original on 2 November 2013. Retrieved 29 August 2017.
- ↑ "Belgrade to Reject Results of U.N.-Conducted Census in Kosovo". English.people.com.cn. Archived from the original on 3 November 2013. Retrieved 29 August 2017.
- ↑ "Archived copy" (PDF). Archived from the original (PDF) on 20 September 2011. Retrieved 17 February 2015.
- ↑
- ↑
- ↑
- ↑ "Agjencia e Statistikave të Kosovës -". Esk.rks-gov.net. Archived from the original on 2 November 2013. Retrieved 29 August 2017.
- ↑ "Agjensia e Statistikave te Kosoves". Esk.rks-gov.net. Archived from the original on 2 November 2013. Retrieved 24 February 2013.
- ↑ "Statistikat e Popullsisë". Esk.rks-gov.net. Archived from the original on 13 June 2013. Retrieved 24 February 2013.
- ↑ "Agjencia e Statistikave të Kosovës". esk.rks-gov.net. Archived from the original on 2 November 2013. Retrieved 29 August 2017.
- ↑ "Archived copy" (PDF). Archived (PDF) from the original on 20 January 2018. Retrieved 20 January 2018.
- ↑ "Kosovo Agency of Statistics". Esk.rks-gov.net. Archived from the original on 2 November 2013. Retrieved 24 February 2013.
- ↑ "CIA- The World Factbook". Cia.gov. Archived from the original on 27 September 2011. Retrieved 24 February 2013.
- ↑ "People on Move,pg.20". Esk.rks-gov.net. Archived from the original on 10 April 2013. Retrieved 24 February 2013.
- ↑ "BBC News - World - Kosovo Albanians: Who's left?". News.bbc.co.uk. Archived from the original on 22 December 2006. Retrieved 29 August 2017.
- ↑ "Coordination Centre of Federal Republic of Yugoslavia and Republic of Serbia for Kosovo and Metohija". Archived from the original on 27 April 2012. Retrieved 23 February 2008.
- ↑ UNHCR: 2002 Annual Statistical Report: Serbia and Montenegro, pg. 9
- ↑ "USCR: Country Information: Yugoslavia". Web.archive.org. 29 October 2004. Archived from the original on 29 October 2004. Retrieved 29 August 2017.
- ↑ "Language in Kosovo". Kosovo Agency of Statistics. Archived from the original on 2015-02-17.
- ↑ "Health 2009". Esk.rks-gov.net. Archived from the original on 2 November 2013. Retrieved 24 February 2013.
- ↑ "The World: Net Migrants per 1000 (2015)". GEOBA.se. Archived from the original on 29 August 2017. Retrieved 29 August 2017.
- ↑ Jr, Henry H. Perritt (28 September 2009). "The Road to Independence for Kosovo: A Chronicle of the Ahtisaari Plan". Cambridge University Press – via Google Books.
- ↑ Naamat, Talia; Porat, Dina; Osin, Nina (19 July 2012). "Legislating for Equality: A Multinational Collection of Non-Discrimination Norms. Volume I: Europe". Martinus Nijhoff Publishers – via Google Books.
- ↑ Petrit Collaku (29 March 2011). "Kosovo Census to Start Without the North". Balkan Insight. Retrieved 17 December 2017.
- ↑ Perparim Isufi (14 September 2017). "Kosovo Police Stop 'Illegal' Serb Census Attempts". Balkan Insight. Retrieved 17 December 2017.
- ↑ "Kosovo Population and Housing Census 2011 - Final Results: Quality Report". unstats.un.org. United Nations Statistics Division. 2011. Archived from the original on 2 November 2016. Retrieved 17 December 2017.
- ↑ "The influence of Sufi Islam in the Balkans". Euobserver.com. Archived from the original on 10 October 2017. Retrieved 29 August 2017.
- ↑
17,300 (primarily ethnic Serbs displaced during the 1998-1999 war fearing reprisals from the majority ethnic-Albanian population; a smaller number of ethnic Serbs, Roma, Ashkali, and Egyptians fled their homes in 2004 as a result of violence) (2013 est.)
- ↑ "OSCE Leposavic estimates". OSCE. Archived from the original on 4 March 2016.
- ↑ "OSCE Mitrovica North estimate". OSCE. Archived from the original on 4 March 2016.
- ↑ "OSCE Zubin Potok estimate". OSCE. Archived from the original on 4 March 2016.
- ↑ "OSCE Zvecan estimates". OSCE. Archived from the original on 4 March 2016.
Sources
- Ocić, Časlav (2006). "Kosovo and Metohia: Ethnodemographic Changes from the End of World War II to 1991". Срби на Косову и у Метохији: Зборник радова са научног скупа (PDF). Београд: Српска академија наука и уметности. pp. 441–460.
External links
- Statistical Office of Kosovo
- Filling the Vacuum: Ensuring Protection and Legal Remedies for Minorities in Kosovo by Minority Rights Group International (May 2009)
- Groups working with all demographics in Kosovo
| ||
Minorities
| ||