Languages of the United States
Although the United States does not have an official language, the most commonly used language is English (specifically, American English), which is the de facto national language. Many other languages are also spoken in the United States, especially Spanish. These include indigenous languages, languages brought to the country by colonists, enslaved people and immigrants from Europe, Africa and Asia. There are also several languages, including creoles and sign languages, that developed in the United States. Approximately 430 languages are spoken or signed by the population, of which 176 are indigenous to the area. Fifty-two languages formerly spoken in the country's territory are now extinct.[5]
Most common languages
Based on annual data from the American Community Survey (ACS), the U.S. Census Bureau regularly publishes information on the most common languages spoken at home. It also reports the English speaking ability of people who speak a language other than English at home.[6] In 2017, the U.S. Census Bureau published information on the number of speakers of over 350 languages as surveyed by the ACS from 2009 to 2013,[7][8] but it does not regularly tabulate and report data for that many languages.
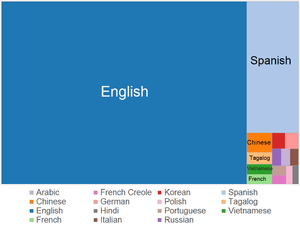
According to the ACS in 2017, the most common languages spoken at home by people aged five years of age or older are as follows:[9][10]
- English only – 239 million
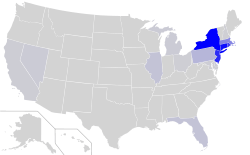
- Spanish – 41 million
- Chinese (including Mandarin and Cantonese) – 3.5 million
- Tagalog (including Filipino) – 1.7 million
- Vietnamese – 1.5 million
- Arabic – 1.2 million
- French – 1.2 million
- Korean – 1.1 million
- Russian – 0.94 million
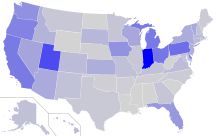
- German – 0.92 million
- Haitian Creole – 0.87 million
- Hindi – 0.86 million
- Portuguese – 0.79 million
- Italian – 0.58 million
- Polish – 0.52 million
- Urdu – 0.51 million
- Yiddish – 0.51 million
- Japanese – 0.46 million
- Persian (including Farsi, Dari and Tajik) – 0.42 million
- Gujarati – 0.41 million
- Telugu – 0.37 million
- Bengali – 0.32 million
- Tai–Kadai (including Thai and Lao) – 0.31 million
- Urdu – 0.3 million
- Greek – 0.27 million
- Punjabi – 0.29 million
- Tamil – 0.27 million
- Armenian – 0.24 million
- Serbo-Croatian (including Bosnian, Croatian, Montenegrin, and Serbian) – 0.24 million
- Hebrew – 0.23 million
- Hmong – 0.22 million
- Bantu languages (including Swahili) – 0.22 million
- Khmer – 0.20 million
- Navajo – 0.16 million
- other Indo-European languages – 578,492
- other Afro-Asiatic languages – 521,932
- other Niger–Congo languages – 515,629
- other West Germanic languages – 487,675
- other Austronesian languages – 467,718
- other Indic languages – 409,631
- other languages of Asia – 384,154
- other Slavic languages – 338,644
- other Dravidian languages – 241,678
- other languages of North America – 195,550
- other and unspecified languages – 258,257
The ACS is not a full census but an annual sample-based survey conducted by the U.S. Census Bureau. The language statistics are based on responses to a three-part question asked about all members of a target U.S. household who are at least five years old. The first part asks if they "speak a language other than English at home." If so, the head of the household or main respondent is asked to report which language each member speaks in the home, and how well each individual speaks English. It does not ask how well individuals speak any other language of the household. Thus, some respondents might have only a limited speaking ability of that language.[11] In addition, it is difficult to make historical comparisons of the numbers of speakers because language questions used by the U.S. Census changed numerous times before 1980.[12]
The ACS does not tabulate the number of people who report the use of American Sign Language at home, so such data must come from other sources. While modern estimates indicate that American Sign Language was signed by as many as 500,000 Americans in 1972 (the last official survey of sign language), estimates as recently as 2011 were closer to 100,000. Various cultural factors, such as the passage of the Americans with Disabilities Act, have resulted in far greater educational opportunities for hearing-impaired children, which could double or triple the number of current users of American Sign Language.
English is the most common language spoken in the United States with approximately 239 million speakers. Spanish is spoken by approximately 35 million people.[13] The United States has the world's fifth largest Spanish-speaking population, outnumbered only by Mexico, Colombia, Spain, and Argentina; other estimates put the United States at over 50 million, second only to Mexico. Throughout the Southwestern United States, long-established Spanish-speaking communities coexist with large numbers of more recent Hispanophone immigrants. Although many new Latin American immigrants are less than fluent in English, nearly all second-generation Hispanic Americans speak English fluently, while only about half still speak Spanish.[14]
According to the 2000 U.S. Census, people of German ancestry made up the largest single ethnic group in the United States, but German language ranked fifth.[15][16] Italian, Polish, and French are still widely spoken among populations descending from immigrants from those countries in the early 20th century, but the use of these languages is dwindling as the older generations die. Russian is also spoken by immigrant populations.
Tagalog and Vietnamese have over one million speakers each in the United States, almost entirely within recent immigrant populations. Both languages, along with the varieties of Chinese (mostly Cantonese, Taishanese, and Standard Mandarin), Japanese, and Korean, are now used in elections in Alaska, California, Hawaii, Illinois, New York, Texas, and Washington.[17]
Native American languages are spoken in smaller pockets of the country, but these populations are decreasing, and the languages are almost never widely used outside of reservations. Besides English, Spanish, French, German, Navajo and other Native American languages, all other languages are usually learned from immigrant ancestors that came after the time of independence or learned through some form of education.
American Sign Language is the most common sign language in the United States although there are unrelated sign languages which have been developed in the States and its territories—mostly in the Pacific. No concrete numbers exist for signers but something upwards of 250,000 is common.
Official languages
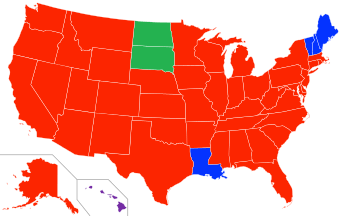
The United States has never had an official language at the federal level.[18] However, 32 states of the United States, in some cases as part of what has been called the English-only movement, have adopted legislation granting official status to English. Out of 50 states, 30 have established English as the only official language,[19] [20] while Hawaii recognizes both English and Hawaiian as official, and Alaska has made some 20 native languages official, along with English;[21] [22] for example, Alaska provides voting information in English, Iñupiaq, Central Yup'ik, Gwich'in, Siberian Yupik, Koyukon, and Tagalog.[23] On July 1, 2019, a law went into effect making Lakota, Dakota, and Nakota the official indigenous languages of South Dakota.[24]
Moreover, English is one of the official languages in all of the U.S. territories. In Puerto Rico both English and Spanish are official, although Spanish has been declared the principal official language. The school system and the government operate almost entirely in Spanish. Guam recognizes English and Chamorro. In the U.S. Virgin Islands, English is the only official language. In American Samoa, both English and Samoan are officially recognized. In the Northern Mariana Islands, English, Chamorro, and Carolinian are official.
English is the primary language used for legislation, regulations, executive orders, treaties, federal court rulings, and all other official pronouncements. Nonetheless, laws require documents such as ballots to be printed in multiple languages when there are large numbers of non-English speakers in an area. U.S. schools, public as well as private, require English classes at every grade level, even in bilingual or dual-language learning situations. Semesters of English composition are compulsory in virtually all U.S. colleges and universities to satisfy requirements for associate's and bachelor's degrees.
The government of Louisiana offers services and most documents in both English and French, and New Mexico does so in English and Spanish. The government of Puerto Rico, a U.S. territory, operates almost entirely in Spanish, even though its official languages are Spanish and English. Hawaiian, although having few native speakers, is an official language along with English of the state of Hawaii. Alaska officializes English and twenty native languages.
In New Mexico, although the state constitution does not specify an official language, laws are published in English and Spanish, and government materials and services are legally required (by Act) to be made accessible to speakers of both languages as well as Navajo and various Pueblo languages. New Mexico also has its own dialect of Spanish, which differs from Spanish spoken in the rest of Latin America.
Native American languages are official or co-official on many of the U.S. Indian reservations and Pueblos. In Oklahoma before statehood in 1907, territory officials debated whether or not to have Cherokee, Choctaw, and Muscogee languages as co-official, but the idea never gained ground. Cherokee is officially recognized by the Cherokee Nation within the Cherokee tribal jurisdiction area in eastern Oklahoma.[25]
After New Amsterdam (formerly a Dutch colony) was transferred to English administration (becoming the Province of New York) in the late 17th century, English supplanted Dutch as the official language. However, "Dutch remained the primary language for many civil and ecclesiastical functions and most private affairs for the next century."[26] The Jersey Dutch dialect is now extinct.
California has agreed to allow the publication of state documents in other languages to represent minority groups and immigrant communities. Languages such as Spanish, Chinese, Korean, Tagalog, Persian, Russian, Vietnamese, and Thai appear in official state documents, and the Department of Motor Vehicles publishes in nine languages.[27]
The issue of multilingualism also applies in the states of Arizona and Texas. While the constitution of Texas has no official language policy, Arizona passed a proposition in 2006 declaring English as the official language.[28] Nonetheless, Arizona law requires the distribution of voting ballots in Spanish, as well as indigenous languages such as Navajo, O'odham and Hopi, in counties where they are spoken.[29]
A popular urban legend called the Muhlenberg legend claims that German was almost made an official language of the United States but lost by one vote. In reality, it was a request by a group of German immigrants to have an official translation of laws into German. House speaker Frederick Muhlenberg has since become associated with the legend.[30][31][32]
Indigenous languages
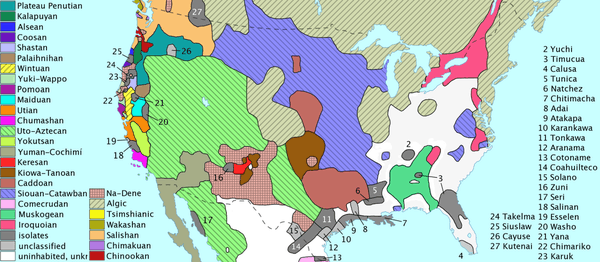
Native American languages
Native American languages predate European settlement of the New World. In a few parts of the U.S. (mostly on Indian reservations), they continue to be spoken fluently. Most of these languages are endangered, although there are efforts to revive them. Normally the fewer the speakers of a language the greater the degree of endangerment, but there are many small Native American language communities in the Southwest (Arizona and New Mexico) which continue to thrive despite their small size. In 1929, speaking of indigenous Native American languages, linguist Edward Sapir observed:[33]
Few people realize that within the confines of the United States there is spoken today a far greater variety of languages ... than in the whole of Europe. We may go further. We may say, quite literally and safely, that in the state of California alone there are greater and more numerous linguistic extremes than can be illustrated in all the length and breadth of Europe.
Navajo
According to the 2000 Census and other language surveys, the largest Native American language-speaking community by far is the Navajo. Navajo is an Athabaskan language of the Na-Dené family, with 178,000 speakers, primarily in the states of Arizona, New Mexico, and Utah. Altogether, Navajo speakers make up more than 50% of all Native American language speakers in the United States. Western Apache, with 12,500 speakers, also mostly in Arizona, is closely related to Navajo but not mutually intelligible with it. Navajo and other Athabaskan languages in the Southwest are relative outliers; most other Athabascan languages are spoken in the Pacific Northwest and Alaska. Navajo has struggled to keep a healthy speaker base, although this problem has been alleviated to some extent by extensive education programs in the Navajo Nation, including a Navajo language immersion school in Fort Defiance, Arizona.
Cherokee

Cherokee is the Iroquoian language spoken by the Cherokee people, and the official language of the Cherokee Nation.[34] Significant numbers of Cherokee speakers of all ages[35] still populate the Qualla Boundary in Cherokee, North Carolina and several counties within the Cherokee Nation of Oklahoma, significantly Cherokee, Sequoyah, Mayes, Adair, and Delaware. Increasing numbers of Cherokee youth are renewing interest in the traditions, history, and language of their ancestors.[35] Cherokee-speaking communities stand at the forefront of language preservation, and at local schools, all lessons are taught in Cherokee and thus it serves as the medium of instruction from pre-school on up.[34] Also, church services and traditional ceremonial "stomp" dances are held in the language in Oklahoma and on the Qualla Boundary in North Carolina.[34]
Cherokee is one of the few, or perhaps the only, Native American language with an increasing population of speakers,[36] and along with Navajo it is the only indigenous American language with more than 50,000 speakers,[37] a figure most likely achieved through the tribe's 10-year long language preservation plan involving growing new speakers through immersion schools for children,[38][39] developing new words for modern phrases, teaching the language to non-Cherokee in schools and universities,[40] fostering the language among young adults so their children can use that language at home, developing iPhone and iPad apps for language education, the development of Cherokee language radio stations including Cherokee Voices, Cherokee Sounds,[41] and promoting the writing system through public signage, products like the Apple iPhone, internet use through Google including Gmail, and others so the language remains relevant in the 21st century.
Other Native American languages
Dakota is a Siouan language with 18,000 speakers in the US alone (22,000 including speakers in Canada), not counting 6,000 speakers of the closely related Lakota. Most speakers live in the states of North Dakota and South Dakota. Other Siouan languages include the closely related Winnebago, and the more distant Crow, among others.
Central Alaskan Yup'ik is an Eskimo-Aleut language with 16,000 speakers, most of whom live in Alaska. The term "Yupik" is applied to its relatives, which are not necessarily mutually intelligible with Central Alaskan, including Naukan and Central Siberian, among others.
The O'odham language, spoken by the Pima and the Tohono O'odham, is a Uto-Aztecan language with more than 12,000 speakers, most of whom live in central and southern Arizona and northern Sonora. Other Uto-Aztecan languages include Hopi, Shoshone, and the Pai-Ute languages.
Choctaw has 11,000 speakers. Choctaw is part of the Muskogean family, like Seminole and Alabama.
The Algonquian language family includes languages like Chippewa/Ojibwe, Cheyenne, and Cree.
Keres has 11,000 speakers in New Mexico and is a language isolate. The Keres pueblo people are the largest of the Pueblo nations. The Keres pueblo of Acoma is the oldest continually inhabited community in the United States. Zuni, another isolate, has around 10,000 speakers, most of whom reside within the Zuni pueblo.
Although the languages of the Americas have a history stretching back about 17,000 to 12,000 years, current knowledge of them is limited. There are doubtlessly a number of undocumented languages that were once spoken in the United States that are missing from historical record.
List of Native American languages
Below is an estimate of Native American languages "spoken at home" in the United States (American Community Survey 2006–2008).[42] This is not an exhaustive list of Native American languages in the US. Because the distinction between dialect and language isn't always clear, multiple dialects of varying mutual intelligibility may be classified as a single language, while a group of effectively identical dialects may be classified separately for historical or cultural reasons. Languages included here may be classified as "extinct" (having no living native speakers), but many extinct or moribund Native American languages are the subjects of ongoing language revitalization efforts; other extinct languages undergoing revitalization might not be listed here.
| Language | Endonym[43] | Family | Speakers (% of total) | Speaks English "Very Well"[44] |
|---|---|---|---|---|
| Total | — | — | 444 124 (100) | 19.22% |
| Total (excl. Navajo) | — | — | 203 127 (54.32) | 15.82% |
| Navajo | Diné bizaad | Na-Dené | 170 822 (45.68) | 23.25% |
| Virgin Islands Creole | — | English Creole | 76,208 (17.15) | 100.00%? |
| Dakota | Dakȟótiyapi | Siouan | 18 804 (5.03) | 9.86% |
| Yupik | — | Eskimo-Aleut | 18 626 (4.98) | 37.02% |
| O'odham | — | Uto-Aztecan | 15 123 (3.59) | 8.03% |
| Apache | Ndee biyati' | Na-Dené | 14 012 (3.75) | 3.53% |
| Keres | — | Isolate | 13 073 (3.50) | 6.20% |
| Cherokee | Tsalagi (ᏣᎳᎩ) | Iroquoian | 12 320 (3.29) | 16.33% |
| Choctaw | Chahta' | Muskogean | 10 368 (2.77) | 23.44% |
| Zuni | Shiwi'ma | Isolate | 9 432 (2.52) | 14.22% |
| American Indian (Other) | — | — | 8 888 (2.38) | 16.73% |
| O'odham (Pima) | Oʼodham ñiʼokĭ | Uto-Aztecan | 8 190 (2.19) | 14.70% |
| Ojibwe (Chippewa) | Anishinaabemowin | Algic | 6 986 (1.87) | 11.28% |
| Hopi | Hopilàvayi | Uto-Aztecan | 6 776 (1.81) | 18.80% |
| Inupiat (Inupik) | Iñupiatun | Eskimo-Aleut | 5 580 (1.49) | 26.04% |
| Tewa | — | Tanoan | 5 123 (1.37) | 13.80% |
| Muskogee (Creek) | Mvskoke | Muskogean | 5 072 (1.36) | 19.62% |
| Crow | Apsáalooke | Siouan | 3 962 (1.06) | 6.59% |
| Shoshoni | Sosoni' da̲i̲gwape | Uto-Aztecan | 2 512 (0.67) | 7.25% |
| Cheyenne | Tsėhésenėstsestȯtse | Algic | 2 399 (0.64) | 3.21% |
| Tiwa | — | Tanoan | 2 269 (0.61) | 3.22% |
| Towa (Jemez) | — | Tanoan | 2 192 (0.59) | 27.65% |
| Inuit (Eskimo) | — | Eskimo-Aleut | 2 168 (0.58) | 25.46% |
| Blackfoot | Siksiká (ᓱᖽᐧᖿ) | Algic | 1 970 (0.53) | 11.02% |
| Sahaptin | Ichishkíin sɨ́nwit | Plateau Penutian | 1 654 (0.44) | 6.17% |
| Paiute | — | Uto-Aztecan | 1 638 (0.44) | 11.78% |
| Athapascan | — | Na-Dené | 1 627 (0.44) | 19.55% |
| Ute | Núu-'apaghapi | Uto-Aztecan | 1 625 (0.43) | 5.23% |
| Southern Tiwa | — | Tanoan | 1 600 (0.42) | |
| Mohawk | Kanien’kéha' | Iroquoian | 1 423 (0.38) | 11.67% |
| Seneca | Onödowága | Iroquoian | 1 353 (0.36) | 11.23% |
| Winnebago | Hocąk | Siouan | 1 340 (0.36) | 6.27% |
| Kiowa | Cáuijògà | Tanoan | 1 274 (0.34) | 9.58% |
| Aleut | Unangam tunuu | Eskimo-Aleut | 1 236 (0.33) | 19.01% |
| Salish | — | Salishan | 1 233 (0.33) | 22.87% |
| Gwich’in (Kuchin) | Gwich’in | Na-Dené | 1 217 (0.33) | 25.82% |
| Kickapoo | Kiwikapawa | Algic | 1 141 (0.31) | 41.72% |
| Arapaho | Hinónoʼeitíít | Algic | 1 087 (0.29) | 1.20% |
| Tlingit | Lingít | Na-Dené | 1 026 (0.27) | 8.19% |
| Siberian Yupik (SLI Yupik) | Sivuqaghmiistun | Eskimo-Aleut | 993 (0.27) | 39.48% |
| Passamaquoddy | Peskotomuhkat | Algic | 982 (0.26) | 6.11% |
| Comanche | Nʉmʉ tekwapʉ | Uto-Aztecan | 963 (0.26) | 10.59% |
| Cree | Nēhiyawēwin | Algic | 951 (0.25) | 8.73% |
| Menominee | Omāēqnomenew | Algic | 946 (0.25) | 39.64% |
| Nez Perce | Niimiipuutímt | Plateau Penutian | 942 (0.25) | 12.10% |
| Potawatomi | Bodéwadmi | Algic | 824 (0.22) | 9.95% |
| Hidatsa | Hidatsa | Siouan | 806 (0.22) | 4.47% |
| Kickapoo | — | Algic | 800 (0.22) | |
| Mesquakie (Fox) | Meshkwahkihaki | Algic | 727 (0.19) | 22.15% |
| Karok | Káruk | Isolate | 700 (0.19) | 5.43% |
| Pomo | — | Pomoan | 648 (0.17) | 14.81% |
| Chinook Jargon | Chinuk wawa | Creole | 644 (0.17) | 17.70% |
| Oneida | Oneyota'aaka | Iroquoian | 527 (0.14) | 58.63% |
| Yurok | Puliklah | Algic | 491 (0.13) | 1.63% |
| Cocopah | Kwikapa | Yuman | 483 (0.13) | 22.77% |
| Hualapai | Hwalbáy | Yuman | 458 (0.12) | 4.80% |
| Omaha | Umoⁿhoⁿ | Siouan | 457 (0.12) | 1.97% |
| Chiricahua | Ndee bizaa | Na-Dené | 457 (0.12) | — |
| Jicarilla | Abáachi mizaa | Na-Dené | 455 (0.12) | 14.51% |
| Yaqui | Yoem noki | Uto-Aztecan | 425 (0.11) | 10.12% |
| Yokuts | — | Yokutsan | 407 (0.11) | 27.27% |
| Koasati | Coushatta | Muskoeaen | 370 (0.10) | — |
| Mono | Mono | Uto-Aztecan | 349 (0.09) | — |
| Mohave | Hamakhav | Yuman | 330 (0.09) | 6.36% |
| Luiseño | Cham'teela | Uto-Aztecan | 327 (0.09) | 4.28% |
| Shawnee | Sawanwa | Algic | 321 (0.09) | 6.23% |
| Maidu (NE Maidu) | Májdy | Maiduan | 319 (0.09) | 6.90% |
| Ottawa | Nishnaabemwin | Algic | 312 (0.08) | 10.90% |
| Algonquin | Anicinâbemowin | Algic | 288 (0.08) | 19.79% |
| Okanogan | Nsəlxcin | Salishan | 284 (0.08) | 10.92% |
| Osage | Wazhazhe ie | Siouan | 260 (0.07) | 20.38% |
| Wichita | Kirikirʔi:s | Caddoan | 242 (0.06) | 16.12% |
| Onondaga | Onǫda’gegá | Iroquoian | 239 (0.06) | 2.93% |
| Mi'kmaq (Micmac) | Míkmawísimk | Algic | 230 (0.06) | 10.87% |
| Digueño (Ipai-Kumiai-Tipai) | — | Yuman | 228 (0.06) | 60.96% |
| Washo | Wá:šiw ʔítlu | Isolate | 227 (0.06) | 9.69% |
| Miwok | Miwok | Utian | 216 (0.06) | — |
| Lushootseed (Puget Salish) | Xʷəlšucid | Salishan | 207 (0.06) | 47.83% |
| Kutenai | Ktunaxa | Isolate | 200 (0.05) | 32.50% |
| Miccosukee | Mikisúkî | Muskogean | 188 (0.05) | 22.87% |
| Tuscarora | Ska:rù:rę' | Iroquoian | 179 (0.05) | 10.06% |
| Makah | Qʷi·qʷi·diččaq | Wakashan | 176 (0.05) | 30.11% |
| Coeur d'Alene | Snchitsuʼumshtsn | Salishan | 174 (0.05) | — |
| Hupa | Na:tinixwe | Na-Dené | 174 (0.05) | — |
| Quechan (Yuma) | Kwtsaan | Yuman | 172 (0.05) | 31.98% |
| Miami | Myaamia | Algic | 168 (0.04) | 50.60% |
| Alabama | Albaamo innaaɬiilka | Muskogean | 165 (0.04) | 20.00% |
| Delaware | Lënape / Lunaapeew | Algic | 146 (0.04) | 25.34% |
| Clallam | Nəxʷsƛ̕ay̕əmúcən | Salishan | 146 (0.04) | 1.37% |
| Penobscot (E Abenaki) | Panawahpskek | Algic | 144 (0.04) | 5.56% |
| Yavapai | — | Yuman | 139 (0.04) | — |
| Cahuilla | Ivia | Uto-Aztecan | 139 (0.04) | — |
| Ponca | Paⁿka | Siouan | 131 (0.04) | 6.87% |
| Quinault | Kʷínaył | Salishan | 128 (0.03) | — |
| Deg Xinag (Ingalit) | Degexit’an | Na-Dené | 127 (0.03) | — |
| Pawnee | Paári | Caddoan | 122 (0.03) | 16.39% |
| Haida | X̱aat Kíl | Isolate | 118 (0.03) | 19.49% |
| Cowlitz | Stl'pulimuhkl | Salishan | 110 (0.03) | 82.73% |
| Mandan | Nų́ʔetaːre | Siouan | 104 (0.03) | 38.46% |
| Arikara | Sáhniš | Caddoan | 103 (0.03) | — |
| Klamath | Maqlaqs | Plateau Penutian | 95 (0.03) | 27.37% |
| Havasupai | Havasu’baaja | Yuman | 90 (0.02) | 52.22% |
| Chitimacha | Sitimaxa | Isolate | 89 (0.02) | 21.35% |
| Abenaki (W Abenaki) | Wôbanakiôdwawôgan | Algic | 86 (0.02) | — |
| Kwak'wala (Kwakiutl) | Kwak'wala | Wakashan | 85 (0.02) | 24.71% |
| Tututni (Rogue River) | Dotodəni | Na-Dené | 84 (0.02) | — |
| Iroquois | — | Iroquoian | 76 (0.02) | — |
| Michif (French Cree) | Michif | Creole | 75 (0.02) | 70.67% |
| Tsimshian | Sm'algyax | Tsimshianic | 68 (0.02) | — |
| Achumawi | — | Palaihnihan | 68 (0.02) | — |
| Chiwere | Jíwere | Siouan | 60 (0.02) | — |
| Koasati | Kowassá:ti | Muskogean | 59 (0.02) | 6.78% |
| Koyukon | Denaakkʼe | Na-Dené | 58 (0.02) | 12.07% |
| Upper Chinook | Kiksht | Chinookan | 58 (0.02) | 10.34% |
| Caddo | Hasí:nay | Caddoan | 51 (0.01) | 23.53% |
| Kalapuya (Santiam) | — | Kalapuyan | 50 (0.01) | — |
| Gros Ventre (Atsina) | Ahahnelin | Algic | 45 (0.01) | — |
| Tachi | — | Yokutsan | 45 (0.01) | 57.78% |
| Maricopa | Piipaash chuukwer | Yuman | 44 (0.01) | 22.73% |
| Chumash | S.hamala | Chumashan | 39 (0.01) | 100.00% |
| Nomlaki | Nomlāqa | Wintuan | 38 (0.01) | — |
| Konkow (NW Maidu) | Koyoom k'awi | Maiduan | 32 | 100.00% |
| Tunica | Yuron | Isolate | 32 | — |
| Tonkawa | Tickanwa•tic | Isolate | 29 | — |
| Caddo | — | Caddoan | 25 | — |
| Wintu | Wintʰu:h | Wintuan | 24 | — |
| Spokane | Npoqínišcn | Salishan | 20 | 40.00% |
| Ahtna | Atnakenaege’ | Na-Dené | 18 | — |
| Columbia (Sinkiuse) | Nxaảmxcín | Salishan | 17 | — |
| Atsugewi | Atsugé | Palaihnihan | 15 | — |
| Chemehuevi | Nüwüvi | Uto-Aztecan | 15 | — |
| Abenaki | — | Algic | 14 | — |
| Northern Paiute | Numu | Uto-Aztecan | 12 | — |
| Dena'ina (Tanaina) | Dena’ina qenaga | Na-Dené | 11 | — |
| Cupeño | Kupangaxwicham | Uto-Aztecan | 11 | — |
| Nuu-chah-nulth (Nootka) | Nuučaan̓uł | Wakashan | 10 | — |
| Pawnee | Chatiks si chatiks | Caddoan | 10 | |
| Arikara | Sanish | Caddoan | 10 | |
| Alutiiq (Gulf Yupik) | Sugpiaq | Eskimo-Aleut | 8 | — |
| Kansa | Káⁿza | Siouan | 7 | — |
| Siuslaw | Šáayušła | Isolate | 6 | — |
| Cayuga | Gayogo̱hó:nǫ’ | Iroquoian | 6 | — |
| Serrano | Taaqtam | Uto-Aztecan | 5 | — |
| Tübatulabal | — | Uto-Aztecan | 5 | — |
| Yuchi | Tsoyaha | Isolate | 4 | — |
| Shasta | — | Shastan | 2 | 100.00% |
| Wukcumni | — | Yokutsan | 1 | 0.00% |
| Quapaw | — | Siouan | 1 | — |
Native American sign languages
A sign-language trade pidgin, known as Plains Indian Sign Language, Plains Standard or Plains Sign Talk, arose among the Native Americans of the plains. Each signing nation had a separate signed version of their oral language, that was used by the hearing, and these were not mutually intelligible. Plains Standard was used to communicate between these nations. It seems to have started in Texas and then spread north, through the Great Plains, as far as British Columbia. There are still a few users today, especially among the Crow, Cheyenne, and Arapaho. Unlike other sign languages developed by hearing people, it shares the spatial grammar of deaf sign languages. Through intergenerational transmission, Plains Sign Talk became a working language still in use today in some Deaf First Nations or Native American communities.
As Plains Sign Talk was so widespread and was a spectrum of dialects and accents, it probably hosted several languages under its umbrella. One is potentially Navajo Sign Language which is in use by a sole Navajo clan.
Additionally, Plateau Sign Language existed alongside Plains Sign Talk as either a trade pidgin or another language around the Columbia Plateau and surrounding regions.
Austronesian languages
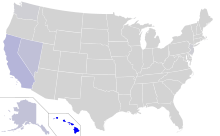
Hawaiian
Hawaiian is an official state language of Hawaii as prescribed in the Constitution of Hawaii. Hawaiian has 1,000 native speakers. Formerly considered critically endangered, Hawaiian is showing signs of language renaissance. The recent trend is based on new Hawaiian language immersion programs of the Hawaii State Department of Education and the University of Hawaii, as well as efforts by the Hawaii State Legislature and county governments to preserve Hawaiian place names. In 1993, about 8,000 could speak and understand it; today estimates range up to 27,000. Hawaiian is related to the Māori language spoken by around 150,000 New Zealanders and Cook Islanders as well as the Tahitian language which is spoken by another 120,000 people of Tahiti.
Samoan
Samoan is an official territorial language of American Samoa. Samoans make up 90% of the population, and most people are bilingual.
Chamorro
Chamorro is co-official in the Mariana Islands, both in the territory of Guam and in the Commonwealth of the Northern Mariana Islands. In Guam, the indigenous Chamorro people make up about 60% of the population.
Carolinian
Carolinian is also co-official in the Northern Marianas, where only 14% of people speak English at home.
African, Asian and European languages

Some of the first European languages to be spoken in the U.S. were English, Dutch, French, Spanish, and Swedish.
From the mid-19th century on, the nation had large numbers of immigrants who spoke little or no English, and throughout the country state laws, constitutions, and legislative proceedings appeared in the languages of politically important immigrant groups. There have been bilingual schools and local newspapers in such languages as German, Ukrainian, Hungarian, Irish, Italian, Norwegian, Greek, Polish, Swedish, Romanian, Czech, Japanese, Yiddish, Hebrew, Lithuanian, Welsh, Cantonese, Bulgarian, Dutch, Portuguese and others, despite opposing English-only laws that, for example, illegalized church services, telephone conversations, and even conversations in the street or on railway platforms in any language other than English, until the first of these laws was ruled unconstitutional in 1923 (Meyer v. Nebraska).
Currently, Asian languages account for the majority of languages spoken in immigrant communities: Korean, the varieties of Chinese, and various Indian or South Asian languages like Hindi,[46] Urdu, Punjabi, Kannada, Gujarati, Marathi, Bengali, Telugu, Tamil and Malayalam, as well as Arabic, Vietnamese, Tagalog, Persian, and others.
Typically, immigrant languages tend to be lost through assimilation within two or three generations, though there are some groups such as the Louisiana Creoles (French), Pennsylvania Dutch (German) in a state where large numbers of people were heard to speak it before the 1950s, and the original settlers of the Southwest (Spanish) who have maintained their languages for centuries.
English

English was inherited from British colonization, and it is spoken by the majority of the population. It serves as the de facto national language, the language in which government business is carried out. According to the U.S. Census Bureau, 80% spoke only English at home and all but approximately 13,600,000 U.S. residents age 5 and over speak English "well" or "very well".[47]
American English is different from British English in terms of spelling (one example being the dropped "u" in words such as color/colour), grammar, vocabulary, pronunciation, and slang usage. The differences are not usually a barrier to effective communication between an American English and a British English speaker.
Some states, like California, have amended their constitutions to make English the only official language, but in practice, this only means that official government documents must at least be in English, and does not mean that they should be exclusively available only in English. For example, the standard California Class C driver's license examination is available in 32 different languages.[48]
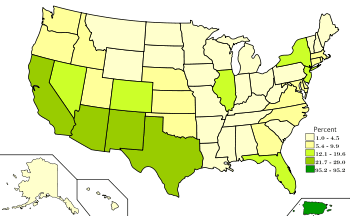
Spanish
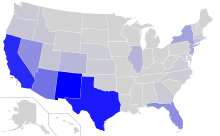
Spanish was also inherited from colonization and is sanctioned as official in the commonwealth of Puerto Rico. Spanish is also taught in various regions as a second language, especially in areas with large Hispanic populations such as the Southwestern United States along the border with Mexico, as well as Florida, parts of California, the District of Columbia, Illinois, New Jersey, and New York. In Hispanic communities across the country, bilingual signs in both Spanish and English may be quite common. Furthermore, numerous neighborhoods exist (such as Washington Heights in New York City or Little Havana in Miami) in which entire city blocks will have only Spanish language signs and Spanish-speaking people.
| Year | Number of Spanish speakers | Percent of US population |
|---|---|---|
| 1980 | 11 million | 5% |
| 1990 | 17.3 million | 7% |
| 2000 | 28.1 million | 10% |
| 2010 | 37 million | 13% |
| 2012 | 38.3 million | 13% |
| 2015 | 41 million | 14% |
| Sources:[16][49][50][51] | ||
In addition to Spanish-speaking Hispanic populations, younger generations of non-Hispanics in the United States seem to be learning Spanish in larger numbers due to the growing Hispanic population and increasing popularity of Latin American movies and music performed in the Spanish language. A 2009 American Community Survey (ACS) conducted by the United States Census Bureau, showed that Spanish was spoken at home by over 35 million people aged 5 or older,[52] making the United States the world's fifth-largest Spanish-speaking community, outnumbered only by Mexico, Colombia, Spain, and Argentina.[53][54] Since then, the number of persons reported on the ACS to speak Spanish at home has increased (see table).
In northern New Mexico and southern Colorado, Spanish speakers have been isolated for centuries in the southern Rockies, and developed a distinct dialect of Spanish spoken nowhere else: New Mexican Spanish. The dialect features a mix of Castilian, Galician and, more recently, Mexican Spanish, as well as Pueblo loan words. New Mexican Spanish also contains a large proportion of English loan words, particularly for technological words (e.g. bos, troca, and telefón).
Speakers of New Mexican Spanish are mainly descendants of Spanish colonists who arrived in New Mexico in the sixteenth through the eighteenth centuries. During this time, contact with the rest of Spanish America was limited, and New Mexican Spanish developed on its own course. In the meantime, Spanish colonists coexisted with and intermarried with Puebloan peoples and Navajos. After the Mexican–American War, New Mexico and all its inhabitants came under the governance of the English-speaking United States, and for the next hundred years, English-speakers increased in number.
Spanglish is a code-switching variant of Spanish and English and is spoken in areas with large bilingual populations of Spanish and English speakers, such as along the Mexico–United States border (California, Arizona, New Mexico, and Texas), Florida, and New York City.
Chinese
The population of Chinese speakers was increasing rapidly in the 20th century because the number of Chinese immigrants increased at a rate more than 50% since 1940.[55] 2.8 million Americans speak some variety of Chinese, which combined are counted by the federal census as the third most-spoken language in the country. Until the late 20th century, Yue dialects including Taishanese and Cantonese were the most common among immigrants or the descendants of immigrants, especially in California. Since the opening of the People's Republic of China, Mandarin, the official language in PRC and Republic of China (Taiwan) has become increasingly prevalent.[56] Many Americans of all ethnic backgrounds are also learning Mandarin and to a far lesser extent Cantonese.[56]
In New York City in 2002, Mandarin was spoken as a native language among only 10% of Chinese speakers but was predicted to replace Cantonese as the lingua franca among Chinese speakers.[57]
Tagalog
Tagalog speakers were already present in the United States as early as the late sixteenth century as sailors contracted by the Spanish colonial government. In the eighteenth century, they established settlements in Louisiana, such as Saint Malo. After the American annexation of the Philippines, the number of Tagalog speakers steadily increased, as Filipinos began to migrate to the U.S. as students or contract laborers. Their numbers, however, decreased upon Philippine independence, as some Filipinos were repatriated.
Today, Tagalog, together with its standardized form Filipino, is spoken by over a million and a half Filipino Americans and is promoted by Filipino American civic organizations and Philippine consulates. As Filipinos are the second largest Asian ethnic group in the United States, Tagalog is the second most spoken Asian language in the country. Taglish, a form of code-switching between Tagalog and English, is also spoken by a number of Filipino Americans.
Tagalog is also taught at some universities where a significant number of Filipinos exist. As it is the national and most spoken language of the Philippines, most Filipinos in the United States are proficient in Tagalog in addition to their local regional language.
Vietnamese

According to the 2010 Census, there are over 1.5 million Americans who identify themselves as Vietnamese in origin, ranking fourth among the Asian American groups and forming the largest Overseas Vietnamese population.
Orange County, California, is home to the largest concentration of ethnic Vietnamese outside Vietnam, especially in its Little Saigon area. Other significant Vietnamese communities are found in the metropolitan areas of San Jose, Houston, Seattle, Northern Virginia, and New Orleans. Similarly to other overseas Vietnamese communities in Western countries (except France), the Vietnamese population in the United States was established following the Fall of Saigon in 1975 and communist takeover of South Vietnam following the Vietnam War.
Korean
In 2011 over 1.1 million Americans spoke Korean at home. This number increased greatly at the end of the 20th century, increasing 327% from the 300,000 speakers in 1980. The greatest concentration of these speakers was in the Los Angeles, New York, and Washington metro areas.[58] Speakers of Korean are found in the Koreatowns.
French
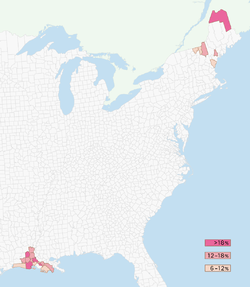
French, the fourth-most-common language (when all varieties of French are combined and separate yet related languages such as Haitian Creole are counted as French), is spoken mainly by the Louisiana Creole, native French, Cajun, Haitian, and French-Canadian populations. It is widely spoken in Maine, New Hampshire, Vermont, and in Louisiana, with notable Francophone enclaves in St. Clair County, Michigan, many rural areas of the Upper Peninsula of Michigan and the northern San Francisco Bay area. Because of its legacy in Louisiana, that state is served by the Council for the Development of French in Louisiana (CODOFIL), the only state agency in the United States whose mission is to serve a linguistic population, which registered Louisiana as an observer in the economic and cultural Organisation internationale de la Francophonie in 2018.[59]
Three varieties of French developed within what is now the United States in colonial times: Louisiana French, Missouri French, and New England French (essentially a variant of Canadian French).[60] French is the second language in the states of Louisiana and Maine. The largest French-speaking communities in the United States reside in Northeast Maine; Hollywood and Miami, Florida; New York City; certain areas of rural Louisiana; and small minorities in Vermont and New Hampshire. Many of the New England communities are connected to the dialect found across the border in Quebec or New Brunswick. More than 13 million Americans possess primary French heritage, but only 2 million speak French or a French Creole language at home.
German

German was a widely spoken language in some of the colonies, especially Pennsylvania, where a number of German-speaking Protestants and other religious minorities settled to escape persecution in Europe. Another wave of settlement occurred when Germans fleeing the failure of 19th Century German revolutions emigrated to the United States. A large number of these German immigrants settled in the urban areas, with neighborhoods in many cities being German-speaking and numerous local German language newspapers and periodicals established. German farmers also took up farming around the country, including the Texas Hill Country, at this time. The language was widely spoken until the United States entered World War I.
In the early twentieth century, German was the most widely studied foreign language in the United States, and prior to World War I, more than 6% of American schoolchildren received their primary education exclusively in German, though some of these Germans came from areas outside of Germany proper. Currently, more than 49 million Americans claim German ancestry, the largest self-described ethnic group in the U.S., but less than 4% of them speak a language other than English at home, according to the 2005 American Community Survey.[61] The Amish speak a dialect of German known as Pennsylvania German. One reason for this decline of German language was the perception during both World Wars that speaking the language of the enemy was unpatriotic; foreign language instruction was banned in places during the First World War. Unlike earlier waves, they were more concentrated in cities and integrated quickly. Another reason for the decline in German was the lack of first-generation immigrants, as immigration to the United States from Western Europe slowed following the World Wars.
There is a myth (known as the Muhlenberg Vote) that German was to be the official language of the U.S., but this is inaccurate and based on a failed early attempt to have government documents translated into German.[62] The myth also extends to German being the second official language of Pennsylvania; however, Pennsylvania has no official language. Although more than 49 million Americans claim they have German ancestors, only 1.24 million Americans speak German at home. Many of these people are either Amish and Mennonites or Germans having newly immigrated (e.g. for professional reasons).
Hindi and Urdu
Hindi and Urdu are the two standard registers of the Hindustani language, an Indo-Aryan language native to North India, Central India, and Pakistan. While the formal registers draw vocabulary from Sanskrit and Arabic & Persian respectively, the colloquial forms are indistinguishable. Hindi and Urdu are widely spoken among the Indian and Pakistani communities in the United States as a first or second language. Speakers are concentrated in states with large South Asian populations, including California, Illinois, New Jersey, New York, Texas and Virginia.[63]
Additionally, Hindi-Urdu is an important cultural language for South Asians who have different mother tongues. Bollywood in particular, as well as film music, is an important cultural product that influences South Asian youth. Many South Indians, Indian Bengalis and Bangladeshis learn the language through films and music and Hindustani, when mixed with English, is a community lingua franca.[64][65]
Arabic
Varieties of Arabic are spoken by immigrants from the Middle East as well as many Muslim Americans. The highest concentrations of native Arabic speakers reside in heavily urban areas like Chicago, New York City, and Los Angeles. Detroit and the surrounding areas of Michigan boast a significant Arabic-speaking population including many Arab Christians of Lebanese, Syrian, and Palestinian descent.
Arabic is used for religious purposes by Muslim Americans and by some Arab Christians (notably Catholics of the Melkite and Maronite Churches as well as Rum Orthodox, i.e. Antiochian Orthodox Christians and Coptic churches.). A significant number of educated Arab professionals who immigrate often already know English quite well, as it is widely used in the Middle East. Lebanese immigrants also have a broader understanding of French as do many Arabic-speaking immigrants from North Africa.
Italian
The Italian language and its various dialects have been widely spoken in the United States for more than one hundred years, primarily due to large-scale immigration from the late 19th century to the mid 20th century.
In addition to Standard Italian learned by most people today, there has been a strong representation of the dialects and languages of Southern Italy amongst the immigrant population (Sicilian and Neapolitan in particular). As of 2009, though 15,638,348 American citizens report themselves as Italian-Americans, only 753,992 of these report speaking the Italian language at home (0.3264% of the US population).
Dutch
There has been a Dutch presence in America since 1602 when the government of the Republic of the Seven United Netherlands chartered the Dutch East India Company (Vereenigde Oostindische Compagnie, or VOC) with the mission of exploring for a passage to the Indies and claiming any uncharted territories for the Dutch republic. In 1664, English troops under the command of the Duke of York (later James II of England) attacked the New Netherland colony. Being greatly outnumbered, director general Peter Stuyvesant surrendered New Amsterdam, with Fort Orange following soon. New Amsterdam was renamed New York, Fort Orange was renamed Fort Albany. Dutch city names can still be found in New York's neighbourhoods. Harlem is named after Haarlem, Staten Island is named after Staten Eiland, and Brooklyn is named after Breukelen.
Dutch was still spoken in many parts of New York at the time of the Revolution. For example, Alexander Hamilton's wife Eliza Hamilton attended a Dutch-language church during their marriage.
African-American abolitionist and women's rights activist Sojourner Truth (born "Isabella Baumfree") was a native speaker of Dutch.
Martin Van Buren, the first President born in the United States following its independence, spoke Dutch as his native language, making him the only President whose first language was not English.
In a 1990 demographic consensus, 3% of surveyed citizens claimed descent from Dutch settlers. Modern estimates place the Dutch American population at 5 million, lagging just a bit behind Scottish Americans and Swedish Americans.
Notable Dutch Americans include the Roosevelts (Theodore Roosevelt, Franklin Delano Roosevelt, and Eleanor Roosevelt), Marlon Brando, Thomas Alva Edison, Martin Van Buren and the Vanderbilts. The Roosevelts are direct descendants of Dutch settlers of the New Netherland colony in the 17th century.
Around 136,000 people in the United States still speak the Dutch language at home today. They are concentrated mainly in California (23,500), Florida (10,900), Pennsylvania (9,900), Ohio (9,600), New York (8,700) and Michigan (6,600; i.e. almost entirely in the city of Holland).[66]
A vernacular dialect of Dutch known as Jersey Dutch was spoken by a significant number of people in the New Jersey area between the start of the 17th century to the mid-20th century. With the beginning of the 20th century, usage of the language became restricted to internal family circles, with an ever-growing number of people abandoning the language in favor of English. It suffered gradual decline throughout the 20th century, and it ultimately dissipated from casual usage.
Finnish
The first Finnish settlers in America were amongst the settlers who came from Sweden and Finland to the New Sweden colony. Most colonists were Finnish. However, the Finnish language was not preserved as well among subsequent generations as Swedish.
Between the 1890s and the outbreak of the first World War, an estimated quarter million Finnish citizens immigrated to the United States, mainly in rural areas of the Midwest and more specifically in the mining regions of Northeastern Minnesota, Northern Wisconsin and Michigan's Upper Peninsula. Hancock, Michigan, as of 2005, still incorporates bi-lingual street signs written in both English and Finnish.[67] Americans of Finnish origin yield at 800,000 individuals, though only 26,000 speak the language at home. There is a distinctive dialect of English to be found in the Upper Peninsula, known as Yooper. Yooper often has a Finnish cadence and uses Finnish sentence structure with modified English, German, Swedish, Norwegian, and Finnish vocabulary. Notable Finnish Americans include U.S. Communist Party leader Gus Hall, film director Renny Harlin, and the Canadian-born actress Pamela Anderson.
Northern Clark County, Washington (encompassing Yacolt, Amboy, Battle Ground and Chelatchie) contains a large exclave of Old Apostolic Lutherans who originally immigrated from Finland. Many families in this portion of the county speak fluent Finnish at home before learning English. Another noteworthy Finnish community in the United States is found in Lake Worth, Florida, north of Miami.
Russian
The Russian language is spoken in areas of some states, including New York, California, Washington, New Jersey, Illinois, Massachusetts, Pennsylvania, and Alaska. It is especially spoken in immigrant neighborhoods of some cities: New York City, Boston, Los Angeles, San Francisco, Philadelphia, Chicago, Seattle, Spokane, Miami, Vancouver, Washington, Portland, Oregon, and Woodburn, Oregon. The Russian-American Company used to own Alaska Territory until selling it after the Crimean War. Russian had always been limited, especially after the assassination of the Romanov dynasty of tsars. Starting in the 1970s and continuing until the mid-1990s, many people from the Soviet Union and later its constituent republics such as Russia, Ukraine, Belarus, and Uzbekistan have immigrated to the United States, increasing the language's usage in America.
The largest Russian-speaking neighborhoods in the United States are found in Brooklyn, Queens, and Staten Island in New York City (specifically the Brighton Beach area of Brooklyn); parts of Los Angeles, particularly West Los Angeles and West Hollywood; parts of Philadelphia, particularly the Far Northeast; and parts of Miami like Sunny Isles Beach.
In Nikolaevsk, Alaska, 66.57% of the population speaks Russian at home.[68]
Slavic Voice of America media group serves Russian-speaking Americans out of Dallas.
Hebrew
Modern Hebrew is spoken by Israeli immigrants. Liturgical Hebrew is used as a religious or liturgical language[69] by many of the United States' approximately 7 million[70] Jews.
Ilocano
Like the Tagalogs, the Ilocanos are an Austronesian stock which came from the Philippines. They were the first Filipinos to migrate en masse to the United States. They first entered the State of Hawaii and worked there in the vast plantations.
As they did in the Philippine provinces of Northern Luzon and Mindanao, they quickly gained importance in the areas where they settled. Thus, the state of Hawaii became no less different from the Philippines in terms of percentage of Ilocano speakers.
Like Tagalog, Ilocano is also being taught in universities where most of the Filipinos reside.
South Asian languages
There are many South Asians in the United States. These include Indians, Pakistanis, and Bangladeshis, who speak various South Asian languages. Major South Asian languages spoken in the US include Telugu (see "Telugu" below), Malayalam, Kannada, Tamil, Gujarati, Hindi and Urdu (see 'Hindi-Urdu" above), Bengali, Punjabi, Sinhala, Nepali (see "Nepali" below), and Marathi.
Tamil
The Tamil community in the United States is largely bilingual. Tamil is taught in weekly classes in many Hindu temples and by associations such as the American Tamil Academy in South Brunswick, Tamil Jersey School in Jersey City, New Jersey,[71]
The written form of the language is highly formal and quite distinct from the spoken form. A few universities, such as the University of Chicago and the University of California Berkeley, have graduate programs in the language.[72]
In the second half of the 20th century, Tamils from India migrated as skilled professionals to the United States, Canada, Europe, and Southeast Asia. The Tamil American population numbers over 195,685 individuals,[73] and the Federation of Tamil Sangams of North America functions as an umbrella organization for the growing community.[74]
The New York City and Los Angeles metropolitan areas are home to the largest concentrations of Tamil-speaking Sri Lankan Americans.[75][76][77] New York City's Staten Island alone is estimated to be home to more than 5,000 Sri Lankan Americans,[78] one of the largest Sri Lankan populations outside Sri Lanka itself,[79] and a significant proportion of whom speak Tamil.

Central New Jersey is home to the largest population concentration of Tamils. New Jersey houses its own Tamil Sangam.[80] Sizeable populations of Indian American Tamils have also settled in the New York City and Washington metropolitan areas, as well as on the West Coast in Silicon Valley, where there are Tamil associations such as the Bay Area Tamil Mandram.[81] The New York City and Los Angeles metropolitan areas are home to the largest concentrations of Tamil-speaking Sri Lankan Americans,[82][83][84] with New York City's Staten Island alone estimated to be home to more than 5,000 Sri Lankan Americans,[78] one of the largest Sri Lankan populations outside Sri Lanka itself,[85] and a significant proportion of whom speak Tamil.
Telugu
In the second half of the 20th century, Telugu people from India migrated as professionals to the United States, Canada, Europe, and Southeast Asia. The Telugu American population enumerates over 886,988 individuals,[86] and the Federation of Telugu Sangams of North America functions as an NATA & TANA organizations for the growing community.
Central New Jersey is home to the largest population concentration of Telugu people. Telugu people have also settled in New York City and the DC metropolitan area, as well as on the West Coast in Silicon Valley, where there are Telugu associations such as TANA, ATA & NATA. The New York City and Los Angeles metropolitan areas are home to the largest concentrations of Telugu-speakers.
Irish
About 40 million Americans have Irish ancestry, many of whose ancestors would have spoken Irish. According to the 2007 American Community Survey, 22,279 people speak Irish at home. As of 2008 it was the 76th most spoken language in the United States.[87]
Khmer (Cambodian)
Between 1981 and 1985 about 150,000 Cambodians resettled in the United States.[88] Before 1975 very few Cambodians came to the United States. Those who did were children of upper-class families sent abroad to attend school. After the fall of Phnom Penh to the communist Khmer Rouge in 1975, some Cambodians managed to escape. In 2007 the American Community Survey reported that there were approximately 200,000 Cambodians living in the United States, making up about 2% percent of the Asian population. This population is, however, heavily concentrated in two areas: the Los Angeles metropolitan area in California, especially the city of Long Beach; and Greater Boston in New England, especially Lowell, Massachusetts. These two areas hold a majority of the Cambodians living in the US.
Polish
The Polish language is very common in the Chicago metropolitan area. Chicago's third largest white ethnic groups are those of Polish descent, after German and Irish.[89] The Polish people and the Polish language in Chicago were very prevalent in the early years of the city, and today the 650,000 Poles in Chicago make up one of the largest ethnically Polish populations in the world, comparable to the city of Wrocław, the fourth largest city in Poland. That makes it one of the most important centers of Polonia and the Polish language in the United States, a fact that the city celebrates every Labor Day weekend at the Taste of Polonia Festival in Jefferson Park.[90]
Portuguese
The first Portuguese speakers in America were Portuguese Jews who had fled the Portuguese Inquisition. They spoke Judeo-Portuguese and founded the earliest Jewish communities in the Thirteen Colonies, two of which still exist: Congregation Shearith Israel in New York and Congregation Mikveh Israel in Philadelphia. However, by the end of the 18th century, their use of Portuguese had been replaced by English.
In the late 19th century, many Portuguese, mainly Azoreans, Madeirans and Cape Verdeans (who prior to independence in 1975 were Portuguese citizens), immigrated to the United States, settling in cities like Providence, Rhode Island, New Bedford, Massachusetts, and Santa Cruz, California. There was also a substantial Portuguese immigration to Hawaii, which at the time was not yet part of the United States.
In the mid-late 20th century there was another wave of Portuguese immigration to the US, mainly the Northeast (New Jersey, New York, Connecticut, Massachusetts), and for a time Portuguese became a major language in Newark, New Jersey. Many Portuguese Americans may include descendants of Portuguese settlers born in Portuguese Africa (known as Portuguese Africans, or, in Portugal, as retornados) and Asia (mostly Macau). There were around 1 million Portuguese Americans in the United States by the year 2000. Portuguese (European Portuguese) has been spoken in the United States by small communities of immigrants, mainly in the metropolitan New York City area, like Newark, New Jersey.
The Portuguese language is also spoken widely by Brazilian Americans, concentrated in Miami, New York City, and Boston.
Swedish

There has been a Swedish presence in America since the New Sweden colony came into existence in March 1638.
Widespread diaspora of Swedish immigration did not occur until the latter half of the 19th century, bringing in a total of a million Swedes. No other country had a higher percentage of its people leave for the United States except Ireland and Norway. At the beginning of the 20th century, Minnesota had the highest ethnic Swedish population in the world after the city of Stockholm.
3.7% of US residents claim descent from Scandinavian ancestors, amounting to roughly 11–12 million people. According to SIL's Ethnologue, over half a million ethnic Swedes still speak the language, though according to the 2007 American Community Survey only 56,715 speak it at home. Cultural assimilation has contributed to the gradual and steady decline of the language in the US. After the independence of the US from the Kingdom of Great Britain, the government encouraged colonists to adopt the English language as a common medium of communication, and in some cases, imposed it upon them. Subsequent generations of Swedish Americans received education in English and spoke it as their first language. Lutheran churches scattered across the Midwest started abandoning Swedish in favor of English as their language of worship. Swedish newspapers and publications alike slowly faded away.
There are sizable Swedish communities in Minnesota, Ohio, Maryland, Philadelphia, and Delaware, along with small isolated pockets in Pennsylvania, San Francisco, Fort Lauderdale, and New York. Chicago once contained a large Swedish enclave called Andersonville on the city's north side.
John Morton, the person who cast the decisive vote leading to Pennsylvania's support for the United States Declaration of Independence, was of Finnish descent. Finland was part of the Kingdom of Sweden in the 18th century.
Welsh
Up to two million Americans are thought to have Welsh ancestry. However, there is very little Welsh being used commonly in the United States. According to the 2007 American Community Survey, 2,285 people speak Welsh at home; primarily spoken in California (415), Florida (225), New York (204), Ohio (135), and New Jersey (130).[91] Some place names, such as Bryn Mawr in Chicago and Bryn Mawr, Pennsylvania (English: Big Hill) are Welsh. Several towns in Pennsylvania, mostly in the Welsh Tract, have Welsh namesakes, including Uwchlan, Bala Cynwyd, Gwynedd, and Tredyffrin.
Yiddish
Yiddish has a much longer history in the United States than Hebrew.[92] It has been present since at least the late 19th century and continues to have roughly 148,000 speakers as of the 2009 American Community Survey. Though they came from varying geographic backgrounds and nuanced approaches to worship, immigrant Jews of Eastern Europe and Russia were often united under a common understanding of the Yiddish language once they settled in America, and at one point dozens of publications were available in most East Coast cities. Though it has declined by quite a bit since the end of WWII, it has by no means disappeared. Many Israeli immigrants and expatriates have at least some understanding of the language in addition to Hebrew, and many of the descendants of the great migration of Ashkenazi Jews of the past century pepper their mostly English vocabulary with some loan words. Furthermore, it is a lingua franca among Orthodox Jewry (particularly Hasidic Jewry), concentrated in Los Angeles, Miami, and New York.[93]
Nepali
The first Nepalese to enter the United States were classified as "other Asian". Immigration records show that between 1881 and 1890, 1,910 "other Asians" were admitted to the United States. However, Nepal did not open its borders until 1950, and most Nepalis who left the country during that time went primarily to India to study. Nepalese Americans were first classified as a separate ethnic group in 1974 when 56 Nepalese immigrated to the United States. New York City, Boston, Chicago, Denver, Gainesville, Florida, Portland, Oregon and Saint Paul, Minnesota have the largest number of Nepalese. There are some Nepalese community or cultural events in every American state, including Dashain, Tihar, Losar, Holi, Teej Special, and Nepali New Year.
New American languages, dialects, and creoles
Several languages have developed on American soil, including creoles and sign languages.
African-American English
Often simply called AAE and known in North America as Black English, is a variety of American English along a continuum, spoken primarily by urban working-class and (largely bidialectal and codeswitching) middle-class African Americans.[94]. It is generally accepted among linguists and many African Americans that Southern American English is closely related to AAE because AAE is part of a historical continuum between creoles such as Gullah and Southern American English.
Some educators view AAE as exerting a negative influence on the learning of Standard English, as AAE differs grammatically from Standard English. Other educators, however, propose that Standard English should be taught as a "second dialect" in educational contexts where AAE is a strong part of students' culture.
Chinuk Wawa or Chinook Jargon
A Creole language of 700–800 words of French, English, Cree and other Native origins. It is the old trade language of the Pacific Northwest. It was used extensively among both European and Native peoples of the Oregon Territory, even used instead of English at home by many pioneer families. It is estimated that around 100,000 people spoke it at its peak, between 1858 and 1900, and it was last widely used in Seattle just before World War II.[95]
Gullah
An English-African creole language spoken on the Sea Islands of South Carolina and Georgia, retains strong influences of West African languages. The language is sometimes referred to as "Geechee".
Hawai'i Creole English
Commonly used by locals and is considered an unofficial language of the state.
Louisiana Creole French
A French Creole language spoken by the Louisiana Creole people of the state of Louisiana, close to Haitian Creole, Colonial French, and Cajun French (language of Acadians deported from New France after 1755 and the Grand Dérangement). French Creole languages are spoken by millions of people worldwide, mainly in the United States, Caribbean, and Indian Ocean areas.
Outer Banks languages
In the islands of the Outer Banks off North Carolina, several unique English dialects have developed. This is evident on Harkers Island and Ocracoke Island. These dialects are sometimes referred to as "high tider".
Pennsylvania German
A language that traditionally was spoken mainly in Pennsylvania, but that since the 19th century has spread to the Midwest (Ohio, Indiana, Iowa and other states), where the majority of speakers live today. It evolved from the German dialect of the Palatinate brought over to America by the Pennsylvania Dutch people before 1800. Originally spoken by adherents of different Christian denominations (Lutherans, Mennonites, Amish, German Baptist Brethren, Catholics) today it is mainly spoken by Amish and Old Order Mennonites.
Texas Silesian
A dialect of Silesian used by Texas Silesians in American settlements from 1852 to the present.
Chesapeake Bay Islander
Another dialectal isolate is that spoken on Tangier Island, Virginia and Smith Island, Maryland, both located toward the southern end of the Chesapeake Bay. The dialect is partially derived from English as spoken by English pre-Revolutionary settlers, and partially from the present-day Middle-Atlantic American dialect of English. It also contains some words from the Cornish language, the Celtic language spoken in Cornwall in southwest England.
Chicano English
An English dialect spoken mainly by Mexican Americans in the Southwestern United States, with influences from Spanish.
Romani
Angloromani is a creole English language spoken by Romani Americans.
Sign languages
.png)
Alongside the numerous and varied oral languages, the United States also boasts several sign languages. Historically, the US was home to some six or more sign languages (that number rising with the probability that Plains Sign Talk is actually a language family with several languages under its umbrella) which has fallen with the death of several of these.
As with all sign languages around the world that developed organically, these are full languages distinct from any oral language. American Sign Language (unlike Signed English) is not a derivation of English.[96] Some languages present here were trade pidgins which were used first as a system of communication across national and linguistic boundaries of the Native Americans, however, they have since developed into mature languages as children learned them as a first language.
American Sign Language
American Sign Language (ASL) is the native language of a number of deaf and hearing people in America (roughly 100,000 to 500,000). While some sources have stated that ASL is the third most frequently used language in the United States, after English and Spanish,[97] recent scholarship has pointed out that most of these estimates are based on numbers conflating deafness with ASL use, and that the last actual study of this (in 1972) seems to indicate an upper bound of 500,000 ASL speakers at the time.[98]
Black American Sign Language
Black American Sign Language (BASL) developed in the southeastern US, where separate residential schools were maintained for white and black deaf children. BASL shares much of the same vocabulary and grammatical structure as ASL and is generally considered one of its dialects.[96][97][99]
Hawai'i Sign Language
Hawaii Sign Language is moribund with only a handful of speakers on O'ahu, Lana'i, Kaua'i and possibly Ni'ihau. Some of these speakers may actually be speaking a creolized version of HSL and ASL, however, research is slow-going. The language was once called Hawai'i Pidgin Sign Language as many people thought it was a derivation of ASL which was discovered to be false and to be a separate language altogether.[100]
Plains Sign Talk
Once a trade pidgin and the most far-reaching sign language in North America, Plains Sign Talk or Plains Sign Language is now critically endangered with an unknown number of speakers.
Navajo Sign Language
Navajo Sign Language has been found to be in use in one clan of Navajo; however, whether it is a dialect of Plains Sign Talk or a separate language remains unknown.[101]
Plateau Sign Language
Another trade pidgin that may have become a separate language, Plateau Sign Language replaced Plains Sign Talk in the Columbia Plateau and surrounding regions of British Columbia, Washington, Oregon, and Idaho. It is now extinct.
Martha's Vineyard Sign Language
Martha's Vineyard Sign Language is now extinct. Along with French Sign Language, it was one of several main contributors to American Sign Language.
Henniker Sign Language
Henniker Sign Language is now extinct but was once found around the Henniker region of New Hampshire and formed a basis for American Sign Language.
Sandy River Valley Sign Language
Sandy River Valley Sign Language is now extinct but once could be found around the Sandy River Valley in Maine. It was one of several main contributors to American Sign Language.
See also
- American English
- Language education in the United States
- Language Spoken at Home (U.S. Census)
- List of multilingual presidents of the United States
- Muhlenberg legend
- List of U.S. communities where English is not the majority language spoken at home
- Modern Language Association
General:
Notes
- The United States does not have an official designated language. A bill known as H.R.997—the English Language Unity Act—was introduced in 2017 in an attempt to make English the official language.[1]
References
- "English Language Unity Act of 2017". Archived from the original on August 3, 2017. Retrieved August 2, 2017.
- Siebens, J & T Julian. Native North American Languages Spoken at Home in the United States and Puerto Rico: 2006–2010. United States Census Bureau. December 2011.
- "Census Data Of USA". US Census Bureau. Archived from the original on October 20, 2012. Retrieved August 17, 2012.
- "Detailed Languages Spoken at Home and Ability to Speak English for the Population 5 Years and Over for United States: 2014-2018". census.gov.
- Grimes 2000
- "American Community Survey, Language Spoken at Home by Ability to Speak English for the Population 5 Years and Over(Table B16001)2013-2017 5-year estimates". Archived from the original on February 14, 2020. Retrieved December 13, 2018.
- Census Bureau Reports at Least 350 Languages Spoken in U.S. Homes, U.S. Census Bureau, November 3, 2015, retrieved July 3, 2018
- At Least 350 Languages Spoken In US Homes: New Report, CNBC, November 4, 2015, retrieved July 3, 2018
- "Table 53. Languages Spoken At Home by Language: 2017", Language use in the United States, August 2019, U.S. Census Bureau, retrieved February 19, 2016
- "American FactFinder - Results". Factfinder.census.gov. Archived from the original on February 12, 2020. Retrieved May 29, 2017.
- Leeman, Jennifer (2018). "It's all about English: The interplay of monolingual ideologies, language policies and the U.S. Census Bureau's statistics on multilingualism". International Journal of the Sociology of Language. 2018 (252): 21–43. doi:10.1515/ijsl-2018-0013.
- Stevens, Gillian (1999). "A Century of U.S. Censuses and the Language Characteristics of Immigrants". Demography. 36 (3): 387–397. doi:10.2307/2648061. JSTOR 2648061.
- "Selected Social Characteristics in the United States: 2007". United States Census Bureau. Archived from the original on April 25, 2009. Retrieved October 9, 2008.
- "English Usage Among Hispanics in the United States". Pew Research Center's Hispanic Trends Project. November 29, 2007. Archived from the original on December 15, 2012. Retrieved January 18, 2015.
- Ancestry: 2000, U.S. Census Bureau, 2000, archived from the original on February 10, 2020
- "Language Use and English-Speaking Ability: 2000" (PDF). U.S. Census Brueau. October 2003. Archived (PDF) from the original on February 18, 2008. Retrieved February 22, 2008.
- "EAC Issues Glossaries of Election Terms in Five Asian Languages Translations to Make Voting More Accessible to a Majority of Asian American Citizens". Election Assistance Commission. June 20, 2008. Archived from the original on July 31, 2008. Retrieved January 18, 2015.
- "FYI: English isn't the official language of the United States".
- "States". Englishfirst.org. Archived from the original on February 16, 2017. Retrieved February 5, 2017.
- "U.S. English Efforts Lead West Virginia to Become 32nd State to Recognize English as Official Language". Archived from the original on January 10, 2017.
- "Alaska's indigenous languages attain official status" Archived February 12, 2017, at the Wayback Machine, Reuters.com, October 24, 2014. Retrieved October 30, 2014.
- "Bill History/Action for 28th Legislature HB 216". The Alaska State Legislature. Archived from the original on February 4, 2017.
- Alaska OKs Bill Making Native Languages Official Archived January 20, 2015, at the Wayback Machine April 21, 2014; Bill Chappell; NPR.org
- "South Dakota recognizes official indigenous language". March 25, 2019.
- James W. Parins (November 4, 2013). Literacy and Intellectual Life in the Cherokee Nation, 1820–1906. University of Oklahoma Press. p. 248. ISBN 978-0-8061-5122-9.
- David W. Voorhees, "Dutch Political Identity in English New York" in Four Centuries of Dutch-American Relations: 1609-2009 (eds. Hans Krabbendam, Cornelis A. van Minnen & Giles Scott-Smith: SUNY Press, 2009), pp. 132-33.
- California Department of Motor Vehicles Website (actual website blocked by Wikipedia)
- America Votes 2006: Key Ballot Issues, CNN, archived from the original on February 9, 2008, retrieved February 22, 2008
- "Arizona Voter Empowerment Card, 2010 Elections" (PDF). American Civil Liberties Union. Retrieved September 3, 2015.
- Heath, Shirley Brice & Frederick Mandabach. Language Status Decisions and the Law in the United States, in Cobarrubias, Juan & Joshua A. Fishman, eds., Progress in Language Planning, p. 94 (1983)
- Sick, Bastian (May 19, 2004). German as the official language of the USA? Archived September 13, 2005, at the Wayback Machine, Spiegel Online (in English)
- Mikkelson, David (2008). German Almost Became Official Language, Snopes
- Alice N. Nash; Christoph Strobel (2006), "Daily life of Native Americans from post-Columbian through nineteenth-century America", The Greenwood Press "Daily life through history" series, Greenwood Publishing Group, p. IX, ISBN 978-0-313-33515-0
- "The Cherokee Nation & its Language" (PDF). University of Minnesota: Center for Advanced Research on Language Acquisition. 2008. Archived (PDF) from the original on July 14, 2014. Retrieved May 22, 2014.
- Thompson, Irene (August 6, 2013). "Cherokee". Aboutworldlanguages.com/. Archived from the original on May 21, 2014. Retrieved May 22, 2014.
- Joyner, Michael (September 30, 2010). Cherokee Lessons - Introductory Edition. Lulu Enterprises Incorporated. pp. 16–17. Retrieved June 1, 2013.
- "Native American languages". Infoplease.com. Archived from the original on September 24, 2015. Retrieved October 23, 2015.
- Chavez, Will (April 5, 2012). "Immersion students win trophies at language fair". Cherokeephoenix.org. Archived from the original on May 25, 2013. Retrieved April 8, 2013.
- "Native Now : Language: Cherokee". We Shall Remain - American Experience - PBS. 2008. Archived from the original on April 7, 2014. Retrieved April 9, 2014.
- "Cherokee Language Revitalization Project". Western Carolina University. 2014. Archived from the original on April 7, 2014. Retrieved April 9, 2014.
- Hauk, Alexis. "Radio Free Cherokee: Endangered Languages Take to the Airwaves". The Atlantic. Archived from the original on January 16, 2014. Retrieved April 9, 2014.
- "Table 1. Detailed Languages Spoken at Home and Ability to Speak English for the Population 5 Years and Over for the United States: 2006-2008 : Release Date: April, 2010" (XLS). Census.gov. Archived from the original on September 22, 2014. Retrieved January 18, 2015.
- A language's endonym may not be available for a variety of possible reasons: The language in question encompasses multiple dialects with unique endonyms; The language in question is actually a language family; The language or community of speakers has a prohibition against writing the language; No documentation is immediately available; etc.
- Respondents who reported speaking English less than "Very Well." The total margin of error for this group was 1.78%; however, margins of error for individual languages, especially those with few total speakers, may exceed 100% in some cases.
- "North America :: UNITED STATES". CIA The World Factbook. Archived from the original on July 6, 2015.
- "Hindi most spoken Indian language in US, Telugu speakers up 86% in 8 years".
- "Detailed Languages Spoken at Home by English-Speaking Ability for the Population 5 Years and Over: 2011" (PDF). Census.gov. Archived from the original (PDF) on November 9, 2015. Retrieved October 20, 2015.
- "Driver License and Identification Card Information". Dmv.ca.gov. Archived from the original on September 30, 2014. Retrieved January 18, 2015.
- "What is the future of Spanish in the United States?". Pew Research Center. September 5, 2013. Archived from the original on January 18, 2015. Retrieved January 18, 2015.
- "The Future of Spanish in the United States". Census.gov. Archived from the original on January 18, 2015. Retrieved January 18, 2015.
- Data Access and Dissemination Systems (DADS). "American FactFinder - Results". Factfinder2.census.gov. Archived from the original on February 12, 2020. Retrieved January 18, 2015.
- "Table 53. Languages Spoken At Home by Language: 2009", The 2012 Statistical Abstract, U.S. Census Bureau, archived from the original on December 25, 2007, retrieved December 27, 2011
- Instituto Cervantes (Enciclopedia del español en Estados Unidos)
- "Más 'speak spanish' que en España". Archived from the original on May 20, 2011. Retrieved October 6, 2007.
- Dicker, Susan J. (January 1, 2003). Languages in America: A Pluralist View. Multilingual Matters. ISBN 9781853596513.
chinese.
- Lai, H. Mark (2004), Becoming Chinese American or Taiwanese American: A History of Communities and Institutions, AltaMira Press, ISBN 978-0-7591-0458-7
- García, Ofelia; Fishman, Joshua A. (2002), The Multilingual Apple: Languages in New York City, Walter de Gruyter, ISBN 978-3-11-017281-2
- Bureau, US Census. "More Than 1 Million U.S. Residents Speak Korean at Home". The United States Census Bureau. Retrieved April 22, 2020.
- Thiery, Clément (October 18, 2018). "La décision de l'OIF confirme la renaissance du français en Louisiane". France-Amérique (in French). New York. Archived from the original on May 24, 2019.
- Ammon, Ulrich; International Sociological Association (1989). Status and Function of Languages and Language Varieties. Walter de Gruyter. pp. 306–308. ISBN 978-0-89925-356-5. Archived from the original on December 20, 2012. Retrieved April 23, 2012.
- "Archived copy". Archived from the original on April 3, 2009. Retrieved November 27, 2008.CS1 maint: archived copy as title (link)
- Did Hebrew almost become the official U.S. language?, January 21, 1994, archived from the original on February 13, 2008, retrieved February 22, 2008
- Bureau, U. S. Census. "American FactFinder - Results". factfinder.census.gov. Archived from the original on June 8, 2012. Retrieved August 30, 2019.
- Shankar, Shalini (2008). "Speaking like a Model Minority: "FOB" Styles, Gender, and Racial Meanings among Desi Teens in Silicon Valley". Journal of Linguistic Anthropology. 18 (2): 268–289. doi:10.1111/j.1548-1395.2008.00022.x.
- Shankar, Shalini (2010). "REEL TO REAL: DESI TEENS' LINGUISTIC ENGAGEMENTS WITH BOLLYWOOD" (PDF). Pragmatics. 14: 317–335. doi:10.1075/prag.14.2-3.12sha.
- "Dutch : Source: American Community Survey : 5-Year Estimates, Public Use Microdata Sample, 2006–2010". Mla.org. Archived from the original on November 13, 2013. Retrieved January 18, 2015.
- Street names are in English and in Finnish, The Selonen Family Network, archived from the original on September 24, 2006, retrieved February 22, 2008
- "Data Center Results". May 25, 2017. Archived from the original on May 25, 2017. Retrieved October 16, 2017.CS1 maint: BOT: original-url status unknown (link)
- Eric L. Friedland (1981). "Hebrew Liturgical Creativity in Nineteenth-Century America". Modern Judaism. 1 (3): 323–336. doi:10.1093/mj/1.3.323. JSTOR 1396251.
- "Brandeis University Study Finds that American-Jewish Population is Significantly Larger than Previously Thought" (PDF). February 2, 2007. Archived (PDF) from the original on October 2, 2013. Retrieved November 30, 2013.
- See "School offers Tamil language classes" Sentinel Sept. 4, 2014 Archived March 15, 2016, at the Wayback Machine
- Vasudha Narayanan, "Tamils" in David Levinson and Melvin Ember, eds. American immigrant cultures: builders of a nation (1997). p. 878.
- US Census 2006-2008 American Community Survey See Row# 125
- "ABOUT FETNA". Federation of Tamil Sangams of North America. Archived from the original on January 16, 2013. Retrieved April 1, 2013.
- "Yearbook of Immigration Statistics: 2012 Supplemental Table 2". U.S. Department of Homeland Security. Retrieved March 31, 2013.
- "Yearbook of Immigration Statistics: 2011 Supplemental Table 2". U.S. Department of Homeland Security. Retrieved March 31, 2013.
- "Yearbook of Immigration Statistics: 2010 Supplemental Table 2". U.S. Department of Homeland Security. Retrieved March 31, 2013.
- Kirk Semple (June 8, 2013). "Sri Lankans have gathered on Staten Island,..." The New York Times. Archived from the original on October 5, 2013. Retrieved June 9, 2013.
- "Why Staten Island?". Little Sri Lanka. Retrieved July 25, 2015.
- New Jersey Tamil Sangam Archived September 2, 2010, at the Wayback Machine
- Bay Area Tamil Manram Archived October 27, 2010, at the Wayback Machine
- "Yearbook of Immigration Statistics: 2012 Supplemental Table 2". U.S. Department of Homeland Security. Archived from the original on April 3, 2013. Retrieved March 31, 2013.
- "Yearbook of Immigration Statistics: 2011 Supplemental Table 2". U.S. Department of Homeland Security. Archived from the original on August 8, 2012. Retrieved March 31, 2013.
- "Yearbook of Immigration Statistics: 2010 Supplemental Table 2". U.S. Department of Homeland Security. Archived from the original on July 12, 2012. Retrieved March 31, 2013.
- "Why Staten Island?". Little Sri Lanka. Archived from the original on July 26, 2015. Retrieved July 25, 2015.
- US Census 2006-2008 American Community Survey See Row# 122 Archived June 4, 2011, at the Wayback Machine
- "Language Use in the US 2006–2008 (850k Excel file!)". US Census Bureau. Archived from the original on June 22, 2011. Retrieved June 23, 2011.
- Archived March 25, 2009, at the Wayback Machine
- "Archived copy". Archived from the original on February 14, 2020. Retrieved July 27, 2016.CS1 maint: archived copy as title (link)
- America the diverse: Chicago's Polish neighborhoods, usaweekend.com, May 15, 2005, retrieved July 4, 2008
- "Welsh : Source: Census 2000, Summary File 3". Mla.org. Archived from the original on April 2, 2015. Retrieved January 18, 2015.
- Joshua A. Fishman (1991). "Appendix: The Hebrew Language in the United States". Yiddish: turning to life. John Benjamins Publishing Company. pp. 148–159. ISBN 978-90-272-2075-2. Archived from the original on January 2, 2016.
- Sewell Chan (October 17, 2007), "A Yiddish Revival, With New York Leading the Way", The New York Times, archived from the original on September 30, 2008, retrieved August 15, 2008
+ Patricia Ward Biederman (July 7, 2005), "Yiddish Program Aims to Get Beyond Schmoozing", Los Angeles Times, archived from the original on February 21, 2009, retrieved August 15, 2008
+ Yiddishkayt Los Angeles, yiddishkaytla.org, archived from the original on July 24, 2008, retrieved August 15, 2008 - Edwards (2004), p. 383.
- Jones, Nard (1972). Seattle. Garden City, New York: Doubleday. p. 94 et. seq. ISBN 978-0-385-01875-3.. Quotation is from p. 97.
- Lewis, M. Paul (2013). Simons, Gary F.; Fennig, Charles D. (eds.). "American Sign Language". Ethnologue: Languages of the World, Seventeenth edition. SIL International. Archived from the original on March 9, 2013.
- Paul Preston (1995), Mother father deaf: living between sound and silence, Harvard University Press, p. 243, ISBN 978-0-674-58748-9, archived from the original on January 2, 2016
- Mitchell, Ross E.; Young, Travas A.; Bachleda, Bellamie; Karchmer, Michael A. (2006), "How Many People Use ASL in the United States? Why Estimates Need Updating" (PDF), Sign Language Studies, 6 (3): 306–335, doi:10.1353/sls.2006.0019, archived from the original (PDF) on June 4, 2011
- Clayton Valli; Ceil Lucas (2000), "Sociolinguistic Aspects of the Black deaf Community", Linguistics of American Sign Language: an introduction, Gallaudet University Press, pp. 416–428, ISBN 978-1-56368-097-7, archived from the original on January 2, 2016
- Lambrecht, Linda; Earth, Barbara; Woodward, James (March 3, 2013), History and Documentation of Hawaiʻi Sign Language: First Report, University of Hawaiʻi: 3rd International Conference on Language Documentation and Conservation, archived from the original on March 22, 2013
- Samuel J. Supalla (1992) The Book of Name Signs, p. 22
Bibliography
- Campbell, Lyle. (1997). American Indian languages: The historical linguistics of Native America. New York: Oxford University Press.
- Campbell, Lyle; & Mithun, Marianne (Eds.). (1979). The languages of native America: Historical and comparative assessment. Austin: University of Texas Press.
- Grimes, Barbara F. (Ed.). (2000). Ethnologue: Languages of the world, (14th ed.). Dallas, TX: SIL International. ISBN 1-55671-106-9. Online edition: http://www.ethnologue.com/, accessed on December 7, 2004.
- Mithun, Marianne. (1999). The languages of native North America. Cambridge: Cambridge University Press.
- Zededa, Ofelia; Hill, Jane H. (1991). The condition of Native American Languages in the United States. In R. H. Robins & E. M. Uhlenbeck (Eds.), Endangered languages (pp. 135–155). Oxford: Berg.
Further reading
- Blatt, Ben. "Tagalog in California, Cherokee in Arkansas." Slate. May 13, 2014.
External links
- Bilingualism in the United States
- Detailed List of Languages Spoken at Home for the Population 5 Years and Over by State: U.S. Census 2000
- Foreign Languages in the U.S. About foreign languages and language learning in the United States
- How many indigenous American languages are spoken in the United States? By how many speakers?
- Native Languages of the Americas
- Ethnologue report for USA
- Linguistic map of the United States of America
- Modern Language Association Language Map
Countries.png)